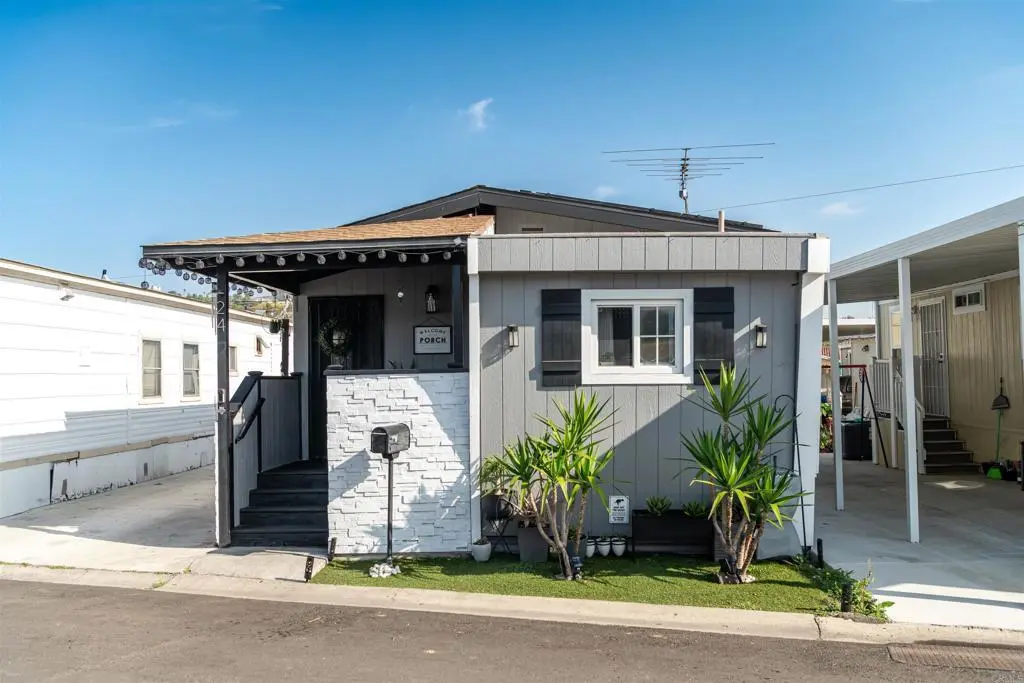
3221 Bancroft Dr #24 · Spring Valley, CA
Flood risk 1/10 · Minimal
- FEMA flood zone
- X (unshaded)
- Chance of flooding over 30 yrs
- 0.0%
- Est. flood insurance / yr
- $507 – $1,088
Fire risk 4/10 · Minor
- Est. fire insurance / yr
- $659 – $1,223
Heat risk 5/10 · Moderate
- Hot days now (above 95°F)
- 7 days/yr
- Hot days in 30 yrs
- 20 days/yr
Wind risk 1/10 · Minimal
- Chance of severe wind over 30 yrs
- —
Air-quality risk 3/10 · Minor
- Unhealthy air days now
- 3 days/yr
- Unhealthy air days in 30 yrs
- 3 days/yr
Risk factors via First Street. Map © Google.
Why this score? — see what drove the B- grade
The composite is a weighted blend of 9 inputs, each scored 0–100. Each bar is that input's sub-score; the figure is the points it added to the 100-point composite (weight × sub-score).
- Cash flow +28.3/30.0
- DSCR +10.0/10.0
- ARV discount +9.6/15.0
- 1% rule +7.8/10.0
- Schools +4.4/10.0
- Livability +3.0/5.0
- Rent growth +2.7/5.0
- Condition / age +2.5/5.0
- Appreciation +0.0/10.0
$196,000
🖨 Deal sheet 📄 Offer letter ✓ Due diligence
Listing remarks
Park approval is required space rent is $ 891.06. Come and see this clean, warm and cozy mobile home near to Schools, shopping center, access to freeways, etc. There is a bedroom addition, have been upgraded with solar panels system, all appliances are included, a helpful and convenient Storage unit.
Key facts
- Solar panels system
- Storage unit
- Bedroom addition
Tags
Property features AI
Finance
- Other: Lot features: 0-1 unit/acre; Living area and lot size source: Assessor's data; Park name / community identifier present
- Financial info: Assessments: Unknown; Rent includes: None
- HOA & community: Land lease community with monthly land lease; Land lease: $891 per month (expires June 30, 2030); Manager approval required
Exterior
- Parking: Three uncovered parking spaces (total 3)
- Utilities: Electricity connected; Water heater unit (in appliances list); Sewer and other utilities not specified
- Home design: Single-story mobile home (10' x 48'); Mobile home remains on site
- Construction: Shingle roof; Updated / remodeled; Foundation: see remarks; Year built: assessor
- Exterior features: Front porch; Has patio; Community pool; Park nearby; Paved road access
Interior
- Kitchen: Refrigerator; Microwave; Gas range; Water heater unit
- Bedrooms: Entry level bedroom(s)
- Bathrooms: One full bathroom with bathtub
- Heating & cooling: Cooling present (see remarks)
- Interior features: One-level living; Updated / remodeled condition; Entry on main level; Has view
- Laundry & utility: Laundry area on site
Neighborhood map
What this means for you Summary
Snapshot
- This is a 3-bed/1.0-bath manufactured listed at $196k.
Deal economics
- At list price, monthly cash flow is $631 ($8k/yr) — positive.
- The deal already cash-flows at list — no discount required.
- Meets the 1% rule at list price ($3k rent vs $196k).
- Recommended offer: $178k (9.0% below list) — sets the bar for market timing.
- Cap rate 10.2% vs local median 2.9% in Spring Valley — top-decile yield for the area; either an underpriced asset or a hidden risk that comps aren't pricing in. Stress-test before assuming the spread holds.
Location & tenants
- Location reads 59/100 on livability (#627 in CA) — a working-class tenant base; expect higher turnover. Strengths: commute A+, employment A, housing B+; Watch: schools D+, crime F, amenities F.
- La Mesa-Spring Valley (suburban): math 41% / reading 53% proficiency, ranked #478 of 1,400 in CA (top 34%) — families likely to look elsewhere, expect single-tenant / working-renter base with shorter leases.
- Market conditions: Rents flat; 158 active listings in the ZIP; 40 comparable units currently listed for rent nearby; rentals leasing fast (median 2d on market — plan ~1-2 weeks tenant-placement turnaround); solid renter incomes; 11,759 units permitted in San Diego County in 2024 (7,244 in 5+ unit buildings).
- This rent runs 30% of the median local income ($100k/yr) — at the standard rent-burdened threshold; future hikes will face affordability resistance.
Forward outlook
- Local home prices are declining (-3.0%/yr); year-one equity from $1k of loan paydown is wiped out by about $6k of value loss. Plan a longer hold.
- San Diego County population projected at +20% by 2050 — long-run rental-demand tailwind backs the buy-and-hold thesis.
Negotiation context
- It's been on market 92 days — a 9% lower offer ($178k) is reasonable based on typical stale-listing flexibility.
- 2 sale attempts with the ask held roughly flat each time — persistent listings suggest the price (not the market) is what's stuck; bring a comps-based counter.
Risks & watch-outs
- Climate carrying-cost: extreme-heat days projected 7→20/yr by 2055 (HVAC capex compounding) — expect insurance premiums to compound above CPI over the hold.
Questions for the listing agent
- It's been on market 92 days. Have you received any prior offers? Is the seller open to a 9% concession, seller financing, or rate buy-down credit?
- Built in 1963 — when were the roof, HVAC, electrical panel, plumbing, and water heater last replaced?
- Why hasn't it sold? Are there any deal-killer items the seller is aware of (foundation, flood, title, zoning, code violations)?
- Is there a deadline driving the sale (1031 exchange, divorce, estate, relocation)? That informs how much negotiation room exists.
- Schools are D-rated, which usually means shorter tenancies and higher turnover. Who's the typical renter profile here, and what's been the actual vacancy rate?
- Crime grade is F in this area — have there been break-ins, vandalism, or insurance claims at this property in the last 3 years? What carrier currently insures it and at what premium?
- What's the average days-on-market for RENTAL listings here right now (not sales)? A rising rental-DOM trend means longer vacancies and softer asking-rent achievability than the comps imply.
- What's the recent tenant-quality profile in this submarket — average credit score on applications, eviction rate, late-payment / NSF rate, and stable-employment percentage? A property-management company in the area should have these aggregated.
- How much new for-sale + rental construction is in the pipeline within 1–3 miles? Heavy new supply typically softens prices + rents 12–24 months out; constrained supply supports both.
Investment metrics
- 1% rule
- 1.28% ✓
- Cap rate
- 10.16%
- Cash-on-cash
- 13.80%
- DSCR
- 1.61
- GRM
- 6.5
CMA / ARV
- ARV (on-the-fly)
- $205,632
- Comps found
- 2
Show comp detail 2 sales within ~0.75 mi
| Address | Dist | Beds/Ba | Sqft | Sold | Price | $/sf | Match |
|---|---|---|---|---|---|---|---|
| 2515 Sweetwater Rd #87 | 0.72mi | 2/2.0 (-1) | 841 (-3%) | 22mo | $200,000 | $238 | 35 |
| 2515 Sweetwater Rd #32 | 0.72mi | 2/1.5 (-1) | 800 (-7%) | 24mo | $183,000 | $229 | 27 |
Match score weights: distance 35% · size 25% · config 20% · recency 20%. Top-matched comps best support the ARV.
Projected returns pro-forma
-3.0% appreciation · 0.88% rent growth · sell at horizon
- IRR
- 1.6%
- Equity multiple
- 1.06×
- Total profit
- $3,212
- Equity at exit
- $29,224
- IRR
- 9.0%
- Equity multiple
- 1.62×
- Total profit
- $34,049
- Equity at exit
- $16,946
Cash invested: $54,880 (down + closing). Projections, not guarantees.
Landlord ↔ Tenant lean methodology
- Overall (STATE)
- 18 Strongly Tenant-Friendly
- State California
- 18 Strongly Tenant-Friendly · D+13
- County
- — inherits STATE
- City
- — inherits STATE
ZIP-level market 91977
- Rents YoY
- 0.9%
- Active inventory
- 158
- Price-to-rent
- 6.5×
Monthly cashflow live
- Estimated rent
- $2,513 high interval (Pro) →
- Mortgage (P&I)
- −$1,028
- Tax est. 1.5%
- −$245 /mo · $2,940/yr
- Insurance
- −$82
- HOA
- −$0
- Vacancy / Maint / Mgmt
- −$528
- Net cashflow
- $631
Break-even live
UW: 25.0% down · 7.5% · 30yr · 1.5% tax · 5.0% vac · 8.0% maint · 8.0% mgmt
Financing live
Cash to close
- Down payment
- $49,000
- Closing costs
- $5,880
- Reserves months
- —
- Total cash needed
- —
Loan-product check · same deal, 3 products live
Conventional
25% down · 7.5% · 30yr
- Down + closing
- —
- Monthly P&I
- —
- Monthly cashflow
- —
- DSCR
- —
- Eligible?
- —
Personal DTI + credit; lowest rate.
DSCR
20% down · 8.5% · 30yr
- Down + closing
- —
- Monthly P&I
- —
- Monthly cashflow
- —
- DSCR
- —
- Eligible?
- —
No personal income docs; deal must DSCR.
Hard money
10% down · 12.0% · 12mo
- Down + closing
- —
- Monthly P&I
- —
- Monthly cashflow
- —
- DSCR
- —
- Eligible?
- —
Short-term bridge; refi at stabilization.
Rent comps 40 comps
| Address | Beds | Baths | Sqft | Rent | $/sqft | DOM | Units | Dist |
|---|---|---|---|---|---|---|---|---|
| 3542 Bancroft Dr Unit A Spring Valley, CA | 2.0 | 1.0 | 700 | $1,795 | $2.56 | 1d | 1 | 0.29mi |
| 3540 Bancroft Dr Unit A Spring Valley, CA | 2.0 | 1.0 | 700 | $1,795 | $2.56 | 21d | 1 | 0.29mi |
| 3532 Bancroft Dr Unit A Spring Valley, CA | 2.0 | 1.0 | 700 | $1,895 | $2.71 | 1d | 1 | 0.29mi |
| 9121 Kenwood Dr Spring Valley, CA | 2.0 | 2.0 | 1000 | $2,172 | $2.17 | 1d | 7 | 0.30mi |
| 9209 Kenwood Dr Spring Valley, CA | 2.0 | 1.0 | 850 | $2,188 | $2.57 | 1d | 4 | 0.32mi |
| 3560 James Cir Unit 8 Spring Valley, CA | 2.0 | 1.0 | 915 | $2,350 | $2.57 | 1d | 1 | 0.39mi |
| 8836 Valencia St Spring Valley, CA | 2.0 | 1.0 | 832 | $3,500 | $4.21 | 1d | 1 | 0.46mi |
| 3535 Helix St Spring Valley, CA | 2.0 | 1.0 | 1000 | $2,350 | $2.35 | 17d | 1 | 0.48mi |
| 8619 Sandy Bev Ln Lemon Grove, CA | 2.0 | 1.0 | 812 | $2,795 | $3.44 | 1d | 1 | 0.53mi |
| 8355 Golden Ave Lemon Grove, CA | 2.0 | 2.0 | 1037 | $2,999 | $2.89 | 1d | 1 | 0.76mi |
| 9230 Campo Rd Unit NA Spring Valley, CA | 2.0 | 2.0 | 800 | $3,000 | $3.75 | 1d | 1 | 0.77mi |
| 3755 Fairway Dr La Mesa, CA | 1.0–2.0 | 1.0 | 735 | $2,433 | $3.31 | 1d | 4 | 0.81mi |
| 8230 Lemon Grove Way Unit 3 Lemon Grove, CA | 2.0 | 1.0 | 800 | $1,925 | $2.41 | 1d | 1 | 0.98mi |
| 3541 Kenora Dr Spring Valley, CA | 2.0–3.0 | 1.0 | 922 | $2,750 | $2.98 | 1d | 3 | 1.09mi |
| 3038 Washington St Lemon Grove, CA | 2.0 | 1.0 | 700 | $2,700 | $3.86 | 1d | 1 | 1.09mi |
| 4300 Echo Ct La Mesa, CA | 2.0–3.0 | 2.0 | 1075 | $3,125 | $2.91 | 1d | 4 | 1.17mi |
| 3146 S Bonita St Spring Valley, CA | 2.0 | 1.0 | 999 | $3,000 | $3.00 | 1d | 1 | 1.18mi |
| 3827 Conrad Dr Spring Valley, CA | 2.0 | 1.0 | 900 | $2,426 | $2.70 | 1d | 1 | 1.19mi |
| 8110 Lemon Grove Way Unit 8110-7 Lemon Grove, CA | 2.0 | 1.5 | 700 | $2,295 | $3.28 | 1d | 1 | 1.20mi |
| 4242 Spring St La Mesa, CA | 1.0–2.0 | 1.0–2.0 | 900 | $2,745 | $3.05 | 1d | 4 | 1.23mi |
| 4302 Palm Ave La Mesa, CA | 2.0 | 1.0–2.0 | 911 | $2,825 | $3.10 | 1d | 3 | 1.25mi |
| 9860 Dale Ave Unit C8 Spring Valley, CA | 2.0 | 2.0 | 950 | $2,495 | $2.63 | 1d | 1 | 1.26mi |
| 9860 Dale Ave Unit C12 Spring Valley, CA | 2.0 | 2.0 | 1000 | $2,600 | $2.60 | 4d | 1 | 1.26mi |
| 3600 S Bonita St Apt D Spring Valley, CA | 2.0 | 1.0 | 843 | $2,150 | $2.55 | 1d | 1 | 1.27mi |
| 8075 Palm St Lemon Grove, CA | 2.0 | 1.0 | 900 | $2,750 | $3.06 | 10d | 1 | 1.28mi |
| 3605 Grove St Lemon Grove, CA | 2.0 | 2.0 | 1022 | $2,600 | $2.54 | 23d | 1 | 1.30mi |
| 3917 Conrad Dr Spring Valley, CA | 1.0–2.0 | 1.0–2.0 | 860 | $2,304 | $2.68 | 1d | 7 | 1.30mi |
| 4350 Palm Ave La Mesa, CA | 1.0–2.0 | 1.0–2.0 | 760 | $2,995 | $3.94 | 1d | 2 | 1.31mi |
| 4341 Spring St La Mesa, CA | 2.0 | 1.0–1.5 | 712 | $2,391 | $3.36 | 1d | 7 | 1.32mi |
| 7950 Broadway Lemon Grove, CA | 1.0–2.0 | 1.0–2.0 | 811 | $3,205 | $3.95 | 1d | 4 | 1.33mi |
| 3639 S Bonita St Apt 5 Spring Valley, CA | 2.0 | 2.0 | 850 | $2,195 | $2.58 | 24d | 1 | 1.33mi |
| 3639 S Bonita St Unit 02 Spring Valley, CA | 2.0 | 2.0 | 850 | $1,995 | $2.35 | 10d | 1 | 1.33mi |
| 3639 S Bonita St Spring Valley, CA | 2.0 | 2.0 | 850 | $1,995 | $2.35 | 7d | 1 | 1.33mi |
| 3620 S Barcelona St Spring Valley, CA | 2.0 | 1.0 | 850 | $2,150 | $2.53 | 1d | 1 | 1.36mi |
| 4032 N Bonita St Spring Valley, CA | 2.0 | 1.0 | 700 | $1,975 | $2.82 | 1d | 1 | 1.41mi |
| 4032 N Bonita St Unit 4032-1 Spring Valley, CA | 2.0 | 1.0 | 700 | $1,995 | $2.85 | 7d | 1 | 1.41mi |
| 3643 S Barcelona St Unit 03 Spring Valley, CA | 2.0 | 1.0 | 850 | $1,795 | $2.11 | 1d | 1 | 1.41mi |
| 9211 Amys St Spring Valley, CA | 2.0 | 2.0 | 805 | $1,745 | $2.17 | 1d | 1 | 1.46mi |
| 9948 San Juan St #4 Spring Valley, CA | 2.0 | 2.0 | 924 | $2,800 | $3.03 | 17d | 1 | 1.47mi |
| 1624 Canyon Rd Spring Valley, CA | 2.0 | 1.0 | 800 | $2,355 | $2.94 | 1d | 4 | 1.48mi |
Listing history 17 events
-
2026-06-18days on market $196,000 Active 92 DOM
-
2026-06-17days on market $196,000 Active 91 DOM
-
2026-06-16days on market $196,000 Active 90 DOM
-
2026-06-15days on market $196,000 Active 89 DOM
-
2026-06-13days on market $196,000 Active 87 DOM
-
2026-06-09days on market $196,000 Active 83 DOM
-
2026-06-08days on market $196,000 Active 82 DOM
-
2026-06-07days on market $196,000 Active 81 DOM
-
2026-06-04days on market $196,000 Active 78 DOM
-
2026-06-03days on market $196,000 Active 77 DOM
-
2026-06-02days on market $196,000 Active 76 DOM
-
2026-06-01days on market $196,000 Active 75 DOM
-
2026-05-31days on market $196,000 Active 74 DOM
-
2026-03-17$196,000 Active
-
2026-01-01historical
-
2025-10-23price $196,000
-
2025-06-01$215,000 Active
ⓘ Source: listings_history table (triggers on properties + properties_extension) + one-shot
backfill from property_details.listing_events for pre-trigger history.
Climate risk First Street
- Flood 1/10 Low FEMA zone X (unshaded) · 0% chance over 30 yrs
- Wildfire 4/10 Moderate
- Heat 5/10 Major 7 d/yr ≥95°F today · 20 d/yr by 30 yrs out
- Wind 1/10 Low
- Air quality 3/10 Moderate 3 unhealthy d/yr today · 3 by 30 yrs out
Nearby sold comps map
Loading sold comps map…
Walkable amenities ~0.75 mi
Loading nearby amenities…
Taxation est. · year 1
- Rental income
- $30,159
- − Mortgage interest
- −$10,979
- − Property taxes
- −$2,940
- − Insurance
- −$980
- − Repairs & maintenance
- −$2,413
- − Management
- −$2,413
- − Depreciation
- −$5,702
- Taxable income
- $4,732
- Est. tax owed @ 24.0%
- −$1,136
- After-tax cash flow
- $6,435/yr
For passive investors: Depreciation is non-cash, so a rental often shows a tax loss while cash-flowing — sheltering income. Rental losses are passive: they offset passive income freely, and up to $25,000/yr can offset ordinary (W-2) income if you actively participate and your MAGI is under $100k (phasing out to $0 by $150k); unused losses carry forward. On sale, claimed depreciation is recaptured at up to 25%, and gains may owe capital-gains tax (a 1031 exchange can defer both). Figures are a year-1 estimate at your 24.0% rate — not tax advice; consult a CPA.
Schools (NCES district)
- District
- La Mesa-Spring Valley
- NCES district ID
- 0620250
- Math proficiency
- 41% ▲ 1.00%
- Reading proficiency
- 53% ▬ 0.00%
- Median HH income
- $61,742
- Composite
- 43.53/100
- National rank
- #6442
- State rank
- #478 of 1400 in CA
Livability — Spring Valley
- Score
- 59/100
- State rank
- #627
- US rank
- #19882
Category grades
Schools grade is shown separately in the Schools card above.
Census & demographics
- Census place
- Spring Valley, CA
- County
- San Diego County · 3,178,799 people
- City population
- 61,064
- Metro
- San Diego-Chula Vista-Carlsbad, CA
- Population (ZIP)
- 61,064
- Household income
- $99,657
- Rent vs Own
- Severe rent burden
- 2007.0
Population outlook (San Diego County) Hauer SSP2
- Today (2025)
- 3,678,185 people
- By 2030
- 3,856,546 · +4.8%
- By 2040
- 4,171,407 · +13.4%
- By 2050
- 4,421,607 · +20.2%
- By 2075
- 4,831,599 · +31.4%
- By 2100
- 4,832,502 · +31.4%
Race, ethnicity, and origin ACS 2023
- Neighborhood character
- Diverse neighborhood (Simpson 0.68)
- Race & ethnicity
- Hispanic / Latino 46% White 29% Two or more races 19% Black 12% Asian 7% Native American 1%
- Hispanic origin (detail)
- Mexican 43%
- Common ancestry
- Portuguese 2% Lithuanian 1% Italian 1%
- Foreign-born
- 19% · Canada, China, Vietnam
- Languages at home
- 59% English-only · Spanish 32% Tagalog/Filipino 3% Arabic 1%
Political lean MEDSL · San Diego
- 2024 margin
- D (+16.8) · D 56.9% · R 40.1% · Other 2.9%
- 2008→2024 swing
- +6.6pp toward D · 2008: 10.2pp · 2024: 16.8pp
- All cycles
- 2024: D+16.8 2020: D+22.8 2016: D+17.8 2012: D+5.1 2008: D+10.2
Not yet ingested
- Civics
- —
Market trends
- HPI YoY
- ▼ -697.99%
- Current HPI
- 381.66
- Rent YoY
- ▲ 0.88%
- Metro
- San Diego-Chula Vista-Carlsbad, CA
- State GDP YoY
- ▲ 3.21%
- F500 in state
- 116
Industry mix (Fortune 500 HQ in CA)
| Industry | F500 HQs | Revenue |
|---|---|---|
| Technology | 27 | $1,492B |
|
||
| Financial Services | 3 | $174B |
|
||
| Retail | 3 | $44B |
|
||
| Insurance | 3 | $26B |
|
||
| Media / Entertainment | 2 | $115B |
|
||
| Pharmaceuticals / Biotech | 2 | $62B |
|
||
Price history
-8.8% since first listed4 events — show timeline
- 2026-03-17 Listed $196,000 CRMLS
- 2026-01-01 Listing Removed — CRMLS
- 2025-10-23 Price Changed $196,000 CRMLS
- 2025-06-01 Listed $215,000 CRMLS
Cash-flow waterfall
monthlySold comps — $/sqft
last 12 mo · ≤1 miLoading sold comps…