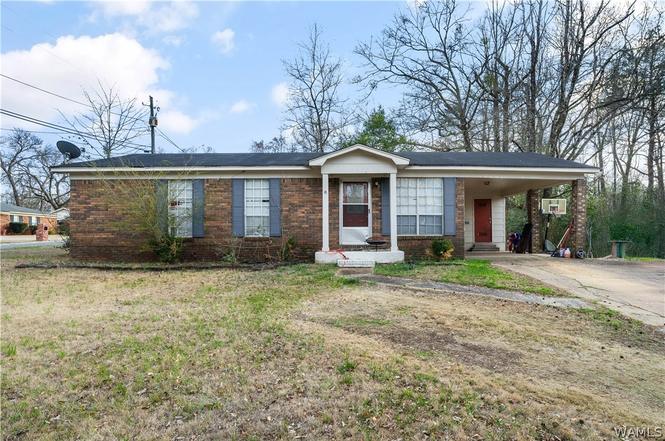
3903 31st St · Tuscaloosa, AL
Flood risk 1/10 · Minimal
- FEMA flood zone
- X (unshaded)
- Chance of flooding over 30 yrs
- 0.0%
- Est. flood insurance / yr
- $507 – $1,088
Fire risk 1/10 · Minimal
- Est. fire insurance / yr
- $916 – $1,700
Heat risk 7/10 · Major
- Hot days now (above 109°F)
- 7 days/yr
- Hot days in 30 yrs
- 20 days/yr
Wind risk 6/10 · Moderate
- Chance of severe wind over 30 yrs
- 56.0%
Air-quality risk 1/10 · Minimal
- Unhealthy air days now
- 0 days/yr
- Unhealthy air days in 30 yrs
- 0 days/yr
Risk factors via First Street. Map © Google.
Why this score? — see what drove the C grade
The composite is a weighted blend of 9 inputs, each scored 0–100. Each bar is that input's sub-score; the figure is the points it added to the 100-point composite (weight × sub-score).
- Cash flow +27.6/30.0
- DSCR +9.7/10.0
- 1% rule +6.6/10.0
- Rent growth +4.1/5.0
- Livability +3.9/5.0
- Schools +2.5/10.0
- Condition / age +2.5/5.0
- ARV discount +0.0/15.0
- Appreciation +0.0/10.0
$129,900
🖨 Deal sheet 📄 Offer letter ✓ Due diligence
Listing remarks MLS
If you are looking for a perfectly priced, renovated home on a corner lot, then say yes to this address! From the subtle, yet inviting landscaping to the newly painted shutters, trim and doors, this gently loved, sturdy, all-brick home says, “Come on in!” The sunlit interior is thoughtfully remodeled with an entertainment-friendly open floor plan, and new laminate flooring connecting the kitchen & living room. Every meal will taste better when prepared in the boldly designed kitchen with new stainless appliances and counters, crisp white cabinet doors, and snazzy backsplash. New carpet in the bedrooms freshens the spaces, and complements the new bathroom appointments. Want an almost new house? Come get it! Additional updates: paint, plumbing & electrical fixtures, ext door, and more.
Key facts
- Open floor plan
- Ample cabinetry
- Stylish backsplash
Tags
Neighborhood map
What this means for you Summary
Snapshot
- This is a 3-bed/1.0-bath single-family listed at $130k.
Deal economics
- At list price, monthly cash flow is $387 ($5k/yr) — positive.
- The deal already cash-flows at list — no discount required.
- Meets the 1% rule at list price ($2k rent vs $130k).
- Recommended offer: $128k (1.5% below list) — sets the bar for market timing.
- Cap rate 9.9% vs local median 3.4% in Tuscaloosa — top-decile yield for the area; either an underpriced asset or a hidden risk that comps aren't pricing in. Stress-test before assuming the spread holds.
Location & tenants
- Location reads 77/100 on livability (#9 in AL, #2,909 nationally) — a middle-class / working-renter tenant base. Strengths: amenities A+, health & safety A+, cost of living A; Watch: crime F, employment D-.
- Tuscaloosa City (urban): math 19% / reading 40% proficiency, ranked #74 of 129 in AL (top 57%) — low school quality limits family demand, transient renter base, plan for 1-2y turnover.
- Zoned schools: Westlawn Middle School (math 0% / reading 18%, grade F, #235 of 257 statewide, top 93%, 534 students, 93% FRL); Central High School (math 12% / reading 17%, grade F, #220 of 305 statewide, top 77%, 783 students, 84% FRL) — zoned schools average 88% FRL vs 59% district-wide (29 pts higher); higher-poverty schools than district average — tighter screening recommended.
- Zoned-school proficiency averages 12% at this address vs 30% district-wide (-18 pts) — the specific schools serving this property underperform the Tuscaloosa City average; the district grade overstates school quality for this exact location.
- Market conditions: Rents rising fast (+6.3%/yr); 306 active listings in the ZIP; 15 comparable units currently listed for rent nearby; rentals at typical pace (median 21d on market — plan ~3-4 weeks tenant-placement turnaround); 47% of comp listings sitting > 30 days — soft ceiling on asking rent; lower-income renter base — watch delinquency; 622 units permitted in Tuscaloosa County in 2024 (69 in 5+ unit buildings).
Forward outlook
- Local home prices are declining (-3.0%/yr); year-one equity from $898 of loan paydown is wiped out by about $4k of value loss. Plan a longer hold.
- Tuscaloosa County population projected at +26% by 2050 — long-run rental-demand tailwind backs the buy-and-hold thesis.
- At projected returns (-3.0% appreciation + 6.3% rent growth), your $36k cash investment doubles in ~8 years — after that, you're playing with house money.
Negotiation context
- It's been on market 23 days — a 2% lower offer ($128k) is reasonable based on typical stale-listing flexibility.
- 5 sale attempts since 10y ago with the ask held roughly flat each time — persistent listings suggest the price (not the market) is what's stuck; bring a comps-based counter.
- Current owner paid $100k; 30% above their basis — modest negotiation headroom, anchor on the comps not their cost.
Risks & watch-outs
- Climate carrying-cost: major wind risk, 56% chance of damaging wind over 30y; extreme-heat days projected 7→20/yr by 2055 (HVAC capex compounding) — expect insurance premiums to compound above CPI over the hold.
Questions for the listing agent
- Built in 1974 — when were the roof, HVAC, electrical panel, plumbing, and water heater last replaced?
- Is there a deadline driving the sale (1031 exchange, divorce, estate, relocation)? That informs how much negotiation room exists.
- Crime grade is F in this area — have there been break-ins, vandalism, or insurance claims at this property in the last 3 years? What carrier currently insures it and at what premium?
- What's the average days-on-market for RENTAL listings here right now (not sales)? A rising rental-DOM trend means longer vacancies and softer asking-rent achievability than the comps imply.
- What's the recent tenant-quality profile in this submarket — average credit score on applications, eviction rate, late-payment / NSF rate, and stable-employment percentage? A property-management company in the area should have these aggregated.
- How much new for-sale + rental construction is in the pipeline within 1–3 miles? Heavy new supply typically softens prices + rents 12–24 months out; constrained supply supports both.
Investment metrics
- 1% rule
- 1.16% ✓
- Cap rate
- 9.87%
- Cash-on-cash
- 12.77%
- DSCR
- 1.57
- GRM
- 7.2
CMA / ARV
- ARV (on-the-fly)
- $110,852
- Comps found
- 12
Show comp detail 12 sales within ~0.75 mi
| Address | Dist | Beds/Ba | Sqft | Sold | Price | $/sf | Match |
|---|---|---|---|---|---|---|---|
| 3903 31st St | 0.00mi | 3/1.0 | 1,036 (0%) | 1mo | $129,900 | $125 | 99 |
| 3504 36th Ct | 0.27mi | 3/1.0 | 950 (-8%) | 8mo | $148,500 | $156 | 67 |
| 3487 Willow Ln | 0.44mi | 3/1.0 | 1,032 (-0%) | 15mo | $115,500 | $112 | 66 |
| 3405 31st St | 0.40mi | 3/1.0 | 1,092 (+5%) | 8mo | $119,000 | $109 | 65 |
| 3411 35th Ct | 0.40mi | 3/1.0 | 1,125 (+9%) | 3mo | $115,000 | $102 | 64 |
| 2318 Fosters Ferry Rd Rd | 0.55mi | 3/1.0 | 974 (-6%) | 5mo | $104,500 | $107 | 60 |
| 4308 27th Street St | 0.47mi | 3/1.0 | 904 (-13%) | 5mo | $95,000 | $105 | 53 |
| 4701 Greenview Dr | 0.64mi | 3/1.5 | 1,110 (+7%) | 7mo | $169,900 | $153 | 50 |
| 3204 34th Ave. Ave | 0.41mi | 3/1.0 | 1,188 (+15%) | 11mo | $110,000 | $93 | 47 |
| 4909 Clover Road Rd | 0.73mi | 2/1.0 (-1) | 1,080 (+4%) | 8mo | $87,700 | $81 | 47 |
| 4222 27th St | 0.45mi | 3/1.0 | 900 (-13%) | 16mo | $34,900 | $39 | 44 |
| 4818 Greenview Dr | 0.74mi | 2/1.0 (-1) | 936 (-10%) | 12mo | $60,000 | $64 | 35 |
Match score weights: distance 35% · size 25% · config 20% · recency 20%. Top-matched comps best support the ARV.
Projected returns pro-forma
-3.0% appreciation · 6.29% rent growth · sell at horizon
- IRR
- 5.9%
- Equity multiple
- 1.24×
- Total profit
- $8,706
- Equity at exit
- $19,369
- IRR
- 17.9%
- Equity multiple
- 2.70×
- Total profit
- $61,726
- Equity at exit
- $11,231
Cash invested: $36,372 (down + closing). Projections, not guarantees.
Landlord ↔ Tenant lean methodology
- Overall (STATE)
- 90 Strongly Landlord-Friendly
- State Alabama
- 90 Strongly Landlord-Friendly · R+15
- County
- — inherits STATE
- City
- — inherits STATE
ZIP-level market 35401
- Rents YoY
- 6.3%
- Active inventory
- 306
- Price-to-rent
- 7.2×
Monthly cashflow live
- Estimated rent
- $1,502 high interval (Pro) →
- Mortgage (P&I)
- −$681
- Tax from tax record
- −$64 /mo · $767/yr
- Insurance
- −$54
- HOA
- −$0
- Vacancy / Maint / Mgmt
- −$315
- Net cashflow
- $387
Break-even live
UW: 25.0% down · 7.5% · 30yr · 1.5% tax · 5.0% vac · 8.0% maint · 8.0% mgmt
Financing live
Cash to close
- Down payment
- $32,475
- Closing costs
- $3,897
- Reserves months
- —
- Total cash needed
- —
Loan-product check · same deal, 3 products live
Conventional
25% down · 7.5% · 30yr
- Down + closing
- —
- Monthly P&I
- —
- Monthly cashflow
- —
- DSCR
- —
- Eligible?
- —
Personal DTI + credit; lowest rate.
DSCR
20% down · 8.5% · 30yr
- Down + closing
- —
- Monthly P&I
- —
- Monthly cashflow
- —
- DSCR
- —
- Eligible?
- —
No personal income docs; deal must DSCR.
Hard money
10% down · 12.0% · 12mo
- Down + closing
- —
- Monthly P&I
- —
- Monthly cashflow
- —
- DSCR
- —
- Eligible?
- —
Short-term bridge; refi at stabilization.
Rent comps 15 comps
| Address | Beds | Baths | Sqft | Rent | $/sqft | DOM | Units | Dist |
|---|---|---|---|---|---|---|---|---|
| 3416 36th Ct Tuscaloosa, AL | 3.0 | 2.0 | 1206 | $1,395 | $1.16 | 43d | 1 | 0.27mi |
| 4342 Tari St Tuscaloosa, AL | 3.0 | 2.0 | 1340 | $1,750 | $1.31 | 43d | 1 | 0.32mi |
| 4416 Tari St Tuscaloosa, AL | 3.0 | 2.0 | 1259 | $1,700 | $1.35 | 13d | 1 | 0.37mi |
| 3499 Joyce Lewis Ave Tuscaloosa, AL | 3.0 | 2.0 | 1340 | $1,700 | $1.27 | 20d | 1 | 0.41mi |
| 2405 Herman Ave Tuscaloosa, AL | 4.0 | 1.0 | 971 | $1,100 | $1.13 | 43d | 1 | 0.54mi |
| 3560 21st St Tuscaloosa, AL | 3.0 | 2.0 | 1230 | $1,570 | $1.28 | 20d | 1 | 0.75mi |
| 3524 20th St Tuscaloosa, AL | 3.0 | 1.0 | 1050 | $1,100 | $1.05 | 43d | 1 | 0.79mi |
| 5022 Virginia Cir Tuscaloosa, AL | 3.0 | 1.5 | 1161 | $1,350 | $1.16 | 43d | 1 | 0.98mi |
| 2825 25th St Tuscaloosa, AL | 2.0 | 1.0 | 708 | $835 | $1.18 | 43d | 1 | 0.99mi |
| 3316 16th St Tuscaloosa, AL | 3.0 | 1.0 | 1120 | $1,100 | $0.98 | 13d | 1 | 1.17mi |
| 2712 22nd St Tuscaloosa, AL | 4.0 | 2.0 | 1008 | $1,000 | $0.99 | 43d | 1 | 1.18mi |
| 2683 21st St Tuscaloosa, AL | 3.0 | 1.0 | 1324 | $895 | $0.68 | 20d | 1 | 1.29mi |
| 2720 21st St Tuscaloosa, AL | 4.0 | 1.0 | 1148 | $1,100 | $0.96 | 20d | 1 | 1.31mi |
| 1018 42nd Ave Tuscaloosa, AL | 3.0 | 1.0 | 1080 | $1,375 | $1.27 | 13d | 1 | 1.32mi |
| 711 36th Ave Tuscaloosa, AL | 2.0 | 1.0 | 920 | $900 | $0.98 | 13d | 1 | 1.44mi |
Listing history 9 events
-
2026-03-26status Pending
-
2026-03-03$129,900 Active
-
2019-09-03soldstatus $99,900
-
2019-08-30soldstatus $99,900 818-char remark
Show marketing remark (818 chars)
If you are looking for a perfectly priced, renovated home on a corner lot, then say yes to this address! From the subtle, yet inviting landscaping to the newly painted shutters, trim and doors, this gently loved, sturdy, all-brick home says, “Come on in!” The sunlit interior is thoughtfully remodeled with an entertainment-friendly open floor plan, and new laminate flooring connecting the kitchen & living room. Every meal will taste better when prepared in the boldly designed kitchen with new stainless appliances and counters, crisp white cabinet doors, and snazzy backsplash. New carpet in the bedrooms freshens the spaces, and complements the new bathroom appointments. Want an almost new house? Come get it! Additional updates: paint, plumbing & electrical fixtures, ext door, and more.
-
2019-07-26$99,900 818-char remark
Show marketing remark (818 chars)
If you are looking for a perfectly priced, renovated home on a corner lot, then say yes to this address! From the subtle, yet inviting landscaping to the newly painted shutters, trim and doors, this gently loved, sturdy, all-brick home says, “Come on in!” The sunlit interior is thoughtfully remodeled with an entertainment-friendly open floor plan, and new laminate flooring connecting the kitchen & living room. Every meal will taste better when prepared in the boldly designed kitchen with new stainless appliances and counters, crisp white cabinet doors, and snazzy backsplash. New carpet in the bedrooms freshens the spaces, and complements the new bathroom appointments. Want an almost new house? Come get it! Additional updates: paint, plumbing & electrical fixtures, ext door, and more.
-
2018-04-09$75,000
-
2016-09-05$83,900
-
2016-04-04$87,900
-
2007-10-04soldstatus $85,764
ⓘ Source: listings_history table (triggers on properties + properties_extension) + one-shot
backfill from property_details.listing_events for pre-trigger history.
Tax reassessment forecast AL · Resets to sale price
- Current annual tax
- $767 · $64/mo
- Projected year-2 tax
- $767 · $64/mo
- Expected delta
- $0/yr ($0/mo · 0.0%)
ⓘ Screening estimate from a state-policy table — verify with the county assessor before closing.
Climate risk First Street
- Flood 1/10 Low FEMA zone X (unshaded) · 0% chance over 30 yrs
- Wildfire 1/10 Low
- Heat 7/10 Severe 7 d/yr ≥109°F today · 20 d/yr by 30 yrs out
- Wind 6/10 Major 56% chance of damaging wind over 30 yrs
- Air quality 1/10 Low 0 unhealthy d/yr today · 0 by 30 yrs out
Nearby sold comps map
Loading sold comps map…
Walkable amenities ~0.75 mi
Loading nearby amenities…
Taxation est. · year 1
- Rental income
- $18,022
- − Mortgage interest
- −$7,276
- − Property taxes
- −$767
- − Insurance
- −$650
- − Repairs & maintenance
- −$1,442
- − Management
- −$1,442
- − Depreciation
- −$3,779
- Taxable income
- $2,666
- Est. tax owed @ 24.0%
- −$640
- After-tax cash flow
- $4,006/yr
For passive investors: Depreciation is non-cash, so a rental often shows a tax loss while cash-flowing — sheltering income. Rental losses are passive: they offset passive income freely, and up to $25,000/yr can offset ordinary (W-2) income if you actively participate and your MAGI is under $100k (phasing out to $0 by $150k); unused losses carry forward. On sale, claimed depreciation is recaptured at up to 25%, and gains may owe capital-gains tax (a 1031 exchange can defer both). Figures are a year-1 estimate at your 24.0% rate — not tax advice; consult a CPA.
Schools (NCES district)
- District
- Tuscaloosa City
- NCES district ID
- 0103360
- Math proficiency
- 19% ▼ -24.00%
- Reading proficiency
- 40% ▼ -1.00%
- Median HH income
- $37,474
- Composite
- 24.51/100
- National rank
- #7647
- State rank
- #74 of 129 in AL
Livability — Tuscaloosa
- Score
- 77/100
- State rank
- #9
- US rank
- #2909
Category grades
Schools grade is shown separately in the Schools card above.
Census & demographics
- Census place
- Tuscaloosa, AL
- County
- Tuscaloosa County · 206,491 people
- City population
- 134,228
- Metro
- Tuscaloosa, AL
- Population (ZIP)
- 43,459
- Household income
- $29,152
- Rent vs Own
- Severe rent burden
- 3997.0
Population outlook (Tuscaloosa County) Hauer SSP2
- Today (2025)
- 228,293 people
- By 2030
- 240,551 · +5.4%
- By 2040
- 263,856 · +15.6%
- By 2050
- 286,491 · +25.5%
- By 2075
- 335,783 · +47.1%
- By 2100
- 370,520 · +62.3%
Race, ethnicity, and origin ACS 2023
- Neighborhood character
- Diverse neighborhood (Simpson 0.58)
- Race & ethnicity
- Black 47% White 44% Hispanic / Latino 5% Two or more races 4% Asian 2%
- Common ancestry
- Slovak 2% Italian 1% Romanian 1%
- Foreign-born
- 3% · Canada, China
- Languages at home
- 96% English-only · Spanish 2% Other Indo-European 1% Chinese 1%
Political lean MEDSL · Tuscaloosa
- 2024 margin
- Strong R (+20.4) · D 39.4% · R 59.8%
- 2008→2024 swing
- -4.4pp toward R · 2008: -16.0pp · 2024: -20.4pp
- All cycles
- 2024: R+20.4 2020: R+14.8 2016: R+19.5 2012: R+17.4 2008: R+16.0
Not yet ingested
- Civics
- —
Market trends
- HPI YoY
- ▼ -191.40%
- Current HPI
- 179.8335
- Rent YoY
- ▲ 6.29%
- Metro
- Tuscaloosa, AL
- State GDP YoY
- ▲ 2.94%
- F500 in state
- 4
Industry mix (Fortune 500 HQ in AL)
| Industry | F500 HQs | Revenue |
|---|---|---|
| Financial Services | 1 | $8B |
|
||
| Healthcare | 1 | $5B |
|
||
Price history
+51.5% since first listed9 events — show timeline
- 2026-03-26 Pending — WAMLS
- 2026-03-03 Listed $129,900 WAMLS
- 2019-09-03 Sold (Public Records) $99,900 Public Records
- 2019-08-30 Sold (MLS) $99,900 WAMLS
- 2019-07-26 Listed $99,900 WAMLS
- 2018-04-09 Listed $75,000 WAMLS
- 2016-09-05 Listed $83,900 WAMLS
- 2016-04-04 Listed $87,900 WAMLS
- 2007-10-04 Sold (Public Records) $85,764 Public Records
Property tax history
+10.3%/yrLatest (2025): $767 · +4.1% YoY. Source: county tax records.
Cash-flow waterfall
monthlySold comps — $/sqft
last 12 mo · ≤1 miLoading sold comps…