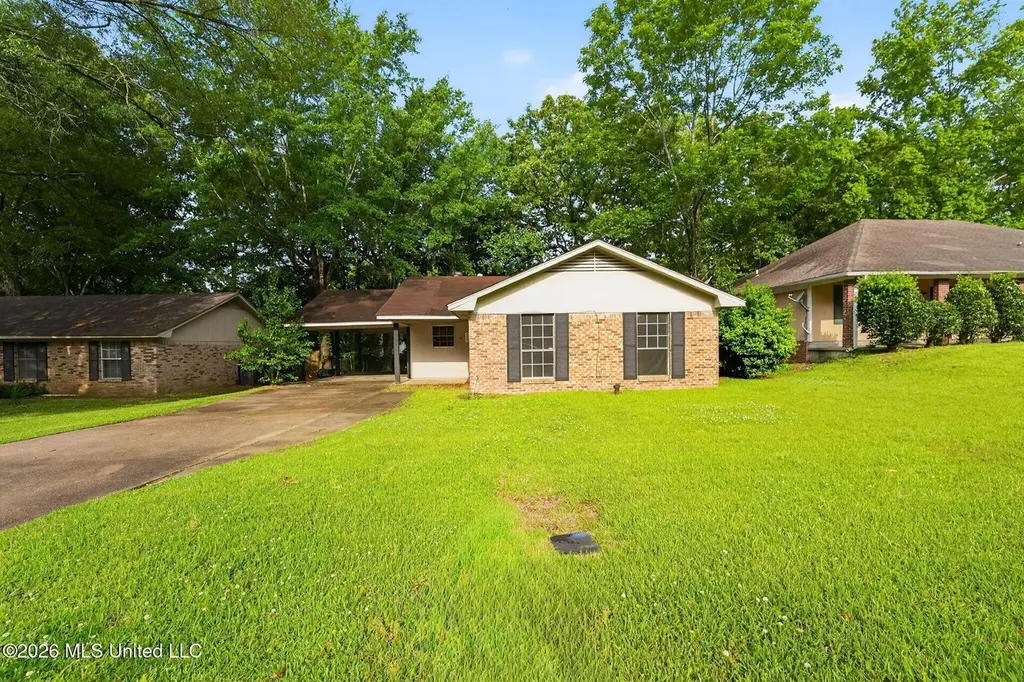
2137 Thousand Oaks Dr · Jackson, MS
Flood risk 1/10 · Minimal
- FEMA flood zone
- X (unshaded)
- Chance of flooding over 30 yrs
- 0.0%
- Est. flood insurance / yr
- $507 – $1,088
Fire risk 5/10 · Moderate
- Est. fire insurance / yr
- $1,241 – $2,305
Heat risk 7/10 · Major
- Hot days now (above 108°F)
- 7 days/yr
- Hot days in 30 yrs
- 20 days/yr
Wind risk 8/10 · Major
- Chance of severe wind over 30 yrs
- 80.0%
Air-quality risk 1/10 · Minimal
- Unhealthy air days now
- 0 days/yr
- Unhealthy air days in 30 yrs
- 0 days/yr
Risk factors via First Street. Map © Google.
Why this score? — see what drove the C grade
The composite is a weighted blend of 9 inputs, each scored 0–100. Each bar is that input's sub-score; the figure is the points it added to the 100-point composite (weight × sub-score).
- Cash flow +25.4/30.0
- DSCR +8.4/10.0
- 1% rule +7.1/10.0
- ARV discount +5.5/15.0
- Rent growth +3.6/5.0
- Livability +3.4/5.0
- Condition / age +2.5/5.0
- Schools +2.4/10.0
- Appreciation +0.0/10.0
$104,900
🖨 Deal sheet 📄 Offer letter ✓ Due diligence
Listing remarks MLS
PRICE REDUCTION!!! Brookhollow has plenty to offer in this 3 bedroom, 2 bath home!! Convenient location to schools and the interstate!! Home has nice family room with fireplace!! Back yard is fenced and ready for play!! Call your agent today for a showing!!
Key facts
- Sprawling 1-acre lot
- Cozy living room
- Attached carport
Tags
Property features AI
Exterior
- Parking: Attached carport with direct access (1 covered space); Paved parking
- Utilities: Public water; Public sewer; Cable available; Electricity available; Natural gas available
- Home design: Single-family house; One level; Living area per public records
- Construction: Vinyl and brick construction; Slab foundation; Asphalt shingle roof; Built per public records
- Exterior features: Front porch; Patio with slab; Private yard; Rain gutters; Partial chain-link fencing; Few trees; Level lot
Interior
- Kitchen: Electric cooktop; Oven; Refrigerator
- Bedrooms: Primary bedroom on main level (12x17); Bedroom on main level (11x15); Bedroom on main level (10x15)
- Flooring: Hardwood
- Bathrooms: 2 full bathrooms
- Heating & cooling: Central heating (natural gas); Central air conditioning
- Interior features: Entrance foyer; Natural woodwork; Has masonry wood-burning fireplace in the living room; 7 total rooms
- Laundry & utility: Main-level laundry room with washer hookup and electric dryer hookup (9x5)
Neighborhood map
What this means for you Summary
Snapshot
- This is a 3-bed/2.0-bath single-family listed at $105k.
Deal economics
- At list price, monthly cash flow is $243 ($3k/yr) — positive.
- The deal already cash-flows at list — no discount required.
- Meets the 1% rule at list price ($1k rent vs $105k).
- Recommended offer: $103k (1.5% below list) — sets the bar for market timing.
Location & tenants
- Location reads 68/100 on livability (#66 in MS) — a middle-class / working-renter tenant base. Strengths: commute A+, cost of living A+, housing A+; Watch: schools F, amenities F, employment F.
- Hinds County School District (rural): math 25% / reading 29% proficiency, ranked #70 of 130 in MS (top 54%) — low school quality limits family demand, transient renter base, plan for 1-2y turnover; 64% free/reduced lunch — lower-income household profile, screen leases tightly.
- Market conditions: Rents rising fast (+4.2%/yr); 302 active listings in the ZIP; 2 comparable units currently listed for rent nearby; 167 units permitted in Hinds County in 2024 (0 in 5+ unit buildings).
- This rent runs 30% of the median local income ($51k/yr) — at the standard rent-burdened threshold; future hikes will face affordability resistance.
Forward outlook
- Local home prices are declining (-3.0%/yr); year-one equity from $725 of loan paydown is wiped out by about $3k of value loss. Plan a longer hold.
- Hinds County population projected to shrink 6% by 2050 — rents likely to lag national; underwrite the cash flow, not the appreciation.
- At projected returns (-3.0% appreciation + 4.2% rent growth), your $29k cash investment doubles in ~10 years — after that, you're playing with house money.
Negotiation context
- It's been on market 20 days — a 2% lower offer ($103k) is reasonable based on typical stale-listing flexibility.
- 3 sale attempts since 14y ago with the ask held roughly flat each time — persistent listings suggest the price (not the market) is what's stuck; bring a comps-based counter.
Risks & watch-outs
- Climate carrying-cost: severe wind risk, 80% chance of damaging wind over 30y; moderate wildfire risk; extreme-heat days projected 7→20/yr by 2055 (HVAC capex compounding) — expect insurance premiums to compound above CPI over the hold.
Questions for the listing agent
- Built in 1978 — when were the roof, HVAC, electrical panel, plumbing, and water heater last replaced?
- Is there a deadline driving the sale (1031 exchange, divorce, estate, relocation)? That informs how much negotiation room exists.
- Schools are F-rated, which usually means shorter tenancies and higher turnover. Who's the typical renter profile here, and what's been the actual vacancy rate?
- What's the average days-on-market for RENTAL listings here right now (not sales)? A rising rental-DOM trend means longer vacancies and softer asking-rent achievability than the comps imply.
- What's the recent tenant-quality profile in this submarket — average credit score on applications, eviction rate, late-payment / NSF rate, and stable-employment percentage? A property-management company in the area should have these aggregated.
- How much new for-sale + rental construction is in the pipeline within 1–3 miles? Heavy new supply typically softens prices + rents 12–24 months out; constrained supply supports both.
Investment metrics
- 1% rule
- 1.21% ✓
- Cap rate
- 9.07%
- Cash-on-cash
- 9.93%
- DSCR
- 1.44
- GRM
- 6.9
CMA / ARV
- ARV (on-the-fly)
- $100,368
- Comps found
- 9
Show comp detail 9 sales within ~0.75 mi
| Address | Dist | Beds/Ba | Sqft | Sold | Price | $/sf | Match |
|---|---|---|---|---|---|---|---|
| 1540 Cedar Pine Dr | 0.14mi | 3/2.0 | 1,477 (+0%) | 10mo | $53,000 | $36 | 85 |
| 1143 Oak Glen Pl | 0.07mi | 3/2.0 | 1,421 (-4%) | 10mo | $70,000 | $49 | 82 |
| 1124 Oak Glen Pl | 0.04mi | 4/2.0 (+1) | 1,401 (-5%) | 11mo | $142,000 | $101 | 75 |
| 2128 Thousand Oaks Dr | 0.04mi | 3/2.0 | 1,370 (-7%) | 15mo | $93,500 | $68 | 74 |
| 5384 Brookhollow Dr | 0.16mi | 3/2.0 | 1,535 (+4%) | 17mo | $178,000 | $116 | 72 |
| 740 Gresham Cv | 0.40mi | 3/2.0 | 1,350 (-8%) | 6mo | $165,000 | $122 | 62 |
| 454 Hillandale Dr | 0.39mi | 3/2.0 | 1,532 (+4%) | 22mo | $179,900 | $117 | 57 |
| 5233 Brookhollow Dr | 0.63mi | 3/2.0 | 1,416 (-4%) | 22mo | $49,700 | $35 | 45 |
| 5250 Brookhollow Dr | 0.58mi | 3/2.0 | 1,653 (+12%) | 23mo | $110,000 | $67 | 34 |
Match score weights: distance 35% · size 25% · config 20% · recency 20%. Top-matched comps best support the ARV.
Projected returns pro-forma
-3.0% appreciation · 4.23% rent growth · sell at horizon
- IRR
- 0.1%
- Equity multiple
- 1.00×
- Total profit
- $118
- Equity at exit
- $15,641
- IRR
- 11.1%
- Equity multiple
- 1.92×
- Total profit
- $26,908
- Equity at exit
- $9,070
Cash invested: $29,372 (down + closing). Projections, not guarantees.
Landlord ↔ Tenant lean methodology
- Overall (STATE)
- 90 Strongly Landlord-Friendly
- State Mississippi
- 90 Strongly Landlord-Friendly · R+11
- County
- — inherits STATE
- City
- — inherits STATE
ZIP-level market 39212
- Home prices YoY
- -11.7%
- Rents YoY
- 4.2%
- Active inventory
- 302
- Price-to-rent
- 6.9×
Monthly cashflow live
- Estimated rent
- $1,271 medium interval (Pro) →
- Mortgage (P&I)
- −$550
- Tax from tax record
- −$168 /mo · $2,011/yr
- Insurance
- −$44
- HOA
- −$0
- Vacancy / Maint / Mgmt
- −$267
- Net cashflow
- $243
Break-even live
UW: 25.0% down · 7.5% · 30yr · 1.5% tax · 5.0% vac · 8.0% maint · 8.0% mgmt
Financing live
Cash to close
- Down payment
- $26,225
- Closing costs
- $3,147
- Reserves months
- —
- Total cash needed
- —
Loan-product check · same deal, 3 products live
Conventional
25% down · 7.5% · 30yr
- Down + closing
- —
- Monthly P&I
- —
- Monthly cashflow
- —
- DSCR
- —
- Eligible?
- —
Personal DTI + credit; lowest rate.
DSCR
20% down · 8.5% · 30yr
- Down + closing
- —
- Monthly P&I
- —
- Monthly cashflow
- —
- DSCR
- —
- Eligible?
- —
No personal income docs; deal must DSCR.
Hard money
10% down · 12.0% · 12mo
- Down + closing
- —
- Monthly P&I
- —
- Monthly cashflow
- —
- DSCR
- —
- Eligible?
- —
Short-term bridge; refi at stabilization.
Rent comps 2 comps
| Address | Beds | Baths | Sqft | Rent | $/sqft | DOM | Units | Dist |
|---|---|---|---|---|---|---|---|---|
| 2107 Thousand Oaks Dr Unit A Jackson, MS | 3.0 | 2.0 | 1182 | $950 | $0.80 | 21d | 1 | 0.21mi |
| 4954 Hanging Oak Dr Jackson, MS | 3.0 | 2.0 | 1082 | $1,215 | $1.12 | 43d | 1 | 1.28mi |
Listing history 15 events
-
2026-06-18days on market $104,900 Active 20 DOM
-
2026-06-17days on market $104,900 Active 19 DOM
-
2026-06-16days on market $104,900 Active 18 DOM
-
2026-06-15days on market $104,900 Active 17 DOM
-
2026-06-14days on market $104,900 Active 15 DOM
-
2026-06-10days on market $104,900 Active 12 DOM
-
2026-06-09days on market $104,900 Active 11 DOM
-
2026-06-08days on market $104,900 Active 10 DOM
-
2026-06-07days on market $104,900 Active 9 DOM
-
2026-06-03days on market $104,900 Active 5 DOM
-
2026-06-02days on market $104,900 Active 4 DOM
-
2026-06-01days on market $104,900 Active 3 DOM
-
2026-05-31days on market $104,900 Active 2 DOM
-
2026-05-30remarks 606-char remark
-
2026-05-30$104,900 Active 1 DOM
ⓘ Source: listings_history table (triggers on properties + properties_extension) + one-shot
backfill from property_details.listing_events for pre-trigger history.
Tax reassessment forecast MS · Resets to sale price
- Current annual tax
- $2,011 · $168/mo
- Projected year-2 tax
- $2,011 · $168/mo
- Expected delta
- $0/yr ($0/mo · 0.0%)
ⓘ Screening estimate from a state-policy table — verify with the county assessor before closing.
Climate risk First Street
- Flood 1/10 Low FEMA zone X (unshaded) · 0% chance over 30 yrs
- Wildfire 5/10 Major
- Heat 7/10 Severe 7 d/yr ≥108°F today · 20 d/yr by 30 yrs out
- Wind 8/10 Severe 80% chance of damaging wind over 30 yrs
- Air quality 1/10 Low 0 unhealthy d/yr today · 0 by 30 yrs out
Nearby sold comps map
Loading sold comps map…
Walkable amenities ~0.75 mi
Loading nearby amenities…
Taxation est. · year 1
- Rental income
- $15,258
- − Mortgage interest
- −$5,876
- − Property taxes
- −$2,011
- − Insurance
- −$524
- − Repairs & maintenance
- −$1,221
- − Management
- −$1,221
- − Depreciation
- −$3,052
- Taxable income
- $1,353
- Est. tax owed @ 24.0%
- −$325
- After-tax cash flow
- $2,592/yr
For passive investors: Depreciation is non-cash, so a rental often shows a tax loss while cash-flowing — sheltering income. Rental losses are passive: they offset passive income freely, and up to $25,000/yr can offset ordinary (W-2) income if you actively participate and your MAGI is under $100k (phasing out to $0 by $150k); unused losses carry forward. On sale, claimed depreciation is recaptured at up to 25%, and gains may owe capital-gains tax (a 1031 exchange can defer both). Figures are a year-1 estimate at your 24.0% rate — not tax advice; consult a CPA.
Schools (NCES district)
- District
- Hinds County School District
- NCES district ID
- 2801860
- Math proficiency
- 25% ▼ -16.00%
- Reading proficiency
- 29% ▼ -5.00%
- Median HH income
- $53,335
- Composite
- 24.02/100
- National rank
- #7771
- State rank
- #70 of 130 in MS
Livability — Jackson
- Score
- 68/100
- State rank
- #66
- US rank
- #9695
Category grades
Schools grade is shown separately in the Schools card above.
Census & demographics
- Census place
- Jackson, MS
- County
- Hinds County · 167,040 people
- City population
- 140,204
- Metro
- Jackson, MS
- Population (ZIP)
- 25,659
- Household income
- $50,722
- Rent vs Own
- Severe rent burden
- 1314.0
Population outlook (Hinds County) Hauer SSP2
- Today (2025)
- 242,528 people
- By 2030
- 241,113 · -0.6%
- By 2040
- 235,557 · -2.9%
- By 2050
- 226,946 · -6.4%
- By 2075
- 199,995 · -17.5%
- By 2100
- 164,165 · -32.3%
Race, ethnicity, and origin ACS 2023
- Neighborhood character
- Predominantly Black (86%)
- Race & ethnicity
- Black 86% White 9% Hispanic / Latino 3% Two or more races 3%
- Common ancestry
- Serbian 1% Lithuanian 1%
- Foreign-born
- 1% · Canada
- Languages at home
- 97% English-only · Spanish 2%
Political lean MEDSL · Hinds
- 2024 margin
- Solid D (+46.1) · D 72.4% · R 26.3% · Other 1.4%
- 2008→2024 swing
- +7.1pp toward D · 2008: 39.0pp · 2024: 46.1pp
- All cycles
- 2024: D+46.1 2020: D+48.3 2016: D+43.7 2012: D+45.1 2008: D+39.0
Not yet ingested
- Civics
- —
Market trends
- HPI YoY
- ▼ -23.01%
- Current HPI
- 174.4025
- Rent YoY
- ▲ 4.23%
- Metro
- Jackson, MS
- State GDP YoY
- —
- F500 in state
- 0
Price history
+427.1% since first listed12 events — show timeline
- 2026-05-29 Listed $104,900 MLSU
- 2021-10-08 Listing Removed — MLSU
- 2020-06-29 Sold (Public Records) — Public Records
- 2018-06-27 Sold (Public Records) — Public Records
- 2013-07-29 Listed $52,000 MLSU
- 2013-07-12 Sold (Public Records) — Public Records
- 2012-05-17 Sold (MLS) — MLSU
- 2012-04-12 Sold (Public Records) — Public Records
- 2012-01-13 Listed $19,900 MLSU
- 2006-05-04 Sold (Public Records) — Public Records
- 1997-02-23 Sold (Public Records) — Public Records
- 1989-08-17 Sold (Public Records) — Public Records
Property tax history
+1.4%/yrLatest (2025): $2,011 · +3.6% YoY. Source: county tax records.
Cash-flow waterfall
monthlySold comps — $/sqft
last 12 mo · ≤1 miLoading sold comps…