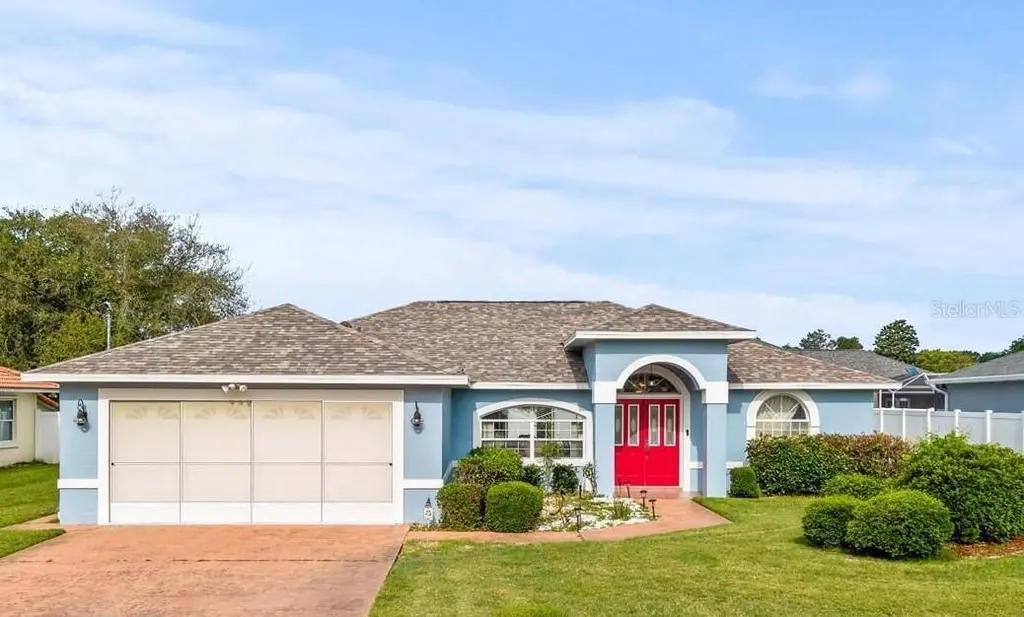
28 Fairhill Ln · Palm Coast, FL
Flood risk 1/10 · Minimal
- FEMA flood zone
- X (unshaded)
- Chance of flooding over 30 yrs
- 0.0%
- Est. flood insurance / yr
- $507 – $1,088
Fire risk 4/10 · Minor
- Est. fire insurance / yr
- $947 – $1,759
Heat risk 9/10 · Severe
- Hot days now (above 106°F)
- 7 days/yr
- Hot days in 30 yrs
- 21 days/yr
Wind risk 10/10 · Severe
- Chance of severe wind over 30 yrs
- 99.0%
Air-quality risk 2/10 · Minimal
- Unhealthy air days now
- 2 days/yr
- Unhealthy air days in 30 yrs
- 2 days/yr
Risk factors via First Street. Map © Google.
Why this score? — see what drove the D grade
The composite is a weighted blend of 9 inputs, each scored 0–100. Each bar is that input's sub-score; the figure is the points it added to the 100-point composite (weight × sub-score).
- Cash flow +12.7/30.0
- ARV discount +10.5/15.0
- Schools +4.6/10.0
- DSCR +3.8/10.0
- Livability +3.5/5.0
- Rent growth +2.7/5.0
- Condition / age +2.5/5.0
- 1% rule +2.3/10.0
- Appreciation +0.0/10.0
$309,000
🖨 Deal sheet (PDF) 📄 Offer letter ✓ Due diligence
Listing remarks
Welcome to this well-maintained 3-bedroom, 2-bath home with a 2-car garage, ideally located in the desirable Palm Coast area. This property offers a functional and inviting layout, featuring a formal dining room that overlooks the spacious living room—perfect for both everyday living and entertaining. The home boasts ceramic tile flooring throughout the main living areas, with comfortable carpeting in the bedrooms. Step outside to enjoy a large screened lanai at the rear of the home, providing a great space for relaxing or hosting gatherings year-round. Major updates include a new roof and fresh exterior paint completed in 2024, offering peace of mind and strong curb appeal. Additiona
Key facts
- 0.23 acre lot
- 2 garage spots
- Built 1996
Property features AI
Finance
- Other: Zoned SFR-3; No CDD; Furnished status negotiable
- HOA & community: Located in the Palm Harbor development
Exterior
- Parking: Attached 2-car garage
- Utilities: Public water; Public sewer; Electricity connected; Water connected; Sewer connected; Cable connected; Phone available; Sprinkler well
- Home design: Single family residence; One story; Home faces east; Homesteaded
- Construction: Block and stucco construction; Shingle roof; Slab foundation; Built on a 0.23-acre lot
- Exterior features: Covered, enclosed and screened patio/porch; Rain gutters; Sidewalk; Sliding doors; Irrigation equipment; Paved road access
Interior
- Kitchen: Dishwasher; Microwave; Refrigerator
- Bedrooms: 3 bedrooms
- Flooring: Carpet; Ceramic tile
- Bathrooms: 2 full bathrooms
- Heating & cooling: Central heating (electric); Central air conditioning
- Interior features: Ceiling fans; Eat-in kitchen; Open floorplan; Thermostat; Walk-in closets; Window treatments
- Laundry & utility: Washer; Dryer; Laundry with corridor access
Neighborhood map
What this means for you Summary
Snapshot
- This is a 3-bed/2.0-bath single-family listed at $309k.
Deal economics
- At list price, monthly cash flow is $-33 ($-399/yr) — negative.
- To cash-flow at today's rent, offer at most $303k (1.9% below list).
- To meet the 1% rule (rent ≥ 1% of price), the offer needs to be $224k (27.4% below list).
- Recommended offer: $224k (27.4% below list) — sets the bar for 1% rule.
- Cap rate 6.2% vs local median 3.8% in Palm Coast — top-decile yield for the area; either an underpriced asset or a hidden risk that comps aren't pricing in. Stress-test before assuming the spread holds.
Location & tenants
- Location reads 69/100 on livability (#478 in FL) — a middle-class / working-renter tenant base. Strengths: housing A+, health & safety A+, cost of living B+; Watch: amenities F, commute F.
- Flagler (rural): math 53% / reading 56% proficiency, ranked #20 of 73 in FL (top 27%) — acceptable for families but not a draw, mixed tenant base, ~2y average lease.
- Market conditions: Rents flat; 1600 active listings in the ZIP; 28 comparable units currently listed for rent nearby; rentals at typical pace (median 15d on market — plan ~3-4 weeks tenant-placement turnaround); solid renter incomes; 2,588 units permitted in Flagler County in 2024 (0 in 5+ unit buildings).
- This rent runs 32% of the median local income ($84k/yr) — at the standard rent-burdened threshold; future hikes will face affordability resistance.
Forward outlook
- Local home prices are declining (-3.0%/yr); year-one equity from $2k of loan paydown is wiped out by about $9k of value loss. Plan a longer hold.
- Flagler County population projected at +28% by 2050 — long-run rental-demand tailwind backs the buy-and-hold thesis.
Negotiation context
- It's been on market 38 days — a 3% lower offer ($300k) is reasonable based on typical stale-listing flexibility.
- 4 sale attempts since 2y ago with the ask held roughly flat each time — persistent listings suggest the price (not the market) is what's stuck; bring a comps-based counter.
Risks & watch-outs
- Climate carrying-cost: severe wind risk, 99% chance of damaging wind over 30y; extreme-heat days projected 7→21/yr by 2055 (HVAC capex compounding) — expect insurance premiums to compound above CPI over the hold.
Questions for the listing agent
- What do current leases actually rent for vs. the listed asking? Can we see a recent rent roll and the last 12 months of T-12 income?
- It's been on market 38 days. Have you received any prior offers? Is the seller open to a 27% concession, seller financing, or rate buy-down credit?
- Is there a deadline driving the sale (1031 exchange, divorce, estate, relocation)? That informs how much negotiation room exists.
- The area grade is low — what's the realistic commute time and amenity access for the typical tenant pool here? Any planned neighborhood developments (good or bad) we should know about?
- What's the average days-on-market for RENTAL listings here right now (not sales)? A rising rental-DOM trend means longer vacancies and softer asking-rent achievability than the comps imply.
- What's the recent tenant-quality profile in this submarket — average credit score on applications, eviction rate, late-payment / NSF rate, and stable-employment percentage? A property-management company in the area should have these aggregated.
- How much new for-sale + rental construction is in the pipeline within 1–3 miles? Heavy new supply typically softens prices + rents 12–24 months out; constrained supply supports both.
Investment metrics
- 1% rule
- 0.73% ✗
- Cap rate
- 6.16%
- Cash-on-cash
- -0.46%
- DSCR
- 0.98
- GRM
- 11.5
CMA / ARV
- ARV (on-the-fly)
- $331,344
- Comps found
- 12
Show comp detail 12 sales within ~0.75 mi
| Address | Dist | Beds/Ba | Sqft | Sold | Price | $/sf | Match |
|---|---|---|---|---|---|---|---|
| 17 Fairbank Ln | 0.16mi | 3/2.0 | 1,504 (-6%) | 1mo | $328,130 | $218 | 82 |
| 23 Fallon Ln | 0.32mi | 3/2.0 | 1,490 (-6%) | 0mo | $399,000 | $268 | 74 |
| 75 Freemont Turn | 0.47mi | 3/2.0 | 1,624 (+2%) | 2mo | $290,000 | $179 | 73 |
| 14 Frenora Ln | 0.56mi | 3/2.0 | 1,588 (-0%) | 3mo | $365,000 | $230 | 71 |
| 46 Frenora Ln | 0.47mi | 3/2.0 | 1,526 (-4%) | 3mo | $270,000 | $177 | 69 |
| 5 Freeland Ln | 0.50mi | 3/2.0 | 1,463 (-8%) | 2mo | $300,000 | $205 | 61 |
| 22 Farnum Ln | 0.68mi | 3/2.0 | 1,529 (-4%) | 2mo | $292,500 | $191 | 60 |
| 21 Frenora Ln | 0.51mi | 3/2.0 | 1,754 (+10%) | 1mo | $365,000 | $208 | 59 |
| 83 Fellowship Dr | 0.40mi | 3/3.0 | 1,810 (+14%) | 4mo | $440,000 | $243 | 52 |
| 8 Fellowship Dr | 0.48mi | 4/2.0 (+1) | 1,801 (+13%) | 4mo | $349,990 | $194 | 48 |
| 14 Fenwood Ln | 0.53mi | 4/2.0 (+1) | 1,801 (+13%) | 6mo | $357,000 | $198 | 44 |
| 14 Ferngate Ln | 0.73mi | 3/3.0 | 1,810 (+14%) | 1mo | $454,000 | $251 | 39 |
Match score weights: distance 35% · size 25% · config 20% · recency 20%. Top-matched comps best support the ARV.
Projected returns pro-forma
-3.0% appreciation · 0.85% rent growth · sell at horizon
- IRR
- -19.2%
- Equity multiple
- 0.34×
- Total profit
- $-57,111
- Equity at exit
- $46,073
- IRR
- -16.2%
- Equity multiple
- 0.17×
- Total profit
- $-71,821
- Equity at exit
- $26,717
Cash invested: $86,520 (down + closing). Projections, not guarantees.
Landlord ↔ Tenant lean methodology
- Overall (STATE)
- 87 Strongly Landlord-Friendly
- State Florida
- 87 Strongly Landlord-Friendly · R+3
- County
- — inherits STATE
- City
- — inherits STATE
ZIP-level market 32137
- Home prices YoY
- -34.5%
- Rents YoY
- 0.8%
- Active inventory
- 1600
- Price-to-rent
- 11.5×
Monthly cashflow live
- Estimated rent
- $2,244 high interval (Pro) →
- Mortgage (P&I)
- −$1,620
- Tax from tax record
- −$57 /mo · $681/yr
- Insurance
- −$129
- HOA
- −$0
- Vacancy / Maint / Mgmt
- −$471
- Net cashflow
- $-33
Break-even live
Sensitivity live
| Price | -10% $142 | -5% $54 | +0% $-33 | +5% $-121 | +10% $-208 |
|---|---|---|---|---|---|
| Rent | -10% $-211 | -5% $-122 | +0% $-33 | +5% $55 | +10% $144 |
| Rate | -1.0pp $122 | -0.5pp $45 | base $-33 | +0.5pp $-113 | +1.0pp $-195 |
UW: 25.0% down · 7.5% · 30yr · 1.5% tax · 5.0% vac · 8.0% maint · 8.0% mgmt
Financing live
Cash to close
- Down payment
- $77,250
- Closing costs
- $9,270
- Reserves months
- —
- Total cash needed
- —
Loan-product check · same deal, 3 products live
Conventional
25% down · 7.5% · 30yr
- Down + closing
- —
- Monthly P&I
- —
- Monthly cashflow
- —
- DSCR
- —
- Eligible?
- —
Personal DTI + credit; lowest rate.
DSCR
20% down · 8.5% · 30yr
- Down + closing
- —
- Monthly P&I
- —
- Monthly cashflow
- —
- DSCR
- —
- Eligible?
- —
No personal income docs; deal must DSCR.
Hard money
10% down · 12.0% · 12mo
- Down + closing
- —
- Monthly P&I
- —
- Monthly cashflow
- —
- DSCR
- —
- Eligible?
- —
Short-term bridge; refi at stabilization.
Rent comps 28 comps
| Address | Beds | Baths | Sqft | Rent | $/sqft | DOM | Units | Dist |
|---|---|---|---|---|---|---|---|---|
| 59 Fallen Oak Ln Unit 1261618P Palm Coast, FL | 3.0 | 3.0 | 1797 | $3,355 | $1.87 | 15d | 1 | 0.21mi |
| 90a Farmsworth Dr Palm Coast, FL | 2.0 | 2.0 | 1125 | $1,400 | $1.24 | 3d | 1 | 0.33mi |
| 42 Farmsworth Dr Unit A Palm Coast, FL | 3.0 | 2.0 | 1338 | $1,995 | $1.49 | 3d | 1 | 0.34mi |
| 21 Farnell Ln Unit B Palm Coast, FL | 3.0 | 2.0 | 1211 | $1,550 | $1.28 | 15d | 1 | 0.37mi |
| 30 Fenwick Ln Palm Coast, FL | 3.0 | 2.0 | 1352 | $1,800 | $1.33 | 15d | 1 | 0.40mi |
| 15 Columbia Ln Unit A Palm Coast, FL | 3.0 | 2.0 | 1260 | $1,650 | $1.31 | 24d | 1 | 0.48mi |
| 13 Freemont Ct Palm Coast, FL | 3.0 | 2.0 | 1637 | $2,300 | $1.41 | 3d | 1 | 0.53mi |
| 14 Colechester Ln Palm Coast, FL | 3.0 | 2.0 | 2033 | $3,000 | $1.48 | 24d | 1 | 0.57mi |
| 57 Columbia Ln Unit B Palm Coast, FL | 3.0 | 2.0 | 1200 | $1,700 | $1.42 | 3d | 1 | 0.58mi |
| 15 Crabtree Ct Unit B Palm Coast, FL | 3.0 | 2.0 | 1500 | $1,725 | $1.15 | 15d | 1 | 0.69mi |
| 1 Fanshawe Ln Palm Coast, FL | 3.0 | 2.5 | 2085 | $2,350 | $1.13 | 15d | 1 | 0.73mi |
| 1 Fanshawe Ln Unit 1B Palm Coast, FL | 3.0 | 2.5 | 2085 | $2,350 | $1.13 | 24d | 1 | 0.73mi |
| 87 Fieldstone Ln Unit A Palm Coast, FL | 2.0 | 2.0 | 1146 | $1,475 | $1.29 | 24d | 1 | 0.79mi |
| 9 Collinson Ct Palm Coast, FL | 3.0 | 2.0 | 1276 | $2,250 | $1.76 | 3d | 1 | 0.80mi |
| 11 Birchtree Way Palm Coast, FL | 3.0 | 2.0 | 1360 | $1,800 | $1.32 | 3d | 1 | 0.88mi |
| 214 Coral Reef Ct N Unit B Palm Coast, FL | 4.0 | 2.0 | 1300 | $1,850 | $1.42 | 3d | 1 | 1.05mi |
| 70 Forrester Pl Palm Coast, FL | 3.0 | 2.0 | 1700 | $2,000 | $1.18 | 3d | 1 | 1.07mi |
| 14 Cedarview Ct Palm Coast, FL | 3.0 | 2.0 | 1462 | $2,200 | $1.50 | 24d | 1 | 1.18mi |
| 31 Folson Ln Palm Coast, FL | 3.0 | 1.0 | 1481 | $1,639 | $1.11 | 24d | 1 | 1.22mi |
| 24 Barring Pl Palm Coast, FL | 3.0 | 2.0 | 1668 | $1,875 | $1.12 | 24d | 1 | 1.26mi |
| 34 Bunker Ln Palm Coast, FL | 4.0 | 2.0 | 1733 | $2,200 | $1.27 | 24d | 1 | 1.26mi |
| 10 Cormorant Ct Palm Coast, FL | 3.0 | 2.0 | 1902 | $2,800 | $1.47 | 11d | 1 | 1.26mi |
| 32 Bunker View Dr Unit A Palm Coast, FL | 2.0 | 2.0 | 1434 | $1,500 | $1.05 | 3d | 1 | 1.33mi |
| 12 Bunker View Pl Palm Coast, FL | 3.0 | 2.5 | 1600 | $1,725 | $1.08 | 3d | 1 | 1.35mi |
| 20 Clarendon Ct N Palm Coast, FL | 3.0 | 2.0 | 1883 | $2,675 | $1.42 | 3d | 1 | 1.37mi |
| 14 Bunker View Dr Unit 2 Palm Coast, FL | 3.0 | 2.0 | 1190 | $1,645 | $1.38 | 3d | 1 | 1.38mi |
| 44 Barrington Dr Palm Coast, FL | 4.0 | 2.0 | 1862 | $2,250 | $1.21 | 15d | 1 | 1.38mi |
| 70 Cochise Ct Palm Coast, FL | 3.0 | 2.0 | 1916 | $2,900 | $1.51 | 19d | 1 | 1.50mi |
Listing history 12 events
-
2026-06-01days on market $309,000 Active 38 DOM
-
2026-05-31days on market $309,000 Active 37 DOM
-
2026-05-08price $309,000
-
2026-04-30status Active
-
2026-04-28status Pending
-
2026-04-27status Active
-
2026-04-27price $310,000
-
2026-04-25status Pending
-
2026-04-20$309,900 Active
-
2025-07-08historical
-
2025-01-04price $334,900
-
2024-07-12$339,900 Active
ⓘ Source: listings_history table (triggers on properties + properties_extension) + one-shot
backfill from property_details.listing_events for pre-trigger history.
Tax reassessment forecast FL · Resets to sale price
- Current annual tax
- $681 · $57/mo
- Projected year-2 tax
- $2,565 · $214/mo
- Expected delta
- +$1,884/yr (+$157/mo · 276.9%)
ⓘ Screening estimate from a state-policy table — verify with the county assessor before closing.
Climate risk First Street
- Flood 1/10 Low FEMA zone X (unshaded) · 0% chance over 30 yrs
- Wildfire 4/10 Moderate
- Heat 9/10 Extreme 7 d/yr ≥106°F today · 21 d/yr by 30 yrs out
- Wind 10/10 Extreme 99% chance of damaging wind over 30 yrs
- Air quality 2/10 Low 2 unhealthy d/yr today · 2 by 30 yrs out
Nearby sold comps map
Loading sold comps map…
Walkable amenities ~0.75 mi
Loading nearby amenities…
Taxation est. · year 1
- Rental income
- $26,926
- − Mortgage interest
- −$17,309
- − Property taxes
- −$681
- − Insurance
- −$1,545
- − Repairs & maintenance
- −$2,154
- − Management
- −$2,154
- − Depreciation
- −$8,989
- Taxable loss
- −$5,906
- Est. tax savings @ 24.0%
- +$1,417
- After-tax cash flow
- $1,018/yr
For passive investors: Depreciation is non-cash, so a rental often shows a tax loss while cash-flowing — sheltering income. Rental losses are passive: they offset passive income freely, and up to $25,000/yr can offset ordinary (W-2) income if you actively participate and your MAGI is under $100k (phasing out to $0 by $150k); unused losses carry forward. On sale, claimed depreciation is recaptured at up to 25%, and gains may owe capital-gains tax (a 1031 exchange can defer both). Figures are a year-1 estimate at your 24.0% rate — not tax advice; consult a CPA.
Schools (NCES district)
- District
- Flagler
- NCES district ID
- 1200540
- Math proficiency
- 53% ▼ -9.00%
- Reading proficiency
- 56% ▼ -4.00%
- Median HH income
- $48,354
- Composite
- 46.35/100
- National rank
- #2464
- State rank
- #20 of 73 in FL
Livability — Palm Coast
- Score
- 69/100
- State rank
- #478
- US rank
- #8721
Category grades
Schools grade is shown separately in the Schools card above.
Census & demographics
- Census place
- Palm Coast, FL
- County
- Flagler County · 113,412 people
- City population
- 105,049
- Metro
- Deltona-Daytona Beach-Ormond Beach, FL
- Population (ZIP)
- 48,391
- Household income
- $83,923
- Rent vs Own
- Severe rent burden
- 816.0
Population outlook (Flagler County) Hauer SSP2
- Today (2025)
- 123,474 people
- By 2030
- 131,864 · +6.8%
- By 2040
- 146,176 · +18.4%
- By 2050
- 157,398 · +27.5%
- By 2075
- 177,990 · +44.2%
- By 2100
- 183,381 · +48.5%
Race, ethnicity, and origin ACS 2023
- Neighborhood character
- Predominantly White (77%)
- Race & ethnicity
- White 77% Hispanic / Latino 10% Two or more races 8% Black 6% Asian 3%
- Hispanic origin (detail)
- Puerto Rican 4% Cuban 1%
- Common ancestry
- Romanian 4% Russian 2% Lithuanian 2%
- Foreign-born
- 13% · Canada, Jamaica
- Languages at home
- 85% English-only · Spanish 7% Other Indo-European 3% Russian/Polish/Slavic 2%
Political lean MEDSL · Flagler
- 2024 margin
- Strong R (+28.2) · D 35.6% · R 63.8%
- 2008→2024 swing
- -29.8pp toward R · 2008: 1.6pp · 2024: -28.2pp
- All cycles
- 2024: R+28.2 2020: R+20.8 2016: R+20.6 2012: R+7.4 2008: D+1.6
Not yet ingested
- Civics
- —
Market trends
- HPI YoY
- ▼ -153.27%
- Current HPI
- 290.4607
- Rent YoY
- ▲ 0.85%
- Metro
- Deltona-Daytona Beach-Ormond Beach, FL
- State GDP YoY
- ▲ 3.28%
- F500 in state
- 36
Industry mix (Fortune 500 HQ in FL)
| Industry | F500 HQs | Revenue |
|---|---|---|
| Industrial Technology | 2 | $29B |
|
||
| Insurance | 2 | $17B |
|
||
| Retail | 1 | $60B |
|
||
| Technology Distribution | 1 | $58B |
|
||
| Homebuilding | 1 | $35B |
|
||
| Technology Manufacturing | 1 | $35B |
|
||
Price history
-9.1% since first listed10 events — show timeline
- 2026-05-08 Price Changed $309,000 Stellar MLS as Distributed by MLS Grid
- 2026-04-30 Relisted — Stellar MLS as Distributed by MLS Grid
- 2026-04-28 Pending — Stellar MLS as Distributed by MLS Grid
- 2026-04-27 Relisted — Stellar MLS as Distributed by MLS Grid
- 2026-04-27 Price Changed $310,000 Stellar MLS as Distributed by MLS Grid
- 2026-04-25 Pending — Stellar MLS as Distributed by MLS Grid
- 2026-04-20 Listed $309,900 Stellar MLS as Distributed by MLS Grid
- 2025-07-08 Listing Removed — Stellar MLS as Distributed by MLS Grid
- 2025-01-04 Price Changed $334,900 Stellar MLS as Distributed by MLS Grid
- 2024-07-12 Listed $339,900 Stellar MLS as Distributed by MLS Grid
Property tax history
+1.4%/yrLatest (2025): $681 · +4.6% YoY. Source: county tax records.
Cash-flow waterfall
monthlySold comps — $/sqft
last 12 mo · ≤1 miLoading sold comps…