101 Dumfries Dr #101 · Dumfries, VA
Flood risk 1/10 · Minimal
- FEMA flood zone
- X (unshaded)
- Chance of flooding over 30 yrs
- 0.0%
- Est. flood insurance / yr
- $507 – $1,088
Fire risk 3/10 · Minor
- Est. fire insurance / yr
- $666 – $1,236
Heat risk 8/10 · Major
- Hot days now (above 103°F)
- 7 days/yr
- Hot days in 30 yrs
- 16 days/yr
Wind risk 4/10 · Minor
- Chance of severe wind over 30 yrs
- 16.0%
Air-quality risk 2/10 · Minimal
- Unhealthy air days now
- 1 days/yr
- Unhealthy air days in 30 yrs
- 1 days/yr
Risk factors via First Street. Map © Google.
Why this score? — see what drove the B grade
The composite is a weighted blend of 9 inputs, each scored 0–100. Each bar is that input's sub-score; the figure is the points it added to the 100-point composite (weight × sub-score).
- Cash flow +30.0/30.0
- 1% rule +10.0/10.0
- DSCR +10.0/10.0
- ARV discount +7.5/15.0
- Schools +5.8/10.0
- Livability +4.2/5.0
- Rent growth +2.9/5.0
- Condition / age +2.2/5.0
- Appreciation +0.0/10.0
$120,000
🖨 Deal sheet (PDF) 📄 Offer letter ✓ Due diligence
Listing remarks MLS
Charming 4-bedroom, 2-bathroom manufactured home located in the desirable Grayson Village community. Build in 1981, this single Fleetwood makes an ideal choice for a comfortable living space . The home is located by peaceful atmosphere and convenient close to main routes, shopping centers and Malls.
Key facts
- 2 parking spots
- Built 1981
- Listed 66 days
Neighborhood map
What this means for you Summary
Snapshot
- This is a 4-bed/2.0-bath single-family listed at $120k. Condition is rated fair.
Deal economics
- At list price, monthly cash flow is $1k ($17k/yr) — positive.
- The deal already cash-flows at list — no discount required.
- Meets the 1% rule at list price ($3k rent vs $120k).
- Recommended offer: $113k (6.0% below list) — sets the bar for market timing.
- Cap rate 20.9% vs local median 3.5% in Dumfries — top-decile yield for the area; either an underpriced asset or a hidden risk that comps aren't pricing in. Stress-test before assuming the spread holds.
Location & tenants
- Location reads 84/100 on livability (#32 in VA, #789 nationally) — a professional / high-income tenant draw. Strengths: housing A+, health & safety A+, crime A.
- Prince William County Public School District (suburban): math 54% / reading 72% proficiency, ranked #30 of 131 in VA (top 23%) — acceptable for families but not a draw, mixed tenant base, ~2y average lease.
- Zoned schools: John F. Pattie Sr. Elementary (math 64% / reading 72%, grade B+, #366 of 1,108 statewide, top 33%, 924 students, 47% FRL); Potomac Middle (math 35% / reading 61%, grade C-, #247 of 342 statewide, top 74%, 919 students, 67% FRL); Potomac High (math 62% / reading 78%, grade B+, #151 of 319 statewide, top 49%, 2,065 students, 54% FRL) — zoned schools average 56% FRL vs 31% district-wide (25 pts higher); higher-poverty schools than district average — tighter screening recommended.
- Market conditions: Rents rising (+1.6%/yr); 155 active listings in the ZIP; 21 comparable units currently listed for rent nearby; rentals at typical pace (median 21d on market — plan ~3-4 weeks tenant-placement turnaround); high-income renter base; 1,418 units permitted in Prince William County in 2024 (625 in 5+ unit buildings).
Forward outlook
- Local home prices are declining (-3.0%/yr); year-one equity from $830 of loan paydown is wiped out by about $4k of value loss. Plan a longer hold.
- Prince William County population projected at +37% by 2050 — long-run rental-demand tailwind backs the buy-and-hold thesis.
- At projected returns (-3.0% appreciation + 1.6% rent growth), your $34k cash investment doubles in ~3 years — after that, you're playing with house money.
Negotiation context
- It's been on market 67 days — a 6% lower offer ($113k) is reasonable based on typical stale-listing flexibility.
Risks & watch-outs
- Climate carrying-cost: extreme-heat days projected 7→16/yr by 2055 (HVAC capex compounding) — expect insurance premiums to compound above CPI over the hold.
Questions for the listing agent
- It's been on market 67 days. Have you received any prior offers? Is the seller open to a 6% concession, seller financing, or rate buy-down credit?
- Have any recent inspections been done? Can we get a copy of the seller's disclosures and any deferred-maintenance estimates?
- Why hasn't it sold? Are there any deal-killer items the seller is aware of (foundation, flood, title, zoning, code violations)?
- Is there a deadline driving the sale (1031 exchange, divorce, estate, relocation)? That informs how much negotiation room exists.
- Schools are B-rated — typically a magnet for longer-tenancy family renters. What's the average tenant stay here, and is there a school-zone premium baked into asking?
- What's the average days-on-market for RENTAL listings here right now (not sales)? A rising rental-DOM trend means longer vacancies and softer asking-rent achievability than the comps imply.
- What's the recent tenant-quality profile in this submarket — average credit score on applications, eviction rate, late-payment / NSF rate, and stable-employment percentage? A property-management company in the area should have these aggregated.
- How much new for-sale + rental construction is in the pipeline within 1–3 miles? Heavy new supply typically softens prices + rents 12–24 months out; constrained supply supports both.
Investment metrics
- 1% rule
- 2.41% ✓
- Cap rate
- 20.86%
- Cash-on-cash
- 52.01%
- DSCR
- 3.31
- GRM
- 3.5
CMA / ARV
- ARV (median comp)
- $427,666
- List price
- $120,000
- Delta
- -71.94%
- Verdict
- UNDERPRICED
- Comps
- 20 within 1.0 mi
Show comp detail 5 sales within ~0.75 mi
| Address | Dist | Beds/Ba | Sqft | Sold | Price | $/sf | Match |
|---|---|---|---|---|---|---|---|
| 3565 Maple St | 0.23mi | 3/2.0 (-1) | 1,284 (-1%) | 12mo | $396,000 | $308 | 72 |
| 119 Kings Row Pl | 0.09mi | 3/2.0 (-1) | 1,320 (+2%) | 22mo | $120,000 | $91 | 70 |
| 4 Prince William Cir | 0.12mi | 3/2.0 (-1) | 1,200 (-8%) | 8mo | $120,000 | $100 | 70 |
| 17379 Tripoli Blvd | 0.18mi | 4/1.0 | 1,264 (-3%) | 22mo | $389,000 | $308 | 65 |
| 3746 Hedgeman St | 0.56mi | 3/3.0 (-1) | 1,324 (+2%) | 20mo | $385,000 | $291 | 45 |
Match score weights: distance 35% · size 25% · config 20% · recency 20%. Top-matched comps best support the ARV.
Projected returns pro-forma
-3.0% appreciation · 1.57% rent growth · sell at horizon
- IRR
- 48.3%
- Equity multiple
- 3.06×
- Total profit
- $69,253
- Equity at exit
- $17,892
- IRR
- 53.3%
- Equity multiple
- 5.87×
- Total profit
- $163,559
- Equity at exit
- $10,375
Cash invested: $33,600 (down + closing). Projections, not guarantees.
Landlord ↔ Tenant lean methodology
- Overall (STATE)
- 55 Moderately Landlord-Leaning
- State Virginia
- 55 Moderately Landlord-Leaning · D+2
- County
- — inherits STATE
- City
- — inherits STATE
ZIP-level market 22026
- Home prices YoY
- -9.4%
- Rents YoY
- 1.6%
- Active inventory
- 155
- Price-to-rent
- 3.5×
Monthly cashflow live
- Estimated rent
- $2,893 high interval (Pro) →
- Mortgage (P&I)
- −$629
- Tax est. 1.5%
- −$150 /mo · $1,800/yr
- Insurance
- −$50
- HOA
- −$0
- Vacancy / Maint / Mgmt
- −$608
- Net cashflow
- $1,456
Break-even live
Sensitivity live
| Price | -10% $1,539 | -5% $1,498 | +0% $1,456 | +5% $1,415 | +10% $1,373 |
|---|---|---|---|---|---|
| Rent | -10% $1,228 | -5% $1,342 | +0% $1,456 | +5% $1,571 | +10% $1,685 |
| Rate | -1.0pp $1,517 | -0.5pp $1,487 | base $1,456 | +0.5pp $1,425 | +1.0pp $1,394 |
UW: 25.0% down · 7.5% · 30yr · 1.5% tax · 5.0% vac · 8.0% maint · 8.0% mgmt
Financing live
Cash to close
- Down payment
- $30,000
- Closing costs
- $3,600
- Reserves months
- —
- Total cash needed
- —
Loan-product check · same deal, 3 products live
Conventional
25% down · 7.5% · 30yr
- Down + closing
- —
- Monthly P&I
- —
- Monthly cashflow
- —
- DSCR
- —
- Eligible?
- —
Personal DTI + credit; lowest rate.
DSCR
20% down · 8.5% · 30yr
- Down + closing
- —
- Monthly P&I
- —
- Monthly cashflow
- —
- DSCR
- —
- Eligible?
- —
No personal income docs; deal must DSCR.
Hard money
10% down · 12.0% · 12mo
- Down + closing
- —
- Monthly P&I
- —
- Monthly cashflow
- —
- DSCR
- —
- Eligible?
- —
Short-term bridge; refi at stabilization.
Rent comps 21 comps
| Address | Beds | Baths | Sqft | Rent | $/sqft | DOM | Units | Dist |
|---|---|---|---|---|---|---|---|---|
| 17360 Tripoli Blvd Dumfries, VA | 3.0 | 1.0 | 1052 | $2,790 | $2.65 | 45d | 1 | 0.12mi |
| 3511 Briarwood Dr Dumfries, VA | 1.0–3.0 | 1.0–2.0 | 882 | $2,185 | $2.48 | 7d | 8 | 0.28mi |
| 3421 Belleplain Ct Dumfries, VA | 3.0 | 3.5 | 1628 | $2,500 | $1.54 | 45d | 1 | 0.79mi |
| 16889 Toms River Loop Dumfries, VA | 3.0 | 3.5 | 1662 | $3,300 | $1.99 | 17d | 1 | 0.91mi |
| 3629 McDowell Ct Dumfries, VA | 3.0 | 1.5 | 1280 | $1,950 | $1.52 | 45d | 1 | 0.95mi |
| 2325 McClellan Ct Dumfries, VA | 3.0 | 2.5 | 1340 | $2,207 | $1.65 | 26d | 1 | 1.04mi |
| 1810 Fort Pulaski Ct Dumfries, VA | 3.0 | 2.5 | 1320 | $2,500 | $1.89 | 14d | 1 | 1.05mi |
| 2424 Kilpatrick Pl Unit 1 Dumfries, VA | 3.0 | 2.5 | 1320 | $2,100 | $1.59 | 17d | 1 | 1.09mi |
| 2424 Kilpatrick Pl Unit 1 Dumfries, VA | 3.0 | 2.5 | 1320 | $2,100 | $1.59 | 45d | 1 | 1.09mi |
| 17357 Sligo Loop Dumfries, VA | 3.0 | 2.5 | 1776 | $2,900 | $1.63 | 45d | 1 | 1.10mi |
| 2902 Buell Ct Dumfries, VA | 3.0 | 2.5 | 1300 | $2,400 | $1.85 | 7d | 1 | 1.12mi |
| 17045 Gibson Mill Rd Dumfries, VA | 3.0 | 3.5 | 1170 | $3,000 | $2.56 | 45d | 1 | 1.14mi |
| 2819 Banks Ct Dumfries, VA | 3.0 | 2.5 | 1300 | $2,495 | $1.92 | 0d | 1 | 1.18mi |
| 3600 Jurgensen Dr Triangle, VA | 1.0–3.0 | 1.0 | 800 | $1,754 | $2.19 | 0d | 1 | 1.33mi |
| 3600 Jurgensen Dr Triangle, VA | 3.0 | 1.0 | 900 | $1,903 | $2.11 | 45d | 1 | 1.33mi |
| 16766 Blackjack Oak Ln Woodbridge, VA | 3.0 | 3.5 | 1794 | $3,295 | $1.84 | 22d | 1 | 1.36mi |
| 2940 Shumard Oak Dr Woodbridge, VA | 1.0–3.0 | 1.0–2.0 | 1012 | $2,744 | $2.71 | 45d | 17 | 1.37mi |
| 2940 Shumard Oak Dr Woodbridge, VA | 1.0–3.0 | 1.0–2.0 | 1012 | $2,905 | $2.87 | 0d | 22 | 1.37mi |
| 2819 Chinkapin Oak Ln Woodbridge, VA | 3.0 | 2.5 | 1571 | $2,800 | $1.78 | 5d | 1 | 1.40mi |
| 2930 Wetherburn Ct Woodbridge, VA | 4.0 | 2.5 | 1386 | $2,700 | $1.95 | 13d | 1 | 1.50mi |
| 2925 Wythe Ct Woodbridge, VA | 4.0 | 2.5 | 1711 | $3,300 | $1.93 | 20d | 1 | 1.50mi |
Listing history 16 events
-
2026-06-21days on market $120,000 Active 67 DOM
-
2026-06-18days on market $120,000 Active 64 DOM
-
2026-06-17days on market $120,000 Active 63 DOM
-
2026-06-16days on market $120,000 Active 62 DOM
-
2026-06-15days on market $120,000 Active 61 DOM
-
2026-06-13days on market $120,000 Active 59 DOM
-
2026-06-09days on market $120,000 Active 55 DOM
-
2026-06-08days on market $120,000 Active 54 DOM
-
2026-06-07days on market $120,000 Active 53 DOM
-
2026-06-04days on market $120,000 Active 50 DOM
-
2026-06-03days on market $120,000 Active 49 DOM
-
2026-06-02days on market $120,000 Active 48 DOM
-
2026-06-01days on market $120,000 Active 47 DOM
-
2026-05-31days on market $120,000 Active 46 DOM
-
2026-04-16$120,000 Active 301-char remark
Show marketing remark (301 chars)
Charming 4-bedroom, 2-bathroom manufactured home located in the desirable Grayson Village community. Build in 1981, this single Fleetwood makes an ideal choice for a comfortable living space . The home is located by peaceful atmosphere and convenient close to main routes, shopping centers and Malls.
-
2026-03-11historical $120,000 301-char remark
Show marketing remark (301 chars)
Charming 4-bedroom, 2-bathroom manufactured home located in the desirable Grayson Village community. Build in 1981, this single Fleetwood makes an ideal choice for a comfortable living space . The home is located by peaceful atmosphere and convenient close to main routes, shopping centers and Malls.
ⓘ Source: listings_history table (triggers on properties + properties_extension) + one-shot
backfill from property_details.listing_events for pre-trigger history.
Climate risk First Street
- Flood 1/10 Low FEMA zone X (unshaded) · 0% chance over 30 yrs
- Wildfire 3/10 Moderate
- Heat 8/10 Severe 7 d/yr ≥103°F today · 16 d/yr by 30 yrs out
- Wind 4/10 Moderate 16% chance of damaging wind over 30 yrs
- Air quality 2/10 Low 1 unhealthy d/yr today · 1 by 30 yrs out
Nearby sold comps map
Loading sold comps map…
Walkable amenities ~0.75 mi
Loading nearby amenities…
Taxation est. · year 1
- Rental income
- $34,719
- − Mortgage interest
- −$6,722
- − Property taxes
- −$1,800
- − Insurance
- −$600
- − Repairs & maintenance
- −$2,778
- − Management
- −$2,778
- − Depreciation
- −$3,491
- Taxable income
- $16,552
- Est. tax owed @ 24.0%
- −$3,972
- After-tax cash flow
- $13,504/yr
For passive investors: Depreciation is non-cash, so a rental often shows a tax loss while cash-flowing — sheltering income. Rental losses are passive: they offset passive income freely, and up to $25,000/yr can offset ordinary (W-2) income if you actively participate and your MAGI is under $100k (phasing out to $0 by $150k); unused losses carry forward. On sale, claimed depreciation is recaptured at up to 25%, and gains may owe capital-gains tax (a 1031 exchange can defer both). Figures are a year-1 estimate at your 24.0% rate — not tax advice; consult a CPA.
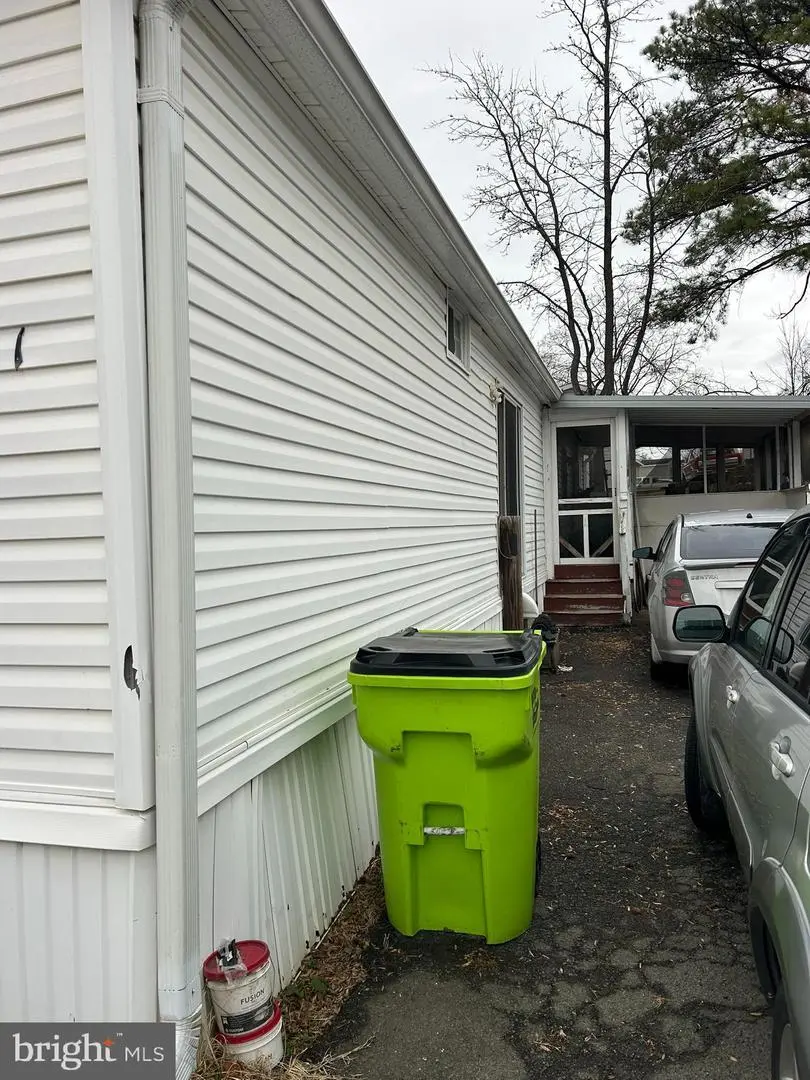
Condition & rehab AI · 12 photos
This 1981 manufactured home requires moderate repairs to its exterior and siding, but is otherwise in fair condition. A fresh coat of paint and some interior organization would significantly boost its value.
Repairs flagged
- Major siding — Significant wear and tear
- Major exterior paint — Visible peeling and wear
Value-add opportunities
- Both Paint exterior — Enhances curb appeal and value
- Both Organize kitchen — Improves functionality and aesthetics
Renovation cost estimate screening
| Repair item | Severity | Est. cost |
|---|---|---|
| siding · Significant wear and tear | Major | $15,000–50,000 |
| exterior paint · Visible peeling and wear | Major | $15,000–50,000 |
| Total estimated repair cost · 2 items | $30,000–100,000 |
Value-add ROI direction
- Both Paint exterior — Enhances curb appeal and value ↑
- Both Organize kitchen — Improves functionality and aesthetics ↑
ⓘ Cost ranges are severity-bucket heuristics (US national rule-of-thumb). Get contractor quotes + a written scope before underwriting a rehab budget.
Schools (NCES district)
- District
- Prince William County Public School District
- NCES district ID
- 5103130
- Math proficiency
- 54% ▼ -28.00%
- Reading proficiency
- 72% ▼ -7.00%
- Median HH income
- $96,347
- Composite
- 57.92/100
- National rank
- #1041
- State rank
- #30 of 131 in VA
Livability — Dumfries
- Score
- 84/100
- State rank
- #32
- US rank
- #789
Category grades
Schools grade is shown separately in the Schools card above.
Census & demographics
- Census place
- Dumfries, VA
- County
- Prince William County · 452,627 people
- City population
- 42,253
- Metro
- Washington-Arlington-Alexandria, DC-VA-MD-WV
- Population (ZIP)
- 22,897
- Household income
- $124,318
- Rent vs Own
- Severe rent burden
- 571.0
Population outlook (Prince William County) Hauer SSP2
- Today (2025)
- 539,759 people
- By 2030
- 582,629 · +7.9%
- By 2040
- 665,916 · +23.4%
- By 2050
- 740,796 · +37.2%
- By 2075
- 900,980 · +66.9%
- By 2100
- 985,833 · +82.6%
Race, ethnicity, and origin ACS 2023
- Neighborhood character
- Highly diverse neighborhood (Simpson 0.72)
- Race & ethnicity
- Black 42% White 24% Hispanic / Latino 18% Two or more races 10% Asian 10% Native American 1%
- Hispanic origin (detail)
- Mexican 3% Puerto Rican 2% Dominican 1%
- Common ancestry
- Romanian 1% Serbian 1%
- Foreign-born
- 23% · Canada, South Korea
- Languages at home
- 67% English-only · Spanish 14% Other Indo-European 6% Tagalog/Filipino 1%
Political lean MEDSL · Prince William
- 2024 margin
- D (+18.0) · D 57.6% · R 39.6% · Other 2.8%
- 2008→2024 swing
- +2.1pp toward D · 2008: 15.9pp · 2024: 18.0pp
- All cycles
- 2024: D+18.0 2020: D+27.0 2016: D+20.0 2012: D+16.0 2008: D+15.9
Not yet ingested
- Civics
- —
Market trends
- HPI YoY
- ▼ -30.02%
- Current HPI
- 289.8992
- Rent YoY
- ▲ 1.57%
- Metro
- Washington-Arlington-Alexandria, DC-VA-MD-WV
- State GDP YoY
- ▲ 2.40%
- F500 in state
- 50
Industry mix (Fortune 500 HQ in VA)
| Industry | F500 HQs | Revenue |
|---|---|---|
| Aerospace / Defense | 4 | $236B |
|
||
| Technology / Defense | 3 | $32B |
|
||
| Financial Services | 2 | $176B |
|
||
| Utilities | 2 | $27B |
|
||
| Insurance | 2 | $25B |
|
||
| Technology | 2 | $15B |
|
||
Price history
+0.0% since first listed2 events — show timeline
- 2026-04-16 Listed $120,000 BRIGHT MLS
- 2026-03-11 Coming Soon $120,000 BRIGHT MLS
Cash-flow waterfall
monthlySold comps — $/sqft
last 12 mo · ≤1 miLoading sold comps…