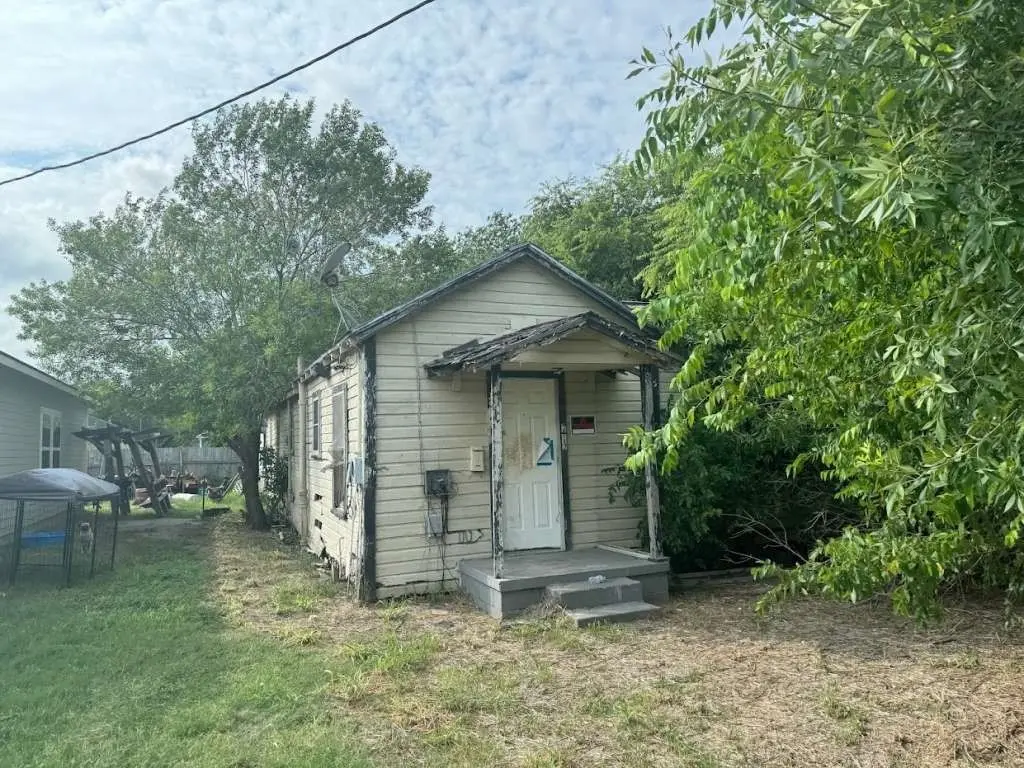
712 Park St · Sinton, TX
Flood risk 2/10 · Minimal
- FEMA flood zone
- X (unshaded)
- Chance of flooding over 30 yrs
- 0.07%
- Est. flood insurance / yr
- $507 – $1,088
Fire risk 4/10 · Minor
- Est. fire insurance / yr
- $1,222 – $2,270
Heat risk 9/10 · Severe
- Hot days now (above 109°F)
- 7 days/yr
- Hot days in 30 yrs
- 24 days/yr
Wind risk 9/10 · Severe
- Chance of severe wind over 30 yrs
- 99.0%
Air-quality risk 1/10 · Minimal
- Unhealthy air days now
- 0 days/yr
- Unhealthy air days in 30 yrs
- 0 days/yr
Risk factors via First Street. Map © Google.
Why this score? — see what drove the D grade
The composite is a weighted blend of 9 inputs, each scored 0–100. Each bar is that input's sub-score; the figure is the points it added to the 100-point composite (weight × sub-score).
- Cash flow +15.0/30.0
- ARV discount +7.5/15.0
- 1% rule +5.0/10.0
- DSCR +5.0/10.0
- Livability +3.2/5.0
- Schools +2.6/10.0
- Rent growth +2.5/5.0
- Condition / age +2.5/5.0
- Appreciation +0.0/10.0
$26,999
🖨 Deal sheet (PDF) 📄 Offer letter ✓ Due diligence
Listing remarks MLS
FIXER UPPER! Nestled in the heart of Sinton, TX, the property at 712 Park Ave offers a serene and welcoming environment, perfect for those looking to enjoy the benefits of small-town living. Just moments away, residents can find local schools that pride themselves on community spirit and academic excellence. The home on-site is approximately 764 Sq. Ft. with two bedrooms and one bathroom. This is an investment space that needs renovations or complete rebuilding. There is also a storage shed you can use for additional storage. We also have some OTHER FIXER UPPER homes for sale in the Sinton area. When you call ask about a PACKAGE DEAL for our Stinson properties. WE MAKE IT EASY TO OWN. This is a great opportunity! Don't wait, call us today to get more information on the owner's easy terms and smooth process that may be able to put the deed in your name and make this your dream property.
Key facts
- Storage shed
- Local schools
- Investment space
Tags
Neighborhood map
What this means for you Summary
Snapshot
- This is a 2-bed/1.0-bath single-family listed at $27k.
Deal economics
- At list price, monthly cash flow is $962 ($12k/yr) — positive.
- The deal already cash-flows at list — no discount required.
- Meets the 1% rule at list price ($1k rent vs $27k).
- Recommended offer: $24k (12.0% below list) — sets the bar for market timing.
- Cap rate 49.0% vs local median 3.8% in Sinton — top-decile yield for the area; either an underpriced asset or a hidden risk that comps aren't pricing in. Stress-test before assuming the spread holds.
Location & tenants
- Location reads 65/100 on livability (#667 in TX) — a middle-class / working-renter tenant base. Strengths: cost of living A+, health & safety A+, housing A-; Watch: schools F, amenities F, commute F.
- Sinton ISD (town): math 27% / reading 35% proficiency, ranked #601 of 826 in TX (top 73%) — families likely to look elsewhere, expect single-tenant / working-renter base with shorter leases; 67% free/reduced lunch — lower-income household profile, screen leases tightly.
- Market conditions: 160 active listings in the ZIP; 3 comparable units currently listed for rent nearby; rentals at typical pace (median 22d on market — plan ~3-4 weeks tenant-placement turnaround); 344 units permitted in San Patricio County in 2024 (0 in 5+ unit buildings).
Forward outlook
- Local home prices are declining (-3.0%/yr); year-one equity from $186 of loan paydown is wiped out by about $810 of value loss. Plan a longer hold.
- San Patricio County population projected at +27% by 2050 — long-run rental-demand tailwind backs the buy-and-hold thesis.
- At projected returns (-3.0% appreciation + 3.0% rent growth), your $8k cash investment doubles in ~1 year — after that, you're playing with house money.
Negotiation context
- It's been on market 178 days — a 12% lower offer ($24k) is reasonable based on typical stale-listing flexibility.
- 2 sale attempts since 22y ago with the ask held roughly flat each time — persistent listings suggest the price (not the market) is what's stuck; bring a comps-based counter.
Risks & watch-outs
- Watch-outs: built in 1957 — expect roof / HVAC / electrical / plumbing capex.
- Climate carrying-cost: severe wind risk, 99% chance of damaging wind over 30y; extreme-heat days projected 7→24/yr by 2055 (HVAC capex compounding) — expect insurance premiums to compound above CPI over the hold.
Questions for the listing agent
- It's been on market 178 days. Have you received any prior offers? Is the seller open to a 12% concession, seller financing, or rate buy-down credit?
- Built in 1957 — when were the roof, HVAC, electrical panel, plumbing, and water heater last replaced?
- Why hasn't it sold? Are there any deal-killer items the seller is aware of (foundation, flood, title, zoning, code violations)?
- Is there a deadline driving the sale (1031 exchange, divorce, estate, relocation)? That informs how much negotiation room exists.
- Schools are F-rated, which usually means shorter tenancies and higher turnover. Who's the typical renter profile here, and what's been the actual vacancy rate?
- The area grade is low — what's the realistic commute time and amenity access for the typical tenant pool here? Any planned neighborhood developments (good or bad) we should know about?
- What's the average days-on-market for RENTAL listings here right now (not sales)? A rising rental-DOM trend means longer vacancies and softer asking-rent achievability than the comps imply.
- What's the recent tenant-quality profile in this submarket — average credit score on applications, eviction rate, late-payment / NSF rate, and stable-employment percentage? A property-management company in the area should have these aggregated.
- How much new for-sale + rental construction is in the pipeline within 1–3 miles? Heavy new supply typically softens prices + rents 12–24 months out; constrained supply supports both.
Investment metrics
- 1% rule
- 5.34% ✓
- Cap rate
- 49.03%
- Cash-on-cash
- 152.64%
- DSCR
- 7.79
- GRM
- 1.6
CMA / ARV
- ARV (median comp)
- $118,753
- List price
- $26,999
- Delta
- -77.26%
- Verdict
- UNDERPRICED
- Comps
- 20 within 1.0 mi
Show comp detail 3 sales within ~0.75 mi
| Address | Dist | Beds/Ba | Sqft | Sold | Price | $/sf | Match |
|---|---|---|---|---|---|---|---|
| 744 Sodville St | 0.21mi | 2/1.0 | 780 (+2%) | 5mo | $55,000 | $71 | 83 |
| 512 Avenue B | 0.14mi | 2/1.0 | 672 (-12%) | 5mo | $55,000 | $82 | 69 |
| 812 E 4th St | 0.36mi | 2/1.0 | 868 (+14%) | 6mo | $22,000 | $25 | 55 |
Match score weights: distance 35% · size 25% · config 20% · recency 20%. Top-matched comps best support the ARV.
Projected returns pro-forma
-3.0% appreciation · 3.0% rent growth · sell at horizon
- IRR
- —
- Equity multiple
- 8.52×
- Total profit
- $56,884
- Equity at exit
- $4,026
- IRR
- —
- Equity multiple
- 17.99×
- Total profit
- $128,459
- Equity at exit
- $2,334
Cash invested: $7,560 (down + closing). Projections, not guarantees.
Landlord ↔ Tenant lean methodology
- Overall (STATE)
- 87 Strongly Landlord-Friendly
- State Texas
- 87 Strongly Landlord-Friendly · R+5
- County
- — inherits STATE
- City
- — inherits STATE
ZIP-level market 78387
- Active inventory
- 160
- Price-to-rent
- 1.6×
Monthly cashflow live
- Estimated rent
- $1,442 medium interval (Pro) →
- Mortgage (P&I)
- −$142
- Tax from tax record
- −$25 /mo · $295/yr
- Insurance
- −$11
- HOA
- −$0
- Vacancy / Maint / Mgmt
- −$303
- Net cashflow
- $962
Break-even live
Sensitivity live
| Price | -10% $977 | -5% $969 | +0% $962 | +5% $954 | +10% $946 |
|---|---|---|---|---|---|
| Rent | -10% $848 | -5% $905 | +0% $962 | +5% $1,019 | +10% $1,075 |
| Rate | -1.0pp $975 | -0.5pp $968 | base $962 | +0.5pp $955 | +1.0pp $947 |
UW: 25.0% down · 7.5% · 30yr · 1.5% tax · 5.0% vac · 8.0% maint · 8.0% mgmt
Financing live
Cash to close
- Down payment
- $6,750
- Closing costs
- $810
- Reserves months
- —
- Total cash needed
- —
Loan-product check · same deal, 3 products live
Conventional
25% down · 7.5% · 30yr
- Down + closing
- —
- Monthly P&I
- —
- Monthly cashflow
- —
- DSCR
- —
- Eligible?
- —
Personal DTI + credit; lowest rate.
DSCR
20% down · 8.5% · 30yr
- Down + closing
- —
- Monthly P&I
- —
- Monthly cashflow
- —
- DSCR
- —
- Eligible?
- —
No personal income docs; deal must DSCR.
Hard money
10% down · 12.0% · 12mo
- Down + closing
- —
- Monthly P&I
- —
- Monthly cashflow
- —
- DSCR
- —
- Eligible?
- —
Short-term bridge; refi at stabilization.
Rent comps 3 comps
| Address | Beds | Baths | Sqft | Rent | $/sqft | DOM | Units | Dist |
|---|---|---|---|---|---|---|---|---|
| 804 Avenue B St Unit B Sinton, TX | 3.0 | 2.0 | 1092 | $1,750 | $1.60 | 22d | 1 | 0.09mi |
| 924 Flores St Sinton, TX | 1.0 | 1.0 | 700 | $864 | $1.23 | 44d | 1 | 0.29mi |
| 1201 E Sinton St Sinton, TX | 1.0 | 1.0 | 608 | $1,020 | $1.68 | 14d | 1 | 1.04mi |
Listing history 19 events
-
2026-06-21days on market $26,999 Active 178 DOM
-
2026-06-18days on market $26,999 Active 176 DOM
-
2026-06-17days on market $26,999 Active 175 DOM
-
2026-06-16days on market $26,999 Active 174 DOM
-
2026-06-15days on market $26,999 Active 173 DOM
-
2026-06-15days on market $26,999 Active 172 DOM
-
2026-06-13days on market $26,999 Active 171 DOM
-
2026-06-12days on market $26,999 Active 170 DOM
-
2026-06-09days on market $26,999 Active 167 DOM
-
2026-06-08days on market $26,999 Active 166 DOM
-
2026-06-08days on market $26,999 Active 165 DOM
-
2026-06-05days on market $26,999 Active 163 DOM
-
2026-06-03days on market $26,999 Active 161 DOM
-
2026-06-02days on market $26,999 Active 160 DOM
-
2026-06-01days on market $26,999 Active 159 DOM
-
2026-05-31days on market $26,999 Active 158 DOM
-
2025-12-24$26,999 Active 898-char remark
Show marketing remark (898 chars)
FIXER UPPER! Nestled in the heart of Sinton, TX, the property at 712 Park Ave offers a serene and welcoming environment, perfect for those looking to enjoy the benefits of small-town living. Just moments away, residents can find local schools that pride themselves on community spirit and academic excellence. The home on-site is approximately 764 Sq. Ft. with two bedrooms and one bathroom. This is an investment space that needs renovations or complete rebuilding. There is also a storage shed you can use for additional storage. We also have some OTHER FIXER UPPER homes for sale in the Sinton area. When you call ask about a PACKAGE DEAL for our Stinson properties. WE MAKE IT EASY TO OWN. This is a great opportunity! Don't wait, call us today to get more information on the owner's easy terms and smooth process that may be able to put the deed in your name and make this your dream property.
-
2004-12-08soldstatus 37-char remark
Show marketing remark (37 chars)
Investors special!!!! Bring offers!!
-
2004-03-12$15,000 37-char remark
Show marketing remark (37 chars)
Investors special!!!! Bring offers!!
ⓘ Source: listings_history table (triggers on properties + properties_extension) + one-shot
backfill from property_details.listing_events for pre-trigger history.
Tax reassessment forecast TX · Resets to sale price
- Current annual tax
- $295 · $25/mo
- Projected year-2 tax
- $494 · $41/mo
- Expected delta
- +$199/yr (+$17/mo · 67.7%)
ⓘ Screening estimate from a state-policy table — verify with the county assessor before closing.
Climate risk First Street
- Flood 2/10 Low FEMA zone X (unshaded) · 7% chance over 30 yrs
- Wildfire 4/10 Moderate
- Heat 9/10 Extreme 7 d/yr ≥109°F today · 24 d/yr by 30 yrs out
- Wind 9/10 Extreme 99% chance of damaging wind over 30 yrs
- Air quality 1/10 Low 0 unhealthy d/yr today · 0 by 30 yrs out
Nearby sold comps map
Loading sold comps map…
Walkable amenities ~0.75 mi
Loading nearby amenities…
Taxation est. · year 1
- Rental income
- $17,301
- − Mortgage interest
- −$1,512
- − Property taxes
- −$295
- − Insurance
- −$135
- − Repairs & maintenance
- −$1,384
- − Management
- −$1,384
- − Depreciation
- −$785
- Taxable income
- $11,805
- Est. tax owed @ 24.0%
- −$2,833
- After-tax cash flow
- $8,706/yr
For passive investors: Depreciation is non-cash, so a rental often shows a tax loss while cash-flowing — sheltering income. Rental losses are passive: they offset passive income freely, and up to $25,000/yr can offset ordinary (W-2) income if you actively participate and your MAGI is under $100k (phasing out to $0 by $150k); unused losses carry forward. On sale, claimed depreciation is recaptured at up to 25%, and gains may owe capital-gains tax (a 1031 exchange can defer both). Figures are a year-1 estimate at your 24.0% rate — not tax advice; consult a CPA.
Schools (NCES district)
- District
- Sinton ISD
- NCES district ID
- 4840350
- Math proficiency
- 27% ▼ -19.00%
- Reading proficiency
- 35% ▼ -3.00%
- Median HH income
- $44,618
- Composite
- 26.49/100
- National rank
- #7208
- State rank
- #601 of 826 in TX
Livability — Sinton
- Score
- 65/100
- State rank
- #667
- US rank
- #12510
Category grades
Schools grade is shown separately in the Schools card above.
Census & demographics
- Census place
- Sinton, TX
- Population (ZIP)
- 9,604
Population outlook (San Patricio County) Hauer SSP2
- Today (2025)
- 75,538 people
- By 2030
- 79,575 · +5.3%
- By 2040
- 87,670 · +16.1%
- By 2050
- 96,107 · +27.2%
- By 2075
- 117,984 · +56.2%
- By 2100
- 130,010 · +72.1%
Race, ethnicity, and origin ACS 2023
- Neighborhood character
- Predominantly Hispanic (71%)
- Race & ethnicity
- Hispanic / Latino 71% Two or more races 33% White 25% Black 2%
- Hispanic origin (detail)
- Mexican 64%
- Common ancestry
- Lithuanian 1%
- Foreign-born
- 2% · Canada
- Languages at home
- 62% English-only · Spanish 38%
Political lean MEDSL · San Patricio
- 2024 margin
- Solid R (+36.4) · D 31.4% · R 67.8%
- 2008→2024 swing
- -19.8pp toward R · 2008: -16.6pp · 2024: -36.4pp
- All cycles
- 2024: R+36.4 2020: R+29.1 2016: R+24.1 2012: R+20.6 2008: R+16.6
Not yet ingested
- Civics
- —
Market trends
- HPI YoY
- ▼ -81.32%
- Current HPI
- 149.9517
- Rent YoY
- —
- Metro
- —
- State GDP YoY
- ▲ 3.95%
- F500 in state
- 110
Industry mix (Fortune 500 HQ in TX)
| Industry | F500 HQs | Revenue |
|---|---|---|
| Energy | 16 | $1,198B |
|
||
| Technology | 5 | $198B |
|
||
| Engineering / Construction | 4 | $72B |
|
||
| Energy Services | 3 | $60B |
|
||
| Utilities | 3 | $41B |
|
||
| Healthcare | 2 | $330B |
|
||
Price history
+80.0% since first listed3 events — show timeline
- 2025-12-24 Listed $26,999 HARMLS
- 2004-12-08 Sold (MLS) — CBMLS
- 2004-03-12 Listed $15,000 CBMLS
Property tax history
-8.4%/yrLatest (2025): $295 · -39.6% YoY. Source: county tax records.
Cash-flow waterfall
monthlySold comps — $/sqft
last 12 mo · ≤1 miLoading sold comps…