226207 E County Road 365 · Quinlan, OK
Flood risk No data
- FEMA flood zone
- —
- Chance of flooding over 30 yrs
- —
- Est. flood insurance / yr
- —
Fire risk No data
- Est. fire insurance / yr
- —
Heat risk No data
- Hot days now (above threshold)
- —
- Hot days in 30 yrs
- —
Wind risk No data
- Chance of severe wind over 30 yrs
- —
Air-quality risk No data
- Unhealthy air days now
- —
- Unhealthy air days in 30 yrs
- —
Risk factors via First Street. Map © Google.
Why this score? — see what drove the C grade
The composite is a weighted blend of 9 inputs, each scored 0–100. Each bar is that input's sub-score; the figure is the points it added to the 100-point composite (weight × sub-score).
- Cash flow +21.7/30.0
- ARV discount +7.5/15.0
- DSCR +6.9/10.0
- Appreciation +6.9/10.0
- 1% rule +5.7/10.0
- Rent growth +2.5/5.0
- Livability +2.5/5.0
- Schools +2.2/10.0
- Condition / age +2.2/5.0
$125,000
🖨 Deal sheet 📄 Offer letter ✓ Due diligence
Listing remarks
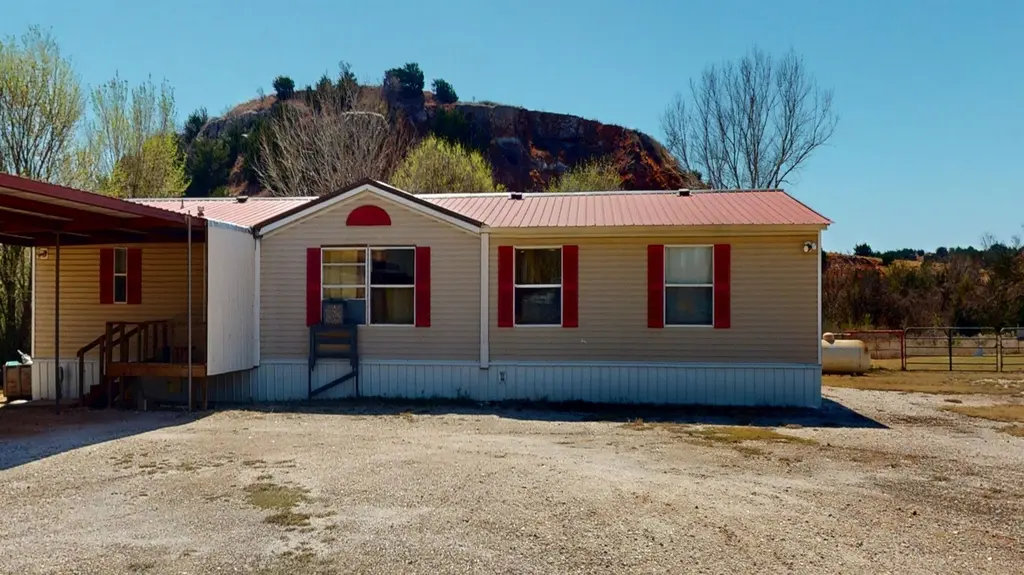
This property offers a truly unique setting. As you enter the long driveway, you’re immediately captivated by the stunning bluffs just beyond the home. The picturesque backdrop perfectly complements this well-maintained 3-bedroom, 2-bath home. Inside, the split floor plan provides both comfort and privacy, with the primary suite on one end and two additional bedrooms and a full bath on the other. In between, you’ll find a cozy yet spacious living room, dining area, and kitchen—ideal for everyday living or entertaining. Step out onto the back deck and unwind while taking in the incredible views this property has to offer.
Key facts
- Stunning bluffs
- Split floor plan
- Primary suite
Tags
Property features AI
Finance
- Other: Residential zoning
Exterior
- Parking: Attached or detached 2-car garage
- Utilities: Septic tank sewer
- Home design: Single-family residence; Single-story
- Construction: 1,848 above-grade finished area
- Exterior features: Metal roof; Approximately 6.6 acres
Interior
- Bathrooms: 2 full bathrooms
- Heating & cooling: Central air conditioning; Electric central heating
- Interior features: Central air conditioning; Central electric heating
Neighborhood map
What this means for you Summary
Snapshot
- This is a 3-bed/2.0-bath single-family listed at $125k. Condition is rated fair.
Deal economics
- At list price, monthly cash flow is $193 ($2k/yr) — positive.
- The deal already cash-flows at list — no discount required.
- Meets the 1% rule at list price ($1k rent vs $125k).
- Recommended offer: $118k (6.0% below list) — sets the bar for market timing.
Location & tenants
- Location reads: area grade C — affects rentability + tenant quality, not the cash-flow math above.
- Mooreland (rural): math 20% / reading 29% proficiency, ranked #103 of 270 in OK (top 38%) — low school quality limits family demand, transient renter base, plan for 1-2y turnover.
- Market conditions: 8 active listings in the ZIP; 2 units permitted in Woodward County in 2024 (0 in 5+ unit buildings).
Forward outlook
- In year one you build about $6k of equity ($864 loan paydown + $5k appreciation (3.8% local appreciation)).
- Woodward County population projected at +39% by 2050 — long-run rental-demand tailwind backs the buy-and-hold thesis.
- At projected returns (3.8% appreciation + 3.0% rent growth), your $35k cash investment doubles in ~4 years — after that, you're playing with house money.
- By year 7, paydown + projected appreciation supports a ~$35k cash-out refi (75% LTV) — recoverable capital for the next deal without selling this one.
Negotiation context
- It's been on market 84 days — a 6% lower offer ($118k) is reasonable based on typical stale-listing flexibility.
Questions for the listing agent
- It's been on market 84 days. Have you received any prior offers? Is the seller open to a 6% concession, seller financing, or rate buy-down credit?
- Have any recent inspections been done? Can we get a copy of the seller's disclosures and any deferred-maintenance estimates?
- Why hasn't it sold? Are there any deal-killer items the seller is aware of (foundation, flood, title, zoning, code violations)?
- Is there a deadline driving the sale (1031 exchange, divorce, estate, relocation)? That informs how much negotiation room exists.
- What's the average days-on-market for RENTAL listings here right now (not sales)? A rising rental-DOM trend means longer vacancies and softer asking-rent achievability than the comps imply.
- What's the recent tenant-quality profile in this submarket — average credit score on applications, eviction rate, late-payment / NSF rate, and stable-employment percentage? A property-management company in the area should have these aggregated.
- How much new for-sale + rental construction is in the pipeline within 1–3 miles? Heavy new supply typically softens prices + rents 12–24 months out; constrained supply supports both.
Investment metrics
- 1% rule
- 1.07% ✓
- Cap rate
- 8.14%
- Cash-on-cash
- 6.61%
- DSCR
- 1.29
- GRM
- 7.8
CMA / ARV
No comps found within radius.
Projected returns pro-forma
3.77% appreciation · 3.0% rent growth · sell at horizon
- IRR
- 15.6%
- Equity multiple
- 1.93×
- Total profit
- $32,554
- Equity at exit
- $61,739
- IRR
- 16.7%
- Equity multiple
- 3.64×
- Total profit
- $92,509
- Equity at exit
- $99,694
Cash invested: $35,000 (down + closing). Projections, not guarantees.
Landlord ↔ Tenant lean methodology
- Overall (STATE)
- 83 Strongly Landlord-Friendly
- State Oklahoma
- 83 Strongly Landlord-Friendly · R+20
- County
- — inherits STATE
- City
- — inherits STATE
ZIP-level market 73852
- Home prices YoY
- 1.7%
- Active inventory
- 8
- Price-to-rent
- 7.8×
Monthly cashflow live
- Estimated rent
- $1,337 medium interval (Pro) →
- Mortgage (P&I)
- −$656
- Tax est. 1.5%
- −$156 /mo · $1,875/yr
- Insurance
- −$52
- HOA
- −$0
- Vacancy / Maint / Mgmt
- −$281
- Net cashflow
- $193
Break-even live
UW: 25.0% down · 7.5% · 30yr · 1.5% tax · 5.0% vac · 8.0% maint · 8.0% mgmt
Financing live
Cash to close
- Down payment
- $31,250
- Closing costs
- $3,750
- Reserves months
- —
- Total cash needed
- —
Loan-product check · same deal, 3 products live
Conventional
25% down · 7.5% · 30yr
- Down + closing
- —
- Monthly P&I
- —
- Monthly cashflow
- —
- DSCR
- —
- Eligible?
- —
Personal DTI + credit; lowest rate.
DSCR
20% down · 8.5% · 30yr
- Down + closing
- —
- Monthly P&I
- —
- Monthly cashflow
- —
- DSCR
- —
- Eligible?
- —
No personal income docs; deal must DSCR.
Hard money
10% down · 12.0% · 12mo
- Down + closing
- —
- Monthly P&I
- —
- Monthly cashflow
- —
- DSCR
- —
- Eligible?
- —
Short-term bridge; refi at stabilization.
Listing history 15 events
-
2026-06-18days on market $125,000 Active 84 DOM
-
2026-06-17days on market $125,000 Active 83 DOM
-
2026-06-16days on market $125,000 Active 82 DOM
-
2026-06-15days on market $125,000 Active 81 DOM
-
2026-06-13days on market $125,000 Active 79 DOM
-
2026-06-12days on market $125,000 Active 78 DOM
-
2026-06-09days on market $125,000 Active 75 DOM
-
2026-06-08days on market $125,000 Active 74 DOM
-
2026-06-08days on market $125,000 Active 73 DOM
-
2026-06-05days on market $125,000 Active 71 DOM
-
2026-06-04days on market $125,000 Active 69 DOM
-
2026-06-02days on market $125,000 Active 68 DOM
-
2026-06-01days on market $125,000 Active 67 DOM
-
2026-05-31days on market $125,000 Active 66 DOM
-
2026-03-26$125,000 Active
ⓘ Source: listings_history table (triggers on properties + properties_extension) + one-shot
backfill from property_details.listing_events for pre-trigger history.
Nearby sold comps map
Loading sold comps map…
Walkable amenities ~0.75 mi
Loading nearby amenities…
Taxation est. · year 1
- Rental income
- $16,049
- − Mortgage interest
- −$7,002
- − Property taxes
- −$1,875
- − Insurance
- −$625
- − Repairs & maintenance
- −$1,284
- − Management
- −$1,284
- − Depreciation
- −$3,636
- Taxable income
- $343
- Est. tax owed @ 24.0%
- −$82
- After-tax cash flow
- $2,230/yr
For passive investors: Depreciation is non-cash, so a rental often shows a tax loss while cash-flowing — sheltering income. Rental losses are passive: they offset passive income freely, and up to $25,000/yr can offset ordinary (W-2) income if you actively participate and your MAGI is under $100k (phasing out to $0 by $150k); unused losses carry forward. On sale, claimed depreciation is recaptured at up to 25%, and gains may owe capital-gains tax (a 1031 exchange can defer both). Figures are a year-1 estimate at your 24.0% rate — not tax advice; consult a CPA.
Condition & rehab AI · 13 photos
This well-maintained 3-bedroom, 2-bath home offers a unique setting with stunning bluffs in the background. While it has a fair condition, it can be improved with cosmetic updates to the exterior and interior, which would significantly enhance its resale and rental value.
Repairs flagged
- Minor kitchen cabinets — slight wear
- Minor bathroom cabinets — slight wear
- Minor roof — existing roof
- Minor exterior siding — existing siding
- Minor interior walls — existing paint
Value-add opportunities
- Both paint exterior — enhances curb appeal and resale value
- Both replace kitchen cabinets — modernizes kitchen and improves resale value
- Both replace bathroom cabinets — modernizes bathroom and improves resale value
Renovation cost estimate screening
| Repair item | Severity | Est. cost |
|---|---|---|
| kitchen cabinets · slight wear | Minor | $500–3,000 |
| bathroom cabinets · slight wear | Minor | $500–3,000 |
| roof · existing roof | Minor | $500–3,000 |
| exterior siding · existing siding | Minor | $500–3,000 |
| interior walls · existing paint | Minor | $500–3,000 |
| Total estimated repair cost · 5 items | $2,500–15,000 |
Value-add ROI direction
- Both paint exterior — enhances curb appeal and resale value ↑
- Both replace kitchen cabinets — modernizes kitchen and improves resale value ↑
- Both replace bathroom cabinets — modernizes bathroom and improves resale value ↑
ⓘ Cost ranges are severity-bucket heuristics (US national rule-of-thumb). Get contractor quotes + a written scope before underwriting a rehab budget.
Schools (NCES district)
- District
- Mooreland
- NCES district ID
- 4020280
- Math proficiency
- 20% ▼ -11.00%
- Reading proficiency
- 29% ▼ -5.00%
- Median HH income
- $51,605
- Composite
- 21.77/100
- National rank
- #8254
- State rank
- #103 of 270 in OK
Livability — Quinlan
No livability data for this city. (Only ~50 U.S. cities are tracked.)
Census & demographics
- Population (ZIP)
- 2,509
Population outlook (Woodward County) Hauer SSP2
- Today (2025)
- 24,787 people
- By 2030
- 26,517 · +7.0%
- By 2040
- 30,299 · +22.2%
- By 2050
- 34,449 · +39.0%
- By 2075
- 46,083 · +85.9%
- By 2100
- 54,639 · +120.4%
Race, ethnicity, and origin ACS 2023
- Neighborhood character
- Predominantly White (86%)
- Race & ethnicity
- White 86% Hispanic / Latino 11% Two or more races 5%
- Hispanic origin (detail)
- Mexican 9%
- Common ancestry
- Lithuanian 2% Portuguese 1% Serbian 1%
- Foreign-born
- 3% · Canada
- Languages at home
- 91% English-only · Spanish 7% German/W. Germanic 1% Other Indo-European 1%
Political lean MEDSL · Woodward
- 2024 margin
- Solid R (+72.0) · D 13.2% · R 85.2% · Other 1.6%
- 2008→2024 swing
- -6.8pp toward R · 2008: -65.2pp · 2024: -72.0pp
- All cycles
- 2024: R+72.0 2020: R+72.0 2016: R+72.1 2012: R+68.0 2008: R+65.2
Not yet ingested
- Civics
- —
Market trends
- HPI YoY
- ▲ 3.77%
- Current HPI
- 220.5065
- Rent YoY
- —
- Metro
- —
- State GDP YoY
- ▲ 1.55%
- F500 in state
- 6
Industry mix (Fortune 500 HQ in OK)
| Industry | F500 HQs | Revenue |
|---|---|---|
| Energy | 3 | $48B |
|
||
Price history
1 event — show timeline
- 2026-03-26 Listed $125,000 NWOAR
Cash-flow waterfall
monthlySold comps — $/sqft
last 12 mo · ≤1 miLoading sold comps…