1240 Oliver Ln · Cleveland, TX
Flood risk No data
- FEMA flood zone
- —
- Chance of flooding over 30 yrs
- —
- Est. flood insurance / yr
- —
Fire risk No data
- Est. fire insurance / yr
- —
Heat risk No data
- Hot days now (above threshold)
- —
- Hot days in 30 yrs
- —
Wind risk No data
- Chance of severe wind over 30 yrs
- —
Air-quality risk No data
- Unhealthy air days now
- —
- Unhealthy air days in 30 yrs
- —
Risk factors via First Street. Map © Google.
Why this score? — see what drove the C- grade
The composite is a weighted blend of 9 inputs, each scored 0–100. Each bar is that input's sub-score; the figure is the points it added to the 100-point composite (weight × sub-score).
- Cash flow +22.2/30.0
- ARV discount +7.5/15.0
- DSCR +7.1/10.0
- Schools +5.1/10.0
- 1% rule +4.5/10.0
- Livability +3.1/5.0
- Rent growth +2.5/5.0
- Condition / age +2.5/5.0
- Appreciation +0.0/10.0
$185,000
🖨 Deal sheet 📄 Offer letter ✓ Due diligence
Listing remarks
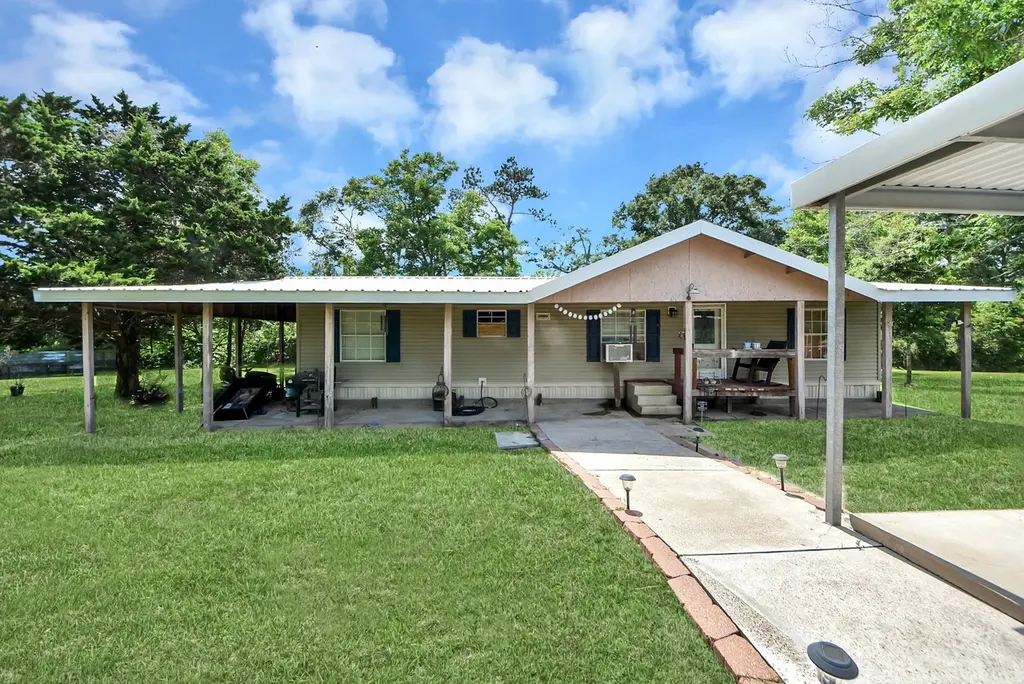
Private 2.6-acre waterfront retreat featuring a 3-bedroom, 2-bath manufactured home with a full wrap-around porch. Nestled among mature trees and overlooking a peaceful pond, this secluded property offers privacy, beautiful views, and easy access to Hwy 105. Perfect for those seeking country living, a weekend getaway, or investment opportunity. 2 Sheds are EXCLUDED from sale
Key facts
- Secluded property
- Peaceful pond
- Mature trees
Tags
Property features AI
Exterior
- Parking: Detached carport; Carport with 2 spaces
- Utilities: Well water; Gravel road access
- Home design: Residential property; Faces north; Built in 1995
- Construction: Cement siding; Vinyl siding; Metal roof
- Exterior features: Covered patio; Patio; Deck; Private yard; Fenced backyard (partial fence); Cleared lot; Side yard
Interior
- Kitchen: Convection oven; Dishwasher; Microwave
- Bedrooms: 3 total rooms
- Bathrooms: 2 full bathrooms
- Heating & cooling: Window unit heating; Window unit cooling; Has heating; Has cooling
- Interior features: Jetted tub; Pantry; Separate shower
- Laundry & utility: Electric dryer hookup
Neighborhood map
What this means for you Summary
Snapshot
- This is a 3-bed/2.0-bath manufactured listed at $185k.
Deal economics
- At list price, monthly cash flow is $301 ($4k/yr) — positive.
- The deal already cash-flows at list — no discount required.
- To meet the 1% rule (rent ≥ 1% of price), the offer needs to be $177k (4.6% below list).
- Recommended offer: $177k (4.6% below list) — sets the bar for 1% rule.
- Cap rate 8.2% vs local median 4.7% in Cleveland — top-decile yield for the area; either an underpriced asset or a hidden risk that comps aren't pricing in. Stress-test before assuming the spread holds.
Location & tenants
- Location reads 61/100 on livability (#1,013 in TX) — a middle-class / working-renter tenant base. Strengths: cost of living A+, housing A+; Watch: crime D-, amenities F, commute F.
- Conroe ISD (other): math 57% / reading 57% proficiency, ranked #69 of 826 in TX (top 8%) — acceptable for families but not a draw, mixed tenant base, ~2y average lease.
- Zoned schools: Caney Creek H S (math 33% / reading 42%, grade F, #888 of 1,632 statewide, top 55%, 2,504 students, 79% FRL) — zoned schools average 79% FRL vs 34% district-wide (45 pts higher); higher-poverty schools than district average — tighter screening recommended.
- Zoned-school proficiency averages 38% at this address vs 57% district-wide (-20 pts) — the specific schools serving this property underperform the Conroe ISD average; the district grade overstates school quality for this exact location.
- Market conditions: 336 active listings in the ZIP; 13,259 units permitted in Montgomery County in 2024 (1,402 in 5+ unit buildings).
- This rent runs 34% of the median local income ($62k/yr) — at the standard rent-burdened threshold; future hikes will face affordability resistance.
Forward outlook
- Local home prices are declining (-3.0%/yr); year-one equity from $1k of loan paydown is wiped out by about $6k of value loss. Plan a longer hold.
- Montgomery County population projected at +65% by 2050 — long-run rental-demand tailwind backs the buy-and-hold thesis.
Negotiation context
- Only 5 days on market — expect competitive offers; lowballing is unlikely to land.
Questions for the listing agent
- Is there a deadline driving the sale (1031 exchange, divorce, estate, relocation)? That informs how much negotiation room exists.
- Schools are F-rated, which usually means shorter tenancies and higher turnover. Who's the typical renter profile here, and what's been the actual vacancy rate?
- Crime grade is D in this area — have there been break-ins, vandalism, or insurance claims at this property in the last 3 years? What carrier currently insures it and at what premium?
- What's the average days-on-market for RENTAL listings here right now (not sales)? A rising rental-DOM trend means longer vacancies and softer asking-rent achievability than the comps imply.
- What's the recent tenant-quality profile in this submarket — average credit score on applications, eviction rate, late-payment / NSF rate, and stable-employment percentage? A property-management company in the area should have these aggregated.
- How much new for-sale + rental construction is in the pipeline within 1–3 miles? Heavy new supply typically softens prices + rents 12–24 months out; constrained supply supports both.
Investment metrics
- 1% rule
- 0.95% ✗
- Cap rate
- 8.25%
- Cash-on-cash
- 6.98%
- DSCR
- 1.31
- GRM
- 8.7
CMA / ARV
No comps found within radius.
Projected returns pro-forma
-3.0% appreciation · 3.0% rent growth · sell at horizon
- IRR
- -5.7%
- Equity multiple
- 0.79×
- Total profit
- $-10,888
- Equity at exit
- $27,584
- IRR
- 3.9%
- Equity multiple
- 1.29×
- Total profit
- $14,859
- Equity at exit
- $15,995
Cash invested: $51,800 (down + closing). Projections, not guarantees.
Landlord ↔ Tenant lean methodology
- Overall (STATE)
- 87 Strongly Landlord-Friendly
- State Texas
- 87 Strongly Landlord-Friendly · R+5
- County
- — inherits STATE
- City
- — inherits STATE
ZIP-level market 77328
- Home prices YoY
- -7.7%
- Active inventory
- 336
- Price-to-rent
- 8.7×
Monthly cashflow live
- Estimated rent
- $1,765 medium interval (Pro) →
- Mortgage (P&I)
- −$970
- Tax from tax record
- −$46 /mo · $554/yr
- Insurance
- −$77
- HOA
- −$0
- Vacancy / Maint / Mgmt
- −$371
- Net cashflow
- $301
Break-even live
Sensitivity live
| Price | -10% $406 | -5% $353 | +0% $301 | +5% $249 | +10% $196 |
|---|---|---|---|---|---|
| Rent | -10% $162 | -5% $231 | +0% $301 | +5% $371 | +10% $441 |
| Rate | -1.0pp $394 | -0.5pp $348 | base $301 | +0.5pp $253 | +1.0pp $204 |
UW: 25.0% down · 7.5% · 30yr · 1.5% tax · 5.0% vac · 8.0% maint · 8.0% mgmt
Financing live
Cash to close
- Down payment
- $46,250
- Closing costs
- $5,550
- Reserves months
- —
- Total cash needed
- —
Loan-product check · same deal, 3 products live
Conventional
25% down · 7.5% · 30yr
- Down + closing
- —
- Monthly P&I
- —
- Monthly cashflow
- —
- DSCR
- —
- Eligible?
- —
Personal DTI + credit; lowest rate.
DSCR
20% down · 8.5% · 30yr
- Down + closing
- —
- Monthly P&I
- —
- Monthly cashflow
- —
- DSCR
- —
- Eligible?
- —
No personal income docs; deal must DSCR.
Hard money
10% down · 12.0% · 12mo
- Down + closing
- —
- Monthly P&I
- —
- Monthly cashflow
- —
- DSCR
- —
- Eligible?
- —
Short-term bridge; refi at stabilization.
Listing history 7 events
-
2026-06-18days on market $185,000 Active 5 DOM
-
2026-06-17statusdays on market $185,000 Active 4 DOM
-
2026-06-10status $185,000 Pending 3 DOM
-
2026-06-09days on market $185,000 Active 3 DOM
-
2026-06-08days on market $185,000 Active 2 DOM
-
2026-06-07remarks 377-char remark
-
2026-06-07$185,000 Active 1 DOM
ⓘ Source: listings_history table (triggers on properties + properties_extension) + one-shot
backfill from property_details.listing_events for pre-trigger history.
Tax reassessment forecast TX · Resets to sale price
- Current annual tax
- $554 · $46/mo
- Projected year-2 tax
- $3,386 · $282/mo
- Expected delta
- +$2,832/yr (+$236/mo · 511.7%)
ⓘ Screening estimate from a state-policy table — verify with the county assessor before closing.
Nearby sold comps map
Loading sold comps map…
Walkable amenities ~0.75 mi
Loading nearby amenities…
Taxation est. · year 1
- Rental income
- $21,182
- − Mortgage interest
- −$10,363
- − Property taxes
- −$554
- − Insurance
- −$925
- − Repairs & maintenance
- −$1,695
- − Management
- −$1,695
- − Depreciation
- −$5,382
- Taxable income
- $570
- Est. tax owed @ 24.0%
- −$137
- After-tax cash flow
- $3,477/yr
For passive investors: Depreciation is non-cash, so a rental often shows a tax loss while cash-flowing — sheltering income. Rental losses are passive: they offset passive income freely, and up to $25,000/yr can offset ordinary (W-2) income if you actively participate and your MAGI is under $100k (phasing out to $0 by $150k); unused losses carry forward. On sale, claimed depreciation is recaptured at up to 25%, and gains may owe capital-gains tax (a 1031 exchange can defer both). Figures are a year-1 estimate at your 24.0% rate — not tax advice; consult a CPA.
Schools (NCES district)
- District
- Conroe ISD
- NCES district ID
- 4815000
- Math proficiency
- 57% ▼ -6.00%
- Reading proficiency
- 57% ▼ -1.00%
- Median HH income
- $71,541
- Composite
- 50.65/100
- National rank
- #1833
- State rank
- #69 of 826 in TX
Livability — Cleveland
- Score
- 61/100
- State rank
- #1013
- US rank
- #17943
Category grades
Schools grade is shown separately in the Schools card above.
Census & demographics
- County
- San Jacinto County · 17,208 people
- City population
- 17,208
- Metro
- Houston-The Woodlands-Sugar Land, TX
- Population (ZIP)
- 17,208
- Household income
- $62,428
- Rent vs Own
- Severe rent burden
- 58.0
Population outlook (Montgomery County) Hauer SSP2
- Today (2025)
- 713,896 people
- By 2030
- 805,263 · +12.8%
- By 2040
- 992,708 · +39.1%
- By 2050
- 1,179,590 · +65.2%
- By 2075
- 1,628,084 · +128.1%
- By 2100
- 1,937,880 · +171.5%
Race, ethnicity, and origin ACS 2023
- Neighborhood character
- Majority White (61%)
- Race & ethnicity
- White 61% Hispanic / Latino 33% Two or more races 14% Black 2%
- Hispanic origin (detail)
- Mexican 27% Cuban 1%
- Common ancestry
- Lithuanian 4% Italian 3% Serbian 3%
- Foreign-born
- 18% · Canada, China
- Languages at home
- 67% English-only · Spanish 31% Chinese 1%
Political lean MEDSL · Montgomery
- 2024 margin
- Solid R (+45.5) · D 26.8% · R 72.3%
- 2008→2024 swing
- +7.2pp toward D · 2008: -52.7pp · 2024: -45.5pp
- All cycles
- 2024: R+45.5 2020: R+43.8 2016: R+51.4 2012: R+60.7 2008: R+52.7
Not yet ingested
- Civics
- —
Market trends
- HPI YoY
- ▼ -22.82%
- Current HPI
- 273.6604
- Rent YoY
- —
- Metro
- Houston-The Woodlands-Sugar Land, TX
- State GDP YoY
- ▲ 3.95%
- F500 in state
- 110
Industry mix (Fortune 500 HQ in TX)
| Industry | F500 HQs | Revenue |
|---|---|---|
| Energy | 16 | $1,198B |
|
||
| Technology | 5 | $198B |
|
||
| Engineering / Construction | 4 | $72B |
|
||
| Energy Services | 3 | $60B |
|
||
| Utilities | 3 | $41B |
|
||
| Healthcare | 2 | $330B |
|
||
Price history
3 events — show timeline
- 2026-06-06 Listed $185,000 HARMLS
- 2024-11-07 Sold (Public Records) — Public Records
- 2024-11-07 Sold (Public Records) — Public Records
Property tax history
-4.3%/yrLatest (2025): $554 · -1.6% YoY. Source: county tax records.
Cash-flow waterfall
monthlySold comps — $/sqft
last 12 mo · ≤1 miLoading sold comps…