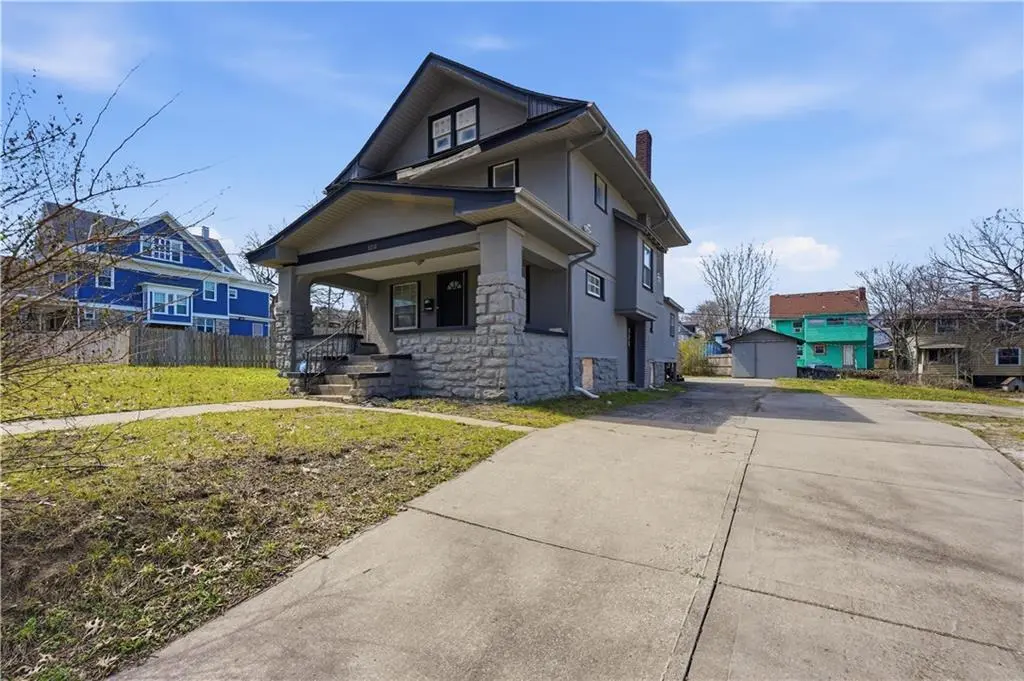
3218 Benton Blvd · Kansas City, MO
Flood risk 1/10 · Minimal
- FEMA flood zone
- X (unshaded)
- Chance of flooding over 30 yrs
- 0.0%
- Est. flood insurance / yr
- $473 – $860
Fire risk 1/10 · Minimal
- Est. fire insurance / yr
- $1,054 – $1,958
Heat risk 4/10 · Minor
- Hot days now (above 106°F)
- 7 days/yr
- Hot days in 30 yrs
- 16 days/yr
Wind risk 2/10 · Minimal
- Chance of severe wind over 30 yrs
- —
Air-quality risk 3/10 · Minor
- Unhealthy air days now
- 2 days/yr
- Unhealthy air days in 30 yrs
- 3 days/yr
Risk factors via First Street. Map © Google.
Why this score? — see what drove the B- grade
The composite is a weighted blend of 9 inputs, each scored 0–100. Each bar is that input's sub-score; the figure is the points it added to the 100-point composite (weight × sub-score).
- Cash flow +23.6/30.0
- Appreciation +10.0/10.0
- ARV discount +8.3/15.0
- DSCR +7.6/10.0
- 1% rule +4.9/10.0
- Livability +3.9/5.0
- Rent growth +3.7/5.0
- Condition / age +2.5/5.0
- Schools +1.5/10.0
$155,000
🖨 Deal sheet (PDF) 📄 Offer letter ✓ Due diligence
Listing remarks
Great opportunity in the heart of Kansas City to own this spacious 4-bedroom, 2.5-bath home (3216 is a separate parcel being sold with the property) and be just minutes from the vibrant nightlife, dining, and entertainment scene that defines the city. Perfectly positioned for all the excitement surrounding the upcoming FIFA World Cup 2026, this property offers both convenience and opportunity. Newly painted and electrical has been updated. Inside, you’ll find a true blank canvas—ready for your personal touch and vision. With generous living space and endless potential, this home is ideal for buyers looking to create something special in a prime location. Whether you're entertain
Key facts
- 0.24 acre lot
- Built 1920
- Listed 46 days
Property features AI
Finance
- Financial info: Annual tax listed
Exterior
- Parking: Off-street parking
- Utilities: City/public water (verify); Public sewer
- Home design: Single-family residence; 2.5 stories; Residential property
- Construction: Lap siding; Composition roof; Approximately 101+ years old
- Exterior features: Off-street parking; Not in a flood plain; Lot approximately 10,454 square feet
Interior
- Bedrooms: 4 bedrooms
- Flooring: Carpet; Wood
- Bathrooms: 2 full bathrooms; 1 half bathroom
- Heating & cooling: Electric heating; Electric cooling
- Interior features: Ceiling fan(s); Painted cabinets; Formal dining area; Daylight unfinished basement; Living room fireplace
- Laundry & utility: Laundry off the kitchen
Neighborhood map
What this means for you Summary
Snapshot
- This is a 4-bed/1.0-bath single-family listed at $155k.
Deal economics
- At list price, monthly cash flow is $291 ($3k/yr) — positive.
- The deal already cash-flows at list — no discount required.
- To meet the 1% rule (rent ≥ 1% of price), the offer needs to be $154k (0.7% below list).
- Recommended offer: $150k (3.0% below list) — sets the bar for market timing.
- Cap rate 8.5% vs local median 3.9% in Kansas City — top-decile yield for the area; either an underpriced asset or a hidden risk that comps aren't pricing in. Stress-test before assuming the spread holds.
Location & tenants
- Location reads 78/100 on livability (#28 in MO, #2,671 nationally) — a middle-class / working-renter tenant base. Strengths: amenities A+, commute A+, cost of living A+; Watch: crime F.
- Kansas City 33 (urban): math 12% / reading 24% proficiency, ranked #308 of 324 in MO (top 95%) — low school quality limits family demand, transient renter base, plan for 1-2y turnover; 75% free/reduced lunch — lower-income household profile, screen leases tightly.
- Zoned schools: M. L. King Elementary (math 2% / reading 8%, grade F, #1,072 of 1,115 statewide, top 98%, 665 students, 100% FRL); Central Middle School (math 0% / reading 9%, grade F, #388 of 391 statewide, top 99%, 428 students, 99% FRL); Central High School (math 2% / reading 17%, grade F, #507 of 521 statewide, top 98%, 535 students, 99% FRL) — zoned schools average 99% FRL vs 75% district-wide (24 pts higher); higher-poverty schools than district average — tighter screening recommended.
- Market conditions: Rents rising fast (+4.7%/yr); 87 active listings in the ZIP; 34 comparable units currently listed for rent nearby; rentals at typical pace (median 26d on market — plan ~3-4 weeks tenant-placement turnaround); lower-income renter base — watch delinquency; 4,002 units permitted in Jackson County in 2024 (2,271 in 5+ unit buildings).
- At $1,539/mo this rent would consume 51% of the median local household income ($36k/yr) (locally 946% of renters already pay >50% of income on rent) — very limited rent-growth headroom before tenants either downsize or default.
Forward outlook
- In year one you build about $17k of equity ($1k loan paydown + $16k appreciation (10.0% local appreciation)).
- Jackson County population projected at +4% by 2050 — modest demand growth; plan on rents tracking national, not racing it.
- At projected returns (10.0% appreciation + 4.7% rent growth), your $43k cash investment doubles in ~3 years — after that, you're playing with house money.
- By year 3, paydown + projected appreciation supports a ~$42k cash-out refi (75% LTV) — recoverable capital for the next deal without selling this one.
Negotiation context
- It's been on market 46 days — a 3% lower offer ($150k) is reasonable based on typical stale-listing flexibility.
- 9 sale attempts since 18y ago with the ask held roughly flat each time — persistent listings suggest the price (not the market) is what's stuck; bring a comps-based counter.
Risks & watch-outs
- Watch-outs: built in 1920 — expect roof / HVAC / electrical / plumbing capex.
Questions for the listing agent
- It's been on market 46 days. Have you received any prior offers? Is the seller open to a 3% concession, seller financing, or rate buy-down credit?
- Built in 1920 — when were the roof, HVAC, electrical panel, plumbing, and water heater last replaced?
- Is there a deadline driving the sale (1031 exchange, divorce, estate, relocation)? That informs how much negotiation room exists.
- Crime grade is F in this area — have there been break-ins, vandalism, or insurance claims at this property in the last 3 years? What carrier currently insures it and at what premium?
- What's the average days-on-market for RENTAL listings here right now (not sales)? A rising rental-DOM trend means longer vacancies and softer asking-rent achievability than the comps imply.
- What's the recent tenant-quality profile in this submarket — average credit score on applications, eviction rate, late-payment / NSF rate, and stable-employment percentage? A property-management company in the area should have these aggregated.
- How much new for-sale + rental construction is in the pipeline within 1–3 miles? Heavy new supply typically softens prices + rents 12–24 months out; constrained supply supports both.
Investment metrics
- 1% rule
- 0.99% ✗
- Cap rate
- 8.55%
- Cash-on-cash
- 8.05%
- DSCR
- 1.36
- GRM
- 8.4
CMA / ARV
- ARV (on-the-fly)
- $157,724
- Comps found
- 12
Show comp detail 12 sales within ~0.75 mi
| Address | Dist | Beds/Ba | Sqft | Sold | Price | $/sf | Match |
|---|---|---|---|---|---|---|---|
| 3218 Benton Blvd | 0.00mi | 4/2.5 | 1,854 (+1%) | 0mo | $155,000 | $84 | 92 |
| 3338 Bellefontaine Ave | 0.18mi | 4/1.5 | 1,855 (+1%) | 8mo | $160,000 | $86 | 81 |
| 3547 Bellefontaine Ave | 0.44mi | 3/1.0 (-1) | 1,748 (-5%) | 0mo | $95,000 | $54 | 66 |
| 3428 College Ave | 0.28mi | 4/2.0 | 2,010 (+10%) | 3mo | $204,900 | $102 | 64 |
| 3029 Askew Ave | 0.37mi | 3/1.0 (-1) | 2,042 (+11%) | 3mo | $55,000 | $27 | 56 |
| 3715 College Ave | 0.62mi | 3/2.0 (-1) | 1,905 (+4%) | 4mo | $199,900 | $105 | 53 |
| 3618 Olive St | 0.70mi | 3/1.5 (-1) | 1,864 (+2%) | 7mo | $152,900 | $82 | 51 |
| 3237 Park Ave | 0.52mi | 3/3.0 (-1) | 1,956 (+7%) | 1mo | $178,000 | $91 | 51 |
| 3717 Indiana Ave | 0.64mi | 4/1.5 | 1,644 (-10%) | 2mo | $129,000 | $78 | 50 |
| 2634 Bales Ave | 0.74mi | 4/2.5 | 1,734 (-6%) | 4mo | $209,000 | $121 | 47 |
| 3615 College Ave | 0.49mi | 3/1.5 (-1) | 1,598 (-13%) | 5mo | $50,000 | $31 | 44 |
| 3805 Bellefontaine Ave | 0.71mi | 3/1.5 (-1) | 1,624 (-12%) | 5mo | $169,900 | $105 | 37 |
Match score weights: distance 35% · size 25% · config 20% · recency 20%. Top-matched comps best support the ARV.
Projected returns pro-forma
10.0% appreciation · 4.65% rent growth · sell at horizon
- IRR
- 30.7%
- Equity multiple
- 3.43×
- Total profit
- $105,480
- Equity at exit
- $139,636
- IRR
- 27.1%
- Equity multiple
- 7.95×
- Total profit
- $301,550
- Equity at exit
- $301,131
Cash invested: $43,400 (down + closing). Projections, not guarantees.
Landlord ↔ Tenant lean methodology
- Overall (STATE)
- 81 Strongly Landlord-Friendly
- State Missouri
- 81 Strongly Landlord-Friendly · R+10
- County
- — inherits STATE
- City
- — inherits STATE
ZIP-level market 64128
- Home prices YoY
- 21.6%
- Rents YoY
- 4.7%
- Active inventory
- 87
- Price-to-rent
- 8.4×
Monthly cashflow live
- Estimated rent
- $1,539 high interval (Pro) →
- Mortgage (P&I)
- −$813
- Tax from tax record
- −$47 /mo · $569/yr
- Insurance
- −$65
- HOA
- −$0
- Lot rent
- −$0
- Vacancy / Maint / Mgmt
- −$323
- Net cashflow
- $291
Break-even live
Sensitivity live
| Price | -10% $379 | -5% $335 | +0% $291 | +5% $247 | +10% $203 |
|---|---|---|---|---|---|
| Rent | -10% $169 | -5% $230 | +0% $291 | +5% $352 | +10% $413 |
| Rate | -1.0pp $369 | -0.5pp $330 | base $291 | +0.5pp $251 | +1.0pp $210 |
UW: 25.0% down · 7.5% · 30yr · 1.5% tax · 5.0% vac · 8.0% maint · 8.0% mgmt
Financing live
Cash to close
- Down payment
- $38,750
- Closing costs
- $4,650
- Reserves months
- —
- Total cash needed
- —
Loan-product check · same deal, 3 products live
Conventional
25% down · 7.5% · 30yr
- Down + closing
- —
- Monthly P&I
- —
- Monthly cashflow
- —
- DSCR
- —
- Eligible?
- —
Personal DTI + credit; lowest rate.
DSCR
20% down · 8.5% · 30yr
- Down + closing
- —
- Monthly P&I
- —
- Monthly cashflow
- —
- DSCR
- —
- Eligible?
- —
No personal income docs; deal must DSCR.
Hard money
10% down · 12.0% · 12mo
- Down + closing
- —
- Monthly P&I
- —
- Monthly cashflow
- —
- DSCR
- —
- Eligible?
- —
Short-term bridge; refi at stabilization.
Rent comps 34 comps
| Address | Beds | Baths | Sqft | Rent | $/sqft | DOM | Units | Dist |
|---|---|---|---|---|---|---|---|---|
| 3205 E 31st St Kansas City, MO | 4.0 | 1.0 | 1800 | $1,325 | $0.74 | 26d | 1 | 0.17mi |
| 3346 Agnes Ave Kansas City, MO | 3.0 | 1.0 | 1400 | $1,200 | $0.86 | 10d | 1 | 0.24mi |
| 3310 Askew Ave Kansas City, MO | 3.0 | 2.0 | 1484 | $1,500 | $1.01 | 0d | 1 | 0.25mi |
| 3419 College Ave Kansas City, MO | 4.0 | 1.0 | 1608 | $1,300 | $0.81 | 4d | 1 | 0.25mi |
| 3305 Askew Ave Kansas City, MO | 3.0 | 1.5 | 1428 | $1,450 | $1.02 | 26d | 1 | 0.27mi |
| 3015 Montgall Ave Kansas City, MO | 4.0 | 2.5 | 2134 | $1,850 | $0.87 | 0d | 1 | 0.39mi |
| 3524 Bellefontaine Ave Kansas City, MO | 3.0 | 1.0 | 1228 | $1,350 | $1.10 | 46d | 1 | 0.40mi |
| 3525 Monroe Ave Kansas City, MO | 3.0 | 2.0 | 1569 | $1,500 | $0.96 | 46d | 1 | 0.50mi |
| 3630 Agnes Ave Kansas City, MO | 3.0 | 2.0 | 1448 | $1,500 | $1.04 | 13d | 1 | 0.55mi |
| 3332 Norton Ave Kansas City, MO | 3.0 | 1.0 | 1272 | $1,350 | $1.06 | 46d | 1 | 0.56mi |
| 3434 Olive St Kansas City, MO | 3.0 | 2.0 | 2020 | $1,445 | $0.72 | 46d | 1 | 0.59mi |
| 3811 E 36th St Kansas City, MO | 3.0 | 1.0 | 2590 | $1,350 | $0.52 | 46d | 1 | 0.60mi |
| 2846 Myrtle Ave Kansas City, MO | 3.0 | 2.0 | 1705 | $1,350 | $0.79 | 18d | 1 | 0.64mi |
| 2120 Linwood Blvd Kansas City, MO | 3.0 | 1.0 | 1326 | $1,400 | $1.06 | 46d | 1 | 0.65mi |
| 3739 Bales Ave Kansas City, MO | 3.0 | 2.0 | 1400 | $1,575 | $1.12 | 26d | 1 | 0.70mi |
| 3713 Cleveland Ave Kansas City, MO | 4.0 | 1.0 | 1256 | $1,250 | $1.00 | 18d | 1 | 0.72mi |
| 3009 Garfield Ave Kansas City, MO | 3.0 | 1.5 | 1334 | $1,425 | $1.07 | 46d | 1 | 0.73mi |
| 3604 Park Ave Kansas City, MO | 3.0 | 1.5 | 1320 | $1,550 | $1.17 | 0d | 1 | 0.73mi |
| 3817 S Benton Ave Kansas City, MO | 4.0 | 1.5 | 1380 | $1,650 | $1.20 | 26d | 1 | 0.75mi |
| 2018 E 35th St Kansas City, MO | 3.0 | 2.0 | 1502 | $1,800 | $1.20 | 5d | 1 | 0.76mi |
| 2002 E 35th St Kansas City, MO | 3.0 | 2.0 | 1426 | $1,250 | $0.88 | 0d | 1 | 0.79mi |
| 3840 Bellefontaine Ave Kansas City, MO | 3.0 | 1.0 | 1500 | $1,500 | $1.00 | 18d | 1 | 0.80mi |
| 2708 Olive St Kansas City, MO | 4.0 | 2.0 | 1585 | $1,500 | $0.95 | 19d | 1 | 0.83mi |
| 2723 Park Ave Kansas City, MO | 5.0 | 3.0 | 2010 | $1,875 | $0.93 | 23d | 1 | 0.83mi |
| 2724 Brooklyn Ave Kansas City, MO | 3.0 | 2.5 | 1398 | $1,440 | $1.03 | 26d | 1 | 0.89mi |
| 3902 Wabash Ave Kansas City, MO | 4.0 | 2.0 | 1400 | $1,850 | $1.32 | 46d | 1 | 0.94mi |
| 4018 Prospect Ave Kansas City, MO | 4.0 | 1.5 | 1900 | $1,695 | $0.89 | 46d | 1 | 1.06mi |
| 4116 Bellefontaine Ave Kansas City, MO | 3.0 | 1.0 | 1234 | $1,000 | $0.81 | 26d | 1 | 1.11mi |
| 4119 S Benton Ave Kansas City, MO | 4.0 | 2.0 | 1700 | $1,800 | $1.06 | 46d | 1 | 1.13mi |
| 4014 Park Ave Kansas City, MO | 3.0 | 2.0 | 1271 | $1,273 | $1.00 | 46d | 1 | 1.13mi |
| 4107 Olive St Kansas City, MO | 3.0 | 1.5 | 1271 | $1,578 | $1.24 | 10d | 1 | 1.18mi |
| 4112 Park Ave Kansas City, MO | 4.0 | 2.0 | 1700 | $1,800 | $1.06 | 17d | 1 | 1.24mi |
| 2729 Grove St Kansas City, MO | 3.0 | 2.0 | 1510 | $1,375 | $0.91 | 46d | 1 | 1.26mi |
| 912 E 31st St Kansas City, MO | 5.0 | 1.5 | 2200 | $1,800 | $0.82 | 18d | 1 | 1.50mi |
Listing history 24 events
-
2026-05-22status Pending
-
2026-04-10historical Active Under Contract
-
2026-04-06$155,000 Active
-
2026-03-09historical
-
2025-12-16status Active
-
2025-11-21historical Active Under Contract
-
2025-10-09$165,000 Active
-
2025-09-30historical
-
2025-09-18price $175,000
-
2025-07-29price $185,000
-
2025-06-26price $199,000
-
2025-05-23$225,000 Active
-
2022-10-26status Active
-
2022-10-26historical
-
2022-10-19status Pending
-
2022-09-20status Active
-
2022-08-30status Pending
-
2022-07-23price $100,000
-
2022-07-22status Active
-
2022-06-01status Pending
-
2022-05-21$135,000 Active
-
2009-01-12historical
-
2008-08-11$53,000
-
1993-11-01soldstatus
ⓘ Source: listings_history table (triggers on properties + properties_extension) + one-shot
backfill from property_details.listing_events for pre-trigger history.
Tax reassessment forecast MO · Resets to sale price
- Current annual tax
- $569 · $47/mo
- Projected year-2 tax
- $1,504 · $125/mo
- Expected delta
- +$935/yr (+$78/mo · 164.2%)
ⓘ Screening estimate from a state-policy table — verify with the county assessor before closing.
Climate risk First Street
- Flood 1/10 Low FEMA zone X (unshaded) · 0% chance over 30 yrs
- Wildfire 1/10 Low
- Heat 4/10 Moderate 7 d/yr ≥106°F today · 16 d/yr by 30 yrs out
- Wind 2/10 Low
- Air quality 3/10 Moderate 2 unhealthy d/yr today · 3 by 30 yrs out
Nearby sold comps map
Loading sold comps map…
Walkable amenities ~0.75 mi
Loading nearby amenities…
Taxation est. · year 1
- Rental income
- $18,468
- − Mortgage interest
- −$8,682
- − Property taxes
- −$569
- − Insurance
- −$775
- − Repairs & maintenance
- −$1,477
- − Management
- −$1,477
- − Depreciation
- −$4,509
- Taxable income
- $978
- Est. tax owed @ 24.0%
- −$235
- After-tax cash flow
- $3,257/yr
For passive investors: Depreciation is non-cash, so a rental often shows a tax loss while cash-flowing — sheltering income. Rental losses are passive: they offset passive income freely, and up to $25,000/yr can offset ordinary (W-2) income if you actively participate and your MAGI is under $100k (phasing out to $0 by $150k); unused losses carry forward. On sale, claimed depreciation is recaptured at up to 25%, and gains may owe capital-gains tax (a 1031 exchange can defer both). Figures are a year-1 estimate at your 24.0% rate — not tax advice; consult a CPA.
Schools (NCES district)
- District
- Kansas City 33
- NCES district ID
- 2916400
- Math proficiency
- 12% ▼ -8.00%
- Reading proficiency
- 24% ▬ 0.00%
- Median HH income
- $35,227
- Composite
- 14.8/100
- National rank
- #9387
- State rank
- #308 of 324 in MO
Livability — Kansas City
- Score
- 78/100
- State rank
- #28
- US rank
- #2671
Category grades
Schools grade is shown separately in the Schools card above.
Census & demographics
- Census place
- Kansas City, MO
- County
- Jackson County · 687,798 people
- City population
- 439,467
- Metro
- Kansas City, MO-KS
- Population (ZIP)
- 11,912
- Household income
- $36,088
- Rent vs Own
- Severe rent burden
- 946.0
Population outlook (Jackson County) Hauer SSP2
- Today (2025)
- 719,589 people
- By 2030
- 731,456 · +1.6%
- By 2040
- 746,689 · +3.8%
- By 2050
- 749,289 · +4.1%
- By 2075
- 736,227 · +2.3%
- By 2100
- 668,210 · -7.1%
Race, ethnicity, and origin ACS 2023
- Neighborhood character
- Predominantly Black (79%)
- Race & ethnicity
- Black 79% Hispanic / Latino 9% White 8% Two or more races 7%
- Hispanic origin (detail)
- Mexican 6%
- Common ancestry
- Swedish 1% Hispanic 1%
- Foreign-born
- 7% · Canada
- Languages at home
- 88% English-only · Spanish 7% French/Haitian/Cajun 2%
Political lean MEDSL · Jackson
- 2024 margin
- D (+19.3) · D 58.9% · R 39.5% · Other 1.6%
- 2008→2024 swing
- -6.1pp toward R · 2008: 25.4pp · 2024: 19.3pp
- All cycles
- 2024: D+19.3 2020: D+22.0 2016: D+16.6 2012: D+19.0 2008: D+25.4
Not yet ingested
- Civics
- —
Market trends
- HPI YoY
- ▲ 73.41%
- Current HPI
- 412.6862
- Rent YoY
- ▲ 4.65%
- Metro
- Kansas City, MO-KS
- State GDP YoY
- ▲ 1.84%
- F500 in state
- 20
Industry mix (Fortune 500 HQ in MO)
| Industry | F500 HQs | Revenue |
|---|---|---|
| Healthcare | 1 | $163B |
|
||
| Insurance | 1 | $21B |
|
||
| Industrial Technology | 1 | $17B |
|
||
| Retail | 1 | $16B |
|
||
| Industrial Distribution | 1 | $10B |
|
||
| Utilities | 1 | $9B |
|
||
Price history
+192.5% since first listed24 events — show timeline
- 2026-05-22 Pending — Heartland MLS as Distributed by MLS Grid
- 2026-04-10 Contingent — Heartland MLS as Distributed by MLS Grid
- 2026-04-06 Listed $155,000 Heartland MLS as Distributed by MLS Grid
- 2026-03-09 Listing Removed — Heartland MLS as Distributed by MLS Grid
- 2025-12-16 Relisted — Heartland MLS as Distributed by MLS Grid
- 2025-11-21 Contingent — Heartland MLS as Distributed by MLS Grid
- 2025-10-09 Listed $165,000 Heartland MLS as Distributed by MLS Grid
- 2025-09-30 Listing Removed — Heartland MLS as Distributed by MLS Grid
- 2025-09-18 Price Changed $175,000 Heartland MLS as Distributed by MLS Grid
- 2025-07-29 Price Changed $185,000 Heartland MLS as Distributed by MLS Grid
- 2025-06-26 Price Changed $199,000 Heartland MLS as Distributed by MLS Grid
- 2025-05-23 Listed $225,000 Heartland MLS as Distributed by MLS Grid
- 2022-10-26 Relisted — Heartland MLS as Distributed by MLS Grid
- 2022-10-26 Listing Removed — Heartland MLS as Distributed by MLS Grid
- 2022-10-19 Pending — Heartland MLS as Distributed by MLS Grid
- 2022-09-20 Relisted — Heartland MLS as Distributed by MLS Grid
- 2022-08-30 Pending — Heartland MLS as Distributed by MLS Grid
- 2022-07-23 Price Changed $100,000 Heartland MLS as Distributed by MLS Grid
- 2022-07-22 Relisted — Heartland MLS as Distributed by MLS Grid
- 2022-06-01 Pending — Heartland MLS as Distributed by MLS Grid
- 2022-05-21 Listed $135,000 Heartland MLS as Distributed by MLS Grid
- 2009-01-12 Listing Removed — Heartland MLS as Distributed by MLS Grid
- 2008-08-11 Listed $53,000 Heartland MLS as Distributed by MLS Grid
- 1993-11-01 Sold (Public Records) — Public Records
Property tax history
+4.3%/yrLatest (2025): $569 · -36.8% YoY. Source: county tax records.
Cash-flow waterfall
monthlySold comps — $/sqft
last 12 mo · ≤1 miLoading sold comps…