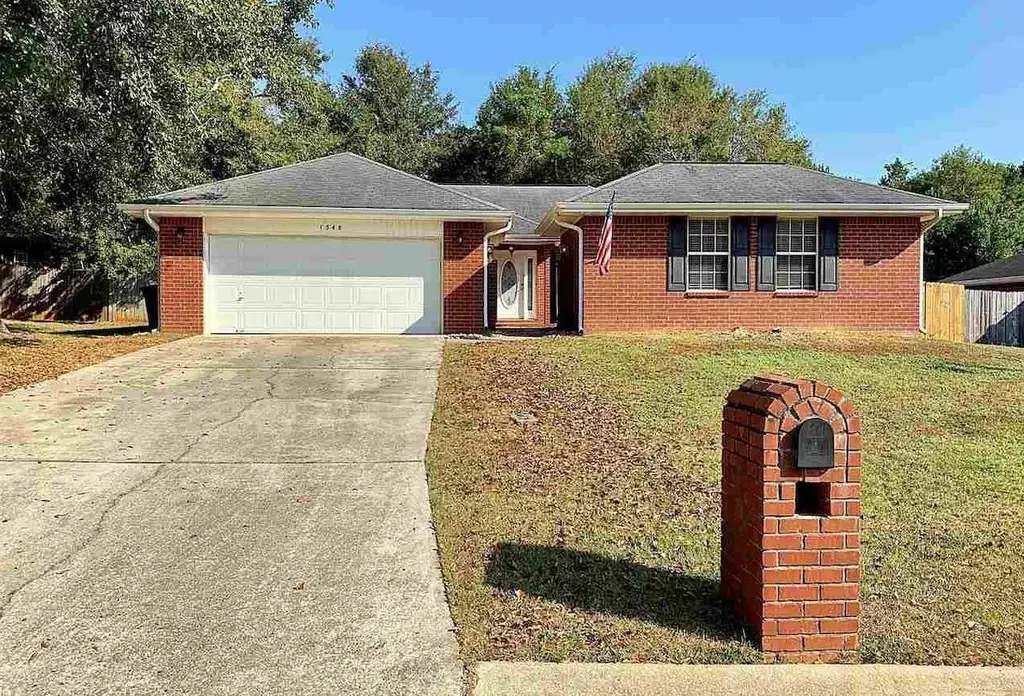
1548 Pelican Point Dr · Gonzalez, FL
Flood risk 1/10 · Minimal
- FEMA flood zone
- X (unshaded)
- Chance of flooding over 30 yrs
- 0.0%
- Est. flood insurance / yr
- $507 – $1,088
Fire risk 4/10 · Minor
- Est. fire insurance / yr
- $947 – $1,759
Heat risk 10/10 · Severe
- Hot days now (above 105°F)
- 7 days/yr
- Hot days in 30 yrs
- 23 days/yr
Wind risk 9/10 · Severe
- Chance of severe wind over 30 yrs
- 99.0%
Air-quality risk 1/10 · Minimal
- Unhealthy air days now
- 0 days/yr
- Unhealthy air days in 30 yrs
- 0 days/yr
Risk factors via First Street. Map © Google.
Why this score? — see what drove the C grade
The composite is a weighted blend of 9 inputs, each scored 0–100. Each bar is that input's sub-score; the figure is the points it added to the 100-point composite (weight × sub-score).
- Cash flow +20.4/30.0
- ARV discount +15.0/15.0
- DSCR +6.5/10.0
- 1% rule +5.8/10.0
- Schools +3.6/10.0
- Livability +3.6/5.0
- Rent growth +2.5/5.0
- Condition / age +2.5/5.0
- Appreciation +0.0/10.0
$218,000
🖨 Deal sheet (PDF) 📄 Offer letter ✓ Due diligence
Listing remarks
Under contract-accepting backup offers. Hard to find light handyman special in the most coveted corner of Eagle Ridge, next to the best schools in town. The owner’s surprise job relocation gifts you the rare chance to snatch up this hidden gem at below assessed value. Whether as your new forever home or a quick fix and flip, this is where your dreams come true. 1) Brand new roof in 2021. 2) New AC in 2018. 3) Lowest price per square foot in the area. 4) Attached in law suite with private entrance. 5) Large backyard with space for an inground pool, all surrounded by privacy fencing under mature landscaping for shade. 6) Gorgeous tile flooring throughout the spacious and sunny family ar
Key facts
- Brand new roof
- Privacy fencing
- Large backyard
Tags
Neighborhood map
What this means for you Summary
Snapshot
- This is a 4-bed/3.0-bath single-family listed at $218k.
Deal economics
- At list price, monthly cash flow is $284 ($3k/yr) — positive.
- The deal already cash-flows at list — no discount required.
- Meets the 1% rule at list price ($2k rent vs $218k).
- Recommended offer: $192k (12.0% below list) — sets the bar for market timing.
- Cap rate 7.9% vs local median 4.2% in Gonzalez — top-decile yield for the area; either an underpriced asset or a hidden risk that comps aren't pricing in. Stress-test before assuming the spread holds.
Location & tenants
- Location reads 71/100 on livability (#385 in FL) — a middle-class / working-renter tenant base. Strengths: cost of living A+, housing A+, employment A; Watch: amenities F, commute F, health & safety F.
- Escambia (suburban): math 40% / reading 45% proficiency, ranked #56 of 73 in FL (top 77%) — families likely to look elsewhere, expect single-tenant / working-renter base with shorter leases.
- Zoned schools: R. C. Lipscomb Elementary School (math 68% / reading 65%, grade B+, #473 of 2,144 statewide, top 23%, 764 students, 52% FRL); Ransom Middle School (math 54% / reading 52%, grade C+, #209 of 571 statewide, top 37%, 1,224 students, 49% FRL); J. M. Tate Senior High School (math 42% / reading 52%, grade D-, #207 of 667 statewide, top 32%, 2,110 students, 44% FRL).
- Zoned-school proficiency averages 56% at this address vs 42% district-wide (+13 pts) — the actual schools serving this property are materially stronger than the Escambia average implies; a family-tenant draw the district grade alone would hide.
- Market conditions: 511 active listings in the ZIP; 1 comparable units currently listed for rent nearby; solid renter incomes; 1,479 units permitted in Escambia County in 2024 (0 in 5+ unit buildings).
- This rent runs 33% of the median local income ($86k/yr) — at the standard rent-burdened threshold; future hikes will face affordability resistance.
Forward outlook
- Local home prices are declining (-3.0%/yr); year-one equity from $2k of loan paydown is wiped out by about $7k of value loss. Plan a longer hold.
- Escambia County population projected at +13% by 2050 — modest demand growth; plan on rents tracking national, not racing it.
Negotiation context
- It's been on market 138 days — a 12% lower offer ($192k) is reasonable based on typical stale-listing flexibility.
- 7 sale attempts since 24y ago; this cycle's ask has dropped $81k (27%) from the opening price — seller is motivated, your offer sets the floor, not the list.
Risks & watch-outs
- Climate carrying-cost: severe wind risk, 99% chance of damaging wind over 30y; extreme-heat days projected 7→23/yr by 2055 (HVAC capex compounding) — expect insurance premiums to compound above CPI over the hold.
Questions for the listing agent
- It's been on market 138 days. Have you received any prior offers? Is the seller open to a 12% concession, seller financing, or rate buy-down credit?
- What does the HOA fee cover, when was the last increase, and are there any pending special assessments or reserve-fund shortfalls?
- Why hasn't it sold? Are there any deal-killer items the seller is aware of (foundation, flood, title, zoning, code violations)?
- Is there a deadline driving the sale (1031 exchange, divorce, estate, relocation)? That informs how much negotiation room exists.
- What's the average days-on-market for RENTAL listings here right now (not sales)? A rising rental-DOM trend means longer vacancies and softer asking-rent achievability than the comps imply.
- What's the recent tenant-quality profile in this submarket — average credit score on applications, eviction rate, late-payment / NSF rate, and stable-employment percentage? A property-management company in the area should have these aggregated.
- How much new for-sale + rental construction is in the pipeline within 1–3 miles? Heavy new supply typically softens prices + rents 12–24 months out; constrained supply supports both.
Investment metrics
- 1% rule
- 1.08% ✓
- Cap rate
- 7.85%
- Cash-on-cash
- 5.57%
- DSCR
- 1.25
- GRM
- 7.7
CMA / ARV
- ARV (on-the-fly)
- $318,867
- Comps found
- 12
Show comp detail 12 sales within ~0.75 mi
| Address | Dist | Beds/Ba | Sqft | Sold | Price | $/sf | Match |
|---|---|---|---|---|---|---|---|
| 1763 Brentco Rd | 0.09mi | 4/2.0 | 2,164 (+6%) | 7mo | $320,000 | $148 | 75 |
| 1491 Longbranch Dr | 0.41mi | 4/2.0 | 2,028 (-0%) | 2mo | $325,000 | $160 | 74 |
| 1683 Condor Dr | 0.21mi | 4/3.0 | 2,250 (+11%) | 2mo | $319,000 | $142 | 71 |
| 1667 Condor Dr | 0.26mi | 4/2.0 | 1,951 (-4%) | 9mo | $295,000 | $151 | 70 |
| 2032 Hamilton Xing | 0.60mi | 4/2.0 | 2,024 (-0%) | 5mo | $317,500 | $157 | 63 |
| 1850 Kings Way Dr | 0.43mi | 3/2.0 (-1) | 1,972 (-3%) | 7mo | $301,000 | $153 | 60 |
| 1648 Condor Dr | 0.33mi | 4/2.0 | 2,285 (+12%) | 2mo | $322,500 | $141 | 58 |
| 2060 Hamilton Xing | 0.70mi | 4/2.0 | 2,075 (+2%) | 11mo | $340,000 | $164 | 50 |
| 1825 Peace Ter | 0.62mi | 4/2.0 | 1,845 (-9%) | 2mo | $359,900 | $195 | 50 |
| 2159 Liberty Loop Rd | 0.60mi | 3/2.0 (-1) | 2,185 (+8%) | 5mo | $314,000 | $144 | 46 |
| 443 Turnberry Rd | 0.74mi | 3/2.0 (-1) | 2,016 (-1%) | 12mo | $350,000 | $174 | 46 |
| 1831 Shady Creek Dr | 0.56mi | 3/2.0 (-1) | 1,856 (-9%) | 12mo | $340,000 | $183 | 40 |
Match score weights: distance 35% · size 25% · config 20% · recency 20%. Top-matched comps best support the ARV.
Projected returns pro-forma
-3.0% appreciation · 3.0% rent growth · sell at horizon
- IRR
- -7.6%
- Equity multiple
- 0.72×
- Total profit
- $-17,190
- Equity at exit
- $32,505
- IRR
- 2.0%
- Equity multiple
- 1.14×
- Total profit
- $8,598
- Equity at exit
- $18,849
Cash invested: $61,040 (down + closing). Projections, not guarantees.
Landlord ↔ Tenant lean methodology
- Overall (STATE)
- 87 Strongly Landlord-Friendly
- State Florida
- 87 Strongly Landlord-Friendly · R+3
- County
- — inherits STATE
- City
- — inherits STATE
ZIP-level market 32533
- Home prices YoY
- -14.6%
- Active inventory
- 511
- Price-to-rent
- 7.7×
Monthly cashflow live
- Estimated rent
- $2,353 medium interval (Pro) →
- Mortgage (P&I)
- −$1,143
- Tax from tax record
- −$326 /mo · $3,912/yr
- Insurance
- −$91
- HOA
- −$15
- Vacancy / Maint / Mgmt
- −$494
- Net cashflow
- $284
Break-even live
Sensitivity live
| Price | -10% $407 | -5% $345 | +0% $284 | +5% $222 | +10% $160 |
|---|---|---|---|---|---|
| Rent | -10% $98 | -5% $191 | +0% $284 | +5% $376 | +10% $469 |
| Rate | -1.0pp $393 | -0.5pp $339 | base $284 | +0.5pp $227 | +1.0pp $170 |
UW: 25.0% down · 7.5% · 30yr · 1.5% tax · 5.0% vac · 8.0% maint · 8.0% mgmt
Financing live
Cash to close
- Down payment
- $54,500
- Closing costs
- $6,540
- Reserves months
- —
- Total cash needed
- —
Loan-product check · same deal, 3 products live
Conventional
25% down · 7.5% · 30yr
- Down + closing
- —
- Monthly P&I
- —
- Monthly cashflow
- —
- DSCR
- —
- Eligible?
- —
Personal DTI + credit; lowest rate.
DSCR
20% down · 8.5% · 30yr
- Down + closing
- —
- Monthly P&I
- —
- Monthly cashflow
- —
- DSCR
- —
- Eligible?
- —
No personal income docs; deal must DSCR.
Hard money
10% down · 12.0% · 12mo
- Down + closing
- —
- Monthly P&I
- —
- Monthly cashflow
- —
- DSCR
- —
- Eligible?
- —
Short-term bridge; refi at stabilization.
Rent comps 1 comps
| Address | Beds | Baths | Sqft | Rent | $/sqft | DOM | Units | Dist |
|---|---|---|---|---|---|---|---|---|
| 404 Buxton Way Cantonment, FL | 4.0 | 3.0 | 2200 | $2,495 | $1.13 | 25d | 1 | 0.83mi |
HOA detail
- Monthly dues
- $15 · $180/yr
- Likely covers
- landscapingpool
Listing history 31 events
-
2026-04-22status Pending
-
2026-03-06price $218,000
-
2026-01-29price $219,000
-
2026-01-22price $229,000
-
2026-01-05price $249,000
-
2025-12-29price $259,000
-
2025-12-17price $269,000
-
2025-12-17price $179,000
-
2025-12-12price $279,000
-
2025-12-10price $288,000
-
2025-12-10price $339,000
-
2025-12-08price $289,000
-
2025-12-05$299,000 Active
-
2025-09-26historical
-
2025-09-02status Active
-
2025-08-31historical
-
2025-08-09$250,000 Active
-
2025-04-22historical
-
2025-03-28price $365,000
-
2025-03-12price $370,000
-
2025-02-27price $380,000
-
2025-01-09price $390,000
-
2024-11-21$400,000 Active
-
2020-04-02soldstatus $197,000
-
2020-03-31soldstatus $197,000
-
2019-10-02$210,000
-
2018-06-19soldstatus $183,000
-
2015-07-06soldstatus $151,309
-
2015-05-06$136,000
-
2002-12-12soldstatus $151,000
-
2002-05-20$151,750
ⓘ Source: listings_history table (triggers on properties + properties_extension) + one-shot
backfill from property_details.listing_events for pre-trigger history.
Tax reassessment forecast FL · Resets to sale price
- Current annual tax
- $3,912 · $326/mo
- Projected year-2 tax
- $3,912 · $326/mo
- Expected delta
- $0/yr ($0/mo · 0.0%)
ⓘ Screening estimate from a state-policy table — verify with the county assessor before closing.
Climate risk First Street
- Flood 1/10 Low FEMA zone X (unshaded) · 0% chance over 30 yrs
- Wildfire 4/10 Moderate
- Heat 10/10 Extreme 7 d/yr ≥105°F today · 23 d/yr by 30 yrs out
- Wind 9/10 Extreme 99% chance of damaging wind over 30 yrs
- Air quality 1/10 Low 0 unhealthy d/yr today · 0 by 30 yrs out
Nearby sold comps map
Loading sold comps map…
Walkable amenities ~0.75 mi
Loading nearby amenities…
Taxation est. · year 1
- Rental income
- $28,231
- − Mortgage interest
- −$12,211
- − Property taxes
- −$3,912
- − Insurance
- −$1,090
- − Repairs & maintenance
- −$2,259
- − Management
- −$2,259
- − HOA
- −$180
- − Depreciation
- −$6,342
- Taxable loss
- −$21
- Est. tax savings @ 24.0%
- +$5
- After-tax cash flow
- $3,407/yr
For passive investors: Depreciation is non-cash, so a rental often shows a tax loss while cash-flowing — sheltering income. Rental losses are passive: they offset passive income freely, and up to $25,000/yr can offset ordinary (W-2) income if you actively participate and your MAGI is under $100k (phasing out to $0 by $150k); unused losses carry forward. On sale, claimed depreciation is recaptured at up to 25%, and gains may owe capital-gains tax (a 1031 exchange can defer both). Figures are a year-1 estimate at your 24.0% rate — not tax advice; consult a CPA.
Schools (NCES district)
- District
- Escambia
- NCES district ID
- 1200510
- Math proficiency
- 40% ▼ -9.00%
- Reading proficiency
- 45% ▼ -4.00%
- Median HH income
- $44,649
- Composite
- 36.04/100
- National rank
- #4773
- State rank
- #56 of 73 in FL
Livability — Gonzalez
- Score
- 71/100
- State rank
- #385
- US rank
- #6813
Category grades
Schools grade is shown separately in the Schools card above.
Census & demographics
- Census place
- Gonzalez, FL
- County
- Escambia County · 301,722 people
- Metro
- Pensacola-Ferry Pass-Brent, FL
- Population (ZIP)
- 31,860
- Household income
- $86,087
- Rent vs Own
- Severe rent burden
- 389.0
Population outlook (Escambia County) Hauer SSP2
- Today (2025)
- 334,637 people
- By 2030
- 345,779 · +3.3%
- By 2040
- 364,828 · +9.0%
- By 2050
- 378,514 · +13.1%
- By 2075
- 403,220 · +20.5%
- By 2100
- 386,125 · +15.4%
Race, ethnicity, and origin ACS 2023
- Neighborhood character
- Predominantly White (74%)
- Race & ethnicity
- White 74% Black 12% Two or more races 8% Hispanic / Latino 4% Asian 3%
- Common ancestry
- Italian 2% Serbian 2% Lithuanian 2%
- Foreign-born
- 3% · Canada, Guatemala, China
- Languages at home
- 96% English-only · Spanish 2% Vietnamese 1%
Political lean MEDSL · Escambia
- 2024 margin
- R (+19.5) · D 39.7% · R 59.2% · Other 1.1%
- 2008→2024 swing
- -0.2pp no change · 2008: -19.3pp · 2024: -19.5pp
- All cycles
- 2024: R+19.5 2020: R+15.1 2016: R+20.6 2012: R+20.6 2008: R+19.3
Not yet ingested
- Civics
- —
Market trends
- HPI YoY
- ▼ -44.13%
- Current HPI
- 259.2605
- Rent YoY
- —
- Metro
- Pensacola-Ferry Pass-Brent, FL
- State GDP YoY
- ▲ 3.28%
- F500 in state
- 36
Industry mix (Fortune 500 HQ in FL)
| Industry | F500 HQs | Revenue |
|---|---|---|
| Industrial Technology | 2 | $29B |
|
||
| Insurance | 2 | $17B |
|
||
| Retail | 1 | $60B |
|
||
| Technology Distribution | 1 | $58B |
|
||
| Homebuilding | 1 | $35B |
|
||
| Technology Manufacturing | 1 | $35B |
|
||
Price history
+43.7% since first listed31 events — show timeline
- 2026-04-22 Pending — Stellar MLS as Distributed by MLS Grid
- 2026-03-06 Price Changed $218,000 Stellar MLS as Distributed by MLS Grid
- 2026-01-29 Price Changed $219,000 Stellar MLS as Distributed by MLS Grid
- 2026-01-22 Price Changed $229,000 Stellar MLS as Distributed by MLS Grid
- 2026-01-05 Price Changed $249,000 Stellar MLS as Distributed by MLS Grid
- 2025-12-29 Price Changed $259,000 Stellar MLS as Distributed by MLS Grid
- 2025-12-17 Price Changed $269,000 Stellar MLS as Distributed by MLS Grid
- 2025-12-17 Price Changed $179,000 Stellar MLS as Distributed by MLS Grid
- 2025-12-12 Price Changed $279,000 Stellar MLS as Distributed by MLS Grid
- 2025-12-10 Price Changed $288,000 Stellar MLS as Distributed by MLS Grid
- 2025-12-10 Price Changed $339,000 Stellar MLS as Distributed by MLS Grid
- 2025-12-08 Price Changed $289,000 Stellar MLS as Distributed by MLS Grid
- 2025-12-05 Listed $299,000 Stellar MLS as Distributed by MLS Grid
- 2025-09-26 Listing Removed — PARMLS
- 2025-09-02 Relisted — PARMLS
- 2025-08-31 Listing Removed — PARMLS
- 2025-08-09 Listed $250,000 PARMLS
- 2025-04-22 Listing Removed — PARMLS
- 2025-03-28 Price Changed $365,000 PARMLS
- 2025-03-12 Price Changed $370,000 PARMLS
- 2025-02-27 Price Changed $380,000 PARMLS
- 2025-01-09 Price Changed $390,000 PARMLS
- 2024-11-21 Listed $400,000 PARMLS
- 2020-04-02 Sold (Public Records) $197,000 Public Records
- 2020-03-31 Sold (MLS) $197,000 PARMLS
- 2019-10-02 Listed $210,000 PARMLS
- 2018-06-19 Sold (Public Records) $183,000 Public Records
- 2015-07-06 Sold (MLS) $151,309 PARMLS
- 2015-05-06 Listed $136,000 PARMLS
- 2002-12-12 Sold (MLS) $151,000 PARMLS
- 2002-05-20 Listed $151,750 PARMLS
Property tax history
+6.5%/yrLatest (2025): $3,912 · +12.4% YoY. Source: county tax records.
Cash-flow waterfall
monthlySold comps — $/sqft
last 12 mo · ≤1 miLoading sold comps…