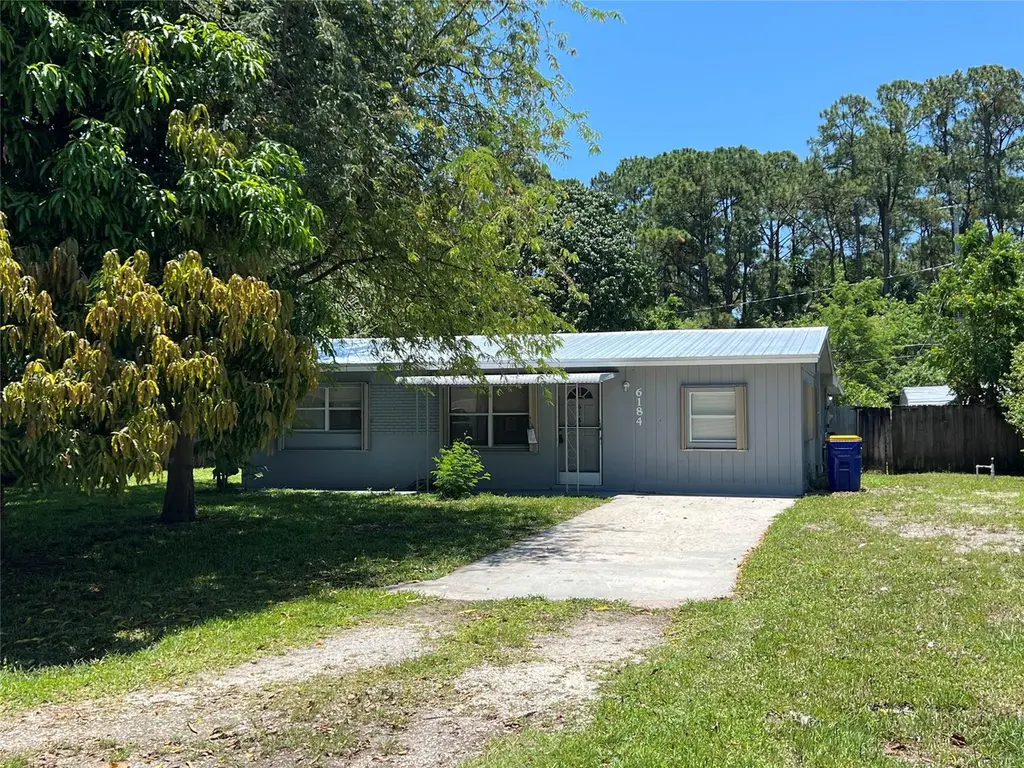
6184 SE Orange Blossom Trl · Hobe Sound, FL
Flood risk 4/10 · Minor
- FEMA flood zone
- X (unshaded)
- Chance of flooding over 30 yrs
- 0.22%
- Est. flood insurance / yr
- $507 – $1,088
Fire risk 3/10 · Minor
- Est. fire insurance / yr
- $947 – $1,759
Heat risk 10/10 · Severe
- Hot days now (above 106°F)
- 7 days/yr
- Hot days in 30 yrs
- 24 days/yr
Wind risk 10/10 · Severe
- Chance of severe wind over 30 yrs
- 99.0%
Air-quality risk 2/10 · Minimal
- Unhealthy air days now
- 1 days/yr
- Unhealthy air days in 30 yrs
- 1 days/yr
Risk factors via First Street. Map © Google.
Why this score? — see what drove the D grade
The composite is a weighted blend of 9 inputs, each scored 0–100. Each bar is that input's sub-score; the figure is the points it added to the 100-point composite (weight × sub-score).
- ARV discount +15.0/15.0
- Cash flow +8.1/30.0
- Schools +4.5/10.0
- Livability +3.5/5.0
- Rent growth +3.0/5.0
- Condition / age +2.5/5.0
- 1% rule +2.4/10.0
- DSCR +2.2/10.0
- Appreciation +0.0/10.0
$357,700
🖨 Deal sheet 📄 Offer letter ✓ Due diligence
Listing remarks MLS
JUST REDUCED!! THIS 4/2 SPACIOUS HOME IN POINCIANA GARDENS COMMUNITY LOCATED IN HOBE SOUND, FL. NO HOA, NEW ROOF, TILE THROUGHOUT, SPACIOUS BACKYARD WITH STOARGE SHED AND PLENTY OF PARKING FOR YOUR RV'S AND BOATS. SELLER HAS NO DISCLOSURE OR HAS NEVER OCCUPIED THIS PROPERTY. SEE ATTACHED SELLERS ADDENDUM.
Key facts
- Spacious backyard
- Plenty of parking
- Storage shed
Tags
Neighborhood map
What this means for you Summary
Snapshot
- This is a 2-bed/1.0-bath single-family listed at $358k.
Deal economics
- At list price, monthly cash flow is $-344 ($-4k/yr) — negative.
- To cash-flow at today's rent, offer at most $297k (17.0% below list).
- To meet the 1% rule (rent ≥ 1% of price), the offer needs to be $264k (26.2% below list).
- Recommended offer: $264k (26.2% below list) — sets the bar for 1% rule.
- Cap rate 5.1% vs local median 3.5% in Hobe Sound — top-decile yield for the area; either an underpriced asset or a hidden risk that comps aren't pricing in. Stress-test before assuming the spread holds.
Location & tenants
- Location reads 69/100 on livability (#497 in FL) — a middle-class / working-renter tenant base. Strengths: housing A+, crime A, cost of living A; Watch: employment C-, amenities F, commute F.
- Martin (suburban): math 52% / reading 53% proficiency, ranked #24 of 73 in FL (top 33%) — acceptable for families but not a draw, mixed tenant base, ~2y average lease.
- Market conditions: Rents rising (+1.8%/yr); 279 active listings in the ZIP; 19 comparable units currently listed for rent nearby; rentals at typical pace (median 24d on market — plan ~3-4 weeks tenant-placement turnaround); 737 units permitted in Martin County in 2024 (167 in 5+ unit buildings).
- At $2,642/mo this rent would consume 45% of the median local household income ($70k/yr) (locally 317% of renters already pay >50% of income on rent) — very limited rent-growth headroom before tenants either downsize or default.
Forward outlook
- Local home prices are declining (-3.0%/yr); year-one equity from $2k of loan paydown is wiped out by about $11k of value loss. Plan a longer hold.
- Martin County population projected at +19% by 2050 — long-run rental-demand tailwind backs the buy-and-hold thesis.
Negotiation context
- It's been on market 92 days — a 9% lower offer ($326k) is reasonable based on typical stale-listing flexibility.
- 3 sale attempts since 2y ago; this cycle's ask is 12675% above the opening price — seller raised mid-cycle; expect resistance to lowballs.
Risks & watch-outs
- Watch-outs: built in 1959 — expect roof / HVAC / electrical / plumbing capex.
- Climate carrying-cost: severe wind risk, 99% chance of damaging wind over 30y; extreme-heat days projected 7→24/yr by 2055 (HVAC capex compounding) — expect insurance premiums to compound above CPI over the hold.
Questions for the listing agent
- What do current leases actually rent for vs. the listed asking? Can we see a recent rent roll and the last 12 months of T-12 income?
- It's been on market 92 days. Have you received any prior offers? Is the seller open to a 26% concession, seller financing, or rate buy-down credit?
- Built in 1959 — when were the roof, HVAC, electrical panel, plumbing, and water heater last replaced?
- Why hasn't it sold? Are there any deal-killer items the seller is aware of (foundation, flood, title, zoning, code violations)?
- Is there a deadline driving the sale (1031 exchange, divorce, estate, relocation)? That informs how much negotiation room exists.
- The area grade is low — what's the realistic commute time and amenity access for the typical tenant pool here? Any planned neighborhood developments (good or bad) we should know about?
- What's the average days-on-market for RENTAL listings here right now (not sales)? A rising rental-DOM trend means longer vacancies and softer asking-rent achievability than the comps imply.
- What's the recent tenant-quality profile in this submarket — average credit score on applications, eviction rate, late-payment / NSF rate, and stable-employment percentage? A property-management company in the area should have these aggregated.
- How much new for-sale + rental construction is in the pipeline within 1–3 miles? Heavy new supply typically softens prices + rents 12–24 months out; constrained supply supports both.
Investment metrics
- 1% rule
- 0.74% ✗
- Cap rate
- 5.14%
- Cash-on-cash
- -4.12%
- DSCR
- 0.82
- GRM
- 11.3
CMA / ARV
- ARV (median comp)
- $434,442
- List price
- $357,700
- Delta
- -17.66%
- Verdict
- UNDERPRICED
- Comps
- 20 within 1.0 mi
Show comp detail 12 sales within ~0.75 mi
| Address | Dist | Beds/Ba | Sqft | Sold | Price | $/sf | Match |
|---|---|---|---|---|---|---|---|
| 8333 SE Princess Tree Ave | 0.27mi | 3/2.0 (+1) | 1,200 (-5%) | 3mo | $529,750 | $441 | 68 |
| 8379 SE Camellia Dr | 0.38mi | 3/2.0 (+1) | 1,297 (+3%) | 4mo | $405,000 | $312 | 65 |
| 6144 SE Orange Blossom Trl | 0.04mi | 3/1.0 (+1) | 1,131 (-10%) | 16mo | $428,500 | $379 | 63 |
| 6456 SE Circle St | 0.33mi | 3/2.0 (+1) | 1,290 (+2%) | 16mo | $335,000 | $260 | 59 |
| 6045 SE Circle St | 0.30mi | 3/2.0 (+1) | 1,332 (+6%) | 18mo | $448,000 | $336 | 52 |
| 5803 SE Orange Blossom Trl | 0.33mi | 3/2.0 (+1) | 1,156 (-8%) | 13mo | $465,000 | $402 | 51 |
| 6236 SE Monticello Ter Unit 7-c | 0.56mi | 2/2.0 | 1,128 (-11%) | 3mo | $275,000 | $244 | 50 |
| 6236 SE Monticello Ter | 0.56mi | 2/2.0 | 1,128 (-11%) | 3mo | $275,000 | $244 | 50 |
| 8745 SE Longview Dr | 0.64mi | 3/2.0 (+1) | 1,312 (+4%) | 9mo | $469,500 | $358 | 47 |
| 6214 SE Monticello Ter | 0.59mi | 2/2.0 | 1,128 (-11%) | 6mo | $325,000 | $288 | 46 |
| 6292 SE Monticello Ter | 0.54mi | 2/2.0 | 1,128 (-11%) | 16mo | $260,000 | $230 | 40 |
| 5886 SE Circle St | 0.49mi | 2/2.0 | 1,440 (+14%) | 18mo | $620,000 | $431 | 35 |
Match score weights: distance 35% · size 25% · config 20% · recency 20%. Top-matched comps best support the ARV.
Projected returns pro-forma
-3.0% appreciation · 1.8% rent growth · sell at horizon
- IRR
- -24.6%
- Equity multiple
- 0.17×
- Total profit
- $-82,996
- Equity at exit
- $53,334
- IRR
- -23.9%
- Equity multiple
- -0.13×
- Total profit
- $-113,033
- Equity at exit
- $30,927
Cash invested: $100,156 (down + closing). Projections, not guarantees.
Landlord ↔ Tenant lean methodology
- Overall (STATE)
- 87 Strongly Landlord-Friendly
- State Florida
- 87 Strongly Landlord-Friendly · R+3
- County
- — inherits STATE
- City
- — inherits STATE
ZIP-level market 33455
- Rents YoY
- 1.8%
- Active inventory
- 279
- Price-to-rent
- 11.3×
Monthly cashflow live
- Estimated rent
- $2,642 high interval (Pro) →
- Mortgage (P&I)
- −$1,876
- Tax from tax record
- −$406 /mo · $4,869/yr
- Insurance
- −$149
- HOA
- −$0
- Vacancy / Maint / Mgmt
- −$555
- Net cashflow
- $-344
Break-even live
UW: 25.0% down · 7.5% · 30yr · 1.5% tax · 5.0% vac · 8.0% maint · 8.0% mgmt
Financing live
Cash to close
- Down payment
- $89,425
- Closing costs
- $10,731
- Reserves months
- —
- Total cash needed
- —
Loan-product check · same deal, 3 products live
Conventional
25% down · 7.5% · 30yr
- Down + closing
- —
- Monthly P&I
- —
- Monthly cashflow
- —
- DSCR
- —
- Eligible?
- —
Personal DTI + credit; lowest rate.
DSCR
20% down · 8.5% · 30yr
- Down + closing
- —
- Monthly P&I
- —
- Monthly cashflow
- —
- DSCR
- —
- Eligible?
- —
No personal income docs; deal must DSCR.
Hard money
10% down · 12.0% · 12mo
- Down + closing
- —
- Monthly P&I
- —
- Monthly cashflow
- —
- DSCR
- —
- Eligible?
- —
Short-term bridge; refi at stabilization.
Rent comps 19 comps
| Address | Beds | Baths | Sqft | Rent | $/sqft | DOM | Units | Dist |
|---|---|---|---|---|---|---|---|---|
| 8350 SE Sweetbay Dr Hobe Sound, FL | 2.0 | 2.0 | 1606 | $3,500 | $2.18 | 23d | 1 | 0.21mi |
| 6024 SE Crooked Oak Ave Hobe Sound, FL | 3.0 | 2.0 | 1800 | $3,200 | $1.78 | 23d | 1 | 0.49mi |
| 7894 SE Saratoga Dr Hobe Sound, FL | 2.0 | 2.0 | 1248 | $2,100 | $1.68 | 23d | 1 | 0.51mi |
| 7462 SE Jamestown Ter Hobe Sound, FL | 2.0 | 2.0 | 1384 | $2,500 | $1.81 | 23d | 1 | 0.68mi |
| 7442 SE Jamestown Ter Hobe Sound, FL | 2.0 | 2.0 | 1384 | $1,800 | $1.30 | 23d | 1 | 0.71mi |
| 7030 SE Ridgeway Ter Hobe Sound, FL | 3.0 | 2.0 | 1296 | $2,500 | $1.93 | 23d | 1 | 0.74mi |
| 7568 SE Swan Ave Hobe Sound, FL | 2.0 | 2.0 | 1052 | $2,300 | $2.19 | 23d | 1 | 0.76mi |
| 6215 SE Georgetown Pl Hobe Sound, FL | 2.0 | 2.0 | 1202 | $2,600 | $2.16 | 23d | 1 | 0.80mi |
| 7445 SE Independence Ave Hobe Sound, FL | 2.0 | 2.0 | 1198 | $1,900 | $1.59 | 23d | 1 | 0.83mi |
| 8002 SE Skylark Ave Hobe Sound, FL | 3.0 | 2.0 | 990 | $2,000 | $2.02 | 23d | 1 | 0.88mi |
| 6845 SE Bunker Hill Dr Hobe Sound, FL | 2.0 | 2.0 | 1552 | $3,500 | $2.26 | 14d | 1 | 1.06mi |
| 7607 SE Hobe Ter Hobe Sound, FL | 2.0 | 2.0 | 1156 | $2,200 | $1.90 | 14d | 1 | 1.19mi |
| 8905 SE Sandy Ln Hobe Sound, FL | 2.0 | 2.0 | 1006 | $1,850 | $1.84 | 23d | 1 | 1.34mi |
| 5064 SE Mariner Garden Cir Stuart, FL | 3.0 | 2.5 | 1530 | $2,400 | $1.57 | 23d | 1 | 1.37mi |
| 8997 SE Sandy Ln Hobe Sound, FL | 2.0 | 1.0 | 900 | $2,000 | $2.22 | 23d | 1 | 1.39mi |
| 5156 SE Mariner Garden Cir Stuart, FL | 3.0 | 2.5 | 1434 | $2,400 | $1.67 | 23d | 1 | 1.43mi |
| 5176 SE Mariner Garden Cir Stuart, FL | 3.0 | 2.5 | 1554 | $2,400 | $1.54 | 23d | 1 | 1.44mi |
| 4987 SE Mariner Garden Cir Stuart, FL | 3.0 | 2.5 | 1434 | $2,650 | $1.85 | 23d | 1 | 1.44mi |
| 9073 SE Hobe Ridge Ave Hobe Sound, FL | 2.0 | 2.0 | 1029 | $2,100 | $2.04 | 14d | 1 | 1.48mi |
Listing history 15 events
-
2026-06-18days on market $357,700 Active 92 DOM
-
2026-06-17days on market $357,700 Active 91 DOM
-
2026-06-09days on market $357,700 Active 90 DOM
-
2026-06-08days on market $357,700 Active 89 DOM
-
2026-06-07days on market $357,700 Active 88 DOM
-
2026-06-03days on market $357,700 Active 84 DOM
-
2026-06-02days on market $357,700 Active 83 DOM
-
2026-06-01days on market $357,700 Active 82 DOM
-
2026-05-31days on market $357,700 Active 81 DOM
-
2026-05-31days on market $357,700 Active 80 DOM
-
2026-04-13price $357,700 307-char remark
Show marketing remark (307 chars)
JUST REDUCED!! THIS 4/2 SPACIOUS HOME IN POINCIANA GARDENS COMMUNITY LOCATED IN HOBE SOUND, FL. NO HOA, NEW ROOF, TILE THROUGHOUT, SPACIOUS BACKYARD WITH STOARGE SHED AND PLENTY OF PARKING FOR YOUR RV'S AND BOATS. SELLER HAS NO DISCLOSURE OR HAS NEVER OCCUPIED THIS PROPERTY. SEE ATTACHED SELLERS ADDENDUM.
-
2026-03-28$2,800
-
2025-10-30$374,900 Active 307-char remark
Show marketing remark (307 chars)
JUST REDUCED!! THIS 4/2 SPACIOUS HOME IN POINCIANA GARDENS COMMUNITY LOCATED IN HOBE SOUND, FL. NO HOA, NEW ROOF, TILE THROUGHOUT, SPACIOUS BACKYARD WITH STOARGE SHED AND PLENTY OF PARKING FOR YOUR RV'S AND BOATS. SELLER HAS NO DISCLOSURE OR HAS NEVER OCCUPIED THIS PROPERTY. SEE ATTACHED SELLERS ADDENDUM.
-
2024-06-14historical $2,999
-
2024-05-31$2,999
ⓘ Source: listings_history table (triggers on properties + properties_extension) + one-shot
backfill from property_details.listing_events for pre-trigger history.
Tax reassessment forecast FL · Resets to sale price
- Current annual tax
- $4,869 · $406/mo
- Projected year-2 tax
- $4,869 · $406/mo
- Expected delta
- $0/yr ($0/mo · 0.0%)
ⓘ Screening estimate from a state-policy table — verify with the county assessor before closing.
Climate risk First Street
- Flood 4/10 Moderate FEMA zone X (unshaded) · 22% chance over 30 yrs
- Wildfire 3/10 Moderate
- Heat 10/10 Extreme 7 d/yr ≥106°F today · 24 d/yr by 30 yrs out
- Wind 10/10 Extreme 99% chance of damaging wind over 30 yrs
- Air quality 2/10 Low 1 unhealthy d/yr today · 1 by 30 yrs out
Nearby sold comps map
Loading sold comps map…
Walkable amenities ~0.75 mi
Loading nearby amenities…
Taxation est. · year 1
- Rental income
- $31,699
- − Mortgage interest
- −$20,037
- − Property taxes
- −$4,869
- − Insurance
- −$1,788
- − Repairs & maintenance
- −$2,536
- − Management
- −$2,536
- − Depreciation
- −$10,406
- Taxable loss
- −$10,473
- Est. tax savings @ 24.0%
- +$2,514
- After-tax cash flow
- $-1,612/yr
For passive investors: Depreciation is non-cash, so a rental often shows a tax loss while cash-flowing — sheltering income. Rental losses are passive: they offset passive income freely, and up to $25,000/yr can offset ordinary (W-2) income if you actively participate and your MAGI is under $100k (phasing out to $0 by $150k); unused losses carry forward. On sale, claimed depreciation is recaptured at up to 25%, and gains may owe capital-gains tax (a 1031 exchange can defer both). Figures are a year-1 estimate at your 24.0% rate — not tax advice; consult a CPA.
Schools (NCES district)
- District
- Martin
- NCES district ID
- 1201290
- Math proficiency
- 52% ▼ -14.00%
- Reading proficiency
- 53% ▼ -4.00%
- Median HH income
- $52,482
- Composite
- 45.1/100
- National rank
- #2690
- State rank
- #24 of 73 in FL
Livability — Hobe Sound
- Score
- 69/100
- State rank
- #497
- US rank
- #8763
Category grades
Schools grade is shown separately in the Schools card above.
Census & demographics
- County
- Martin County · 165,223 people
- City population
- 20,018
- Metro
- Port St. Lucie, FL
- Population (ZIP)
- 20,018
- Household income
- $70,389
- Rent vs Own
- Severe rent burden
- 317.0
Population outlook (Martin County) Hauer SSP2
- Today (2025)
- 172,383 people
- By 2030
- 180,192 · +4.5%
- By 2040
- 194,114 · +12.6%
- By 2050
- 204,992 · +18.9%
- By 2075
- 229,641 · +33.2%
- By 2100
- 232,146 · +34.7%
Race, ethnicity, and origin ACS 2023
- Neighborhood character
- Predominantly White (84%)
- Race & ethnicity
- White 84% Hispanic / Latino 8% Two or more races 6% Black 5% Asian 1%
- Hispanic origin (detail)
- Mexican 3% Dominican 1%
- Common ancestry
- Romanian 5% Italian 2% Slovak 2%
- Foreign-born
- 8% · Canada
- Languages at home
- 91% English-only · Spanish 6% Other Indo-European 1%
Political lean MEDSL · Martin
- 2024 margin
- Solid R (+31.1) · D 34.1% · R 65.2%
- 2008→2024 swing
- -17.5pp toward R · 2008: -13.6pp · 2024: -31.1pp
- All cycles
- 2024: R+31.1 2020: R+24.6 2016: R+26.9 2012: R+22.9 2008: R+13.6
Not yet ingested
- Civics
- —
Market trends
- HPI YoY
- ▼ -287.05%
- Current HPI
- 356.7273
- Rent YoY
- ▲ 1.80%
- Metro
- Port St. Lucie, FL
- State GDP YoY
- ▲ 3.28%
- F500 in state
- 36
Industry mix (Fortune 500 HQ in FL)
| Industry | F500 HQs | Revenue |
|---|---|---|
| Industrial Technology | 2 | $29B |
|
||
| Insurance | 2 | $17B |
|
||
| Retail | 1 | $60B |
|
||
| Technology Distribution | 1 | $58B |
|
||
| Homebuilding | 1 | $35B |
|
||
| Technology Manufacturing | 1 | $35B |
|
||
Price history
+11827.3% since first listed5 events — show timeline
- 2026-04-13 Price Changed $357,700 Beaches MLS
- 2026-03-28 Listed for Rent $2,800 RMLSFL
- 2025-10-30 Listed $374,900 Beaches MLS
- 2024-06-14 Rental Removed $2,999 GFLMLS
- 2024-05-31 Listed for Rent $2,999 GFLMLS
Property tax history
+28.9%/yrLatest (2025): $4,869 · +995.0% YoY. Source: county tax records.
Cash-flow waterfall
monthlySold comps — $/sqft
last 12 mo · ≤1 miLoading sold comps…