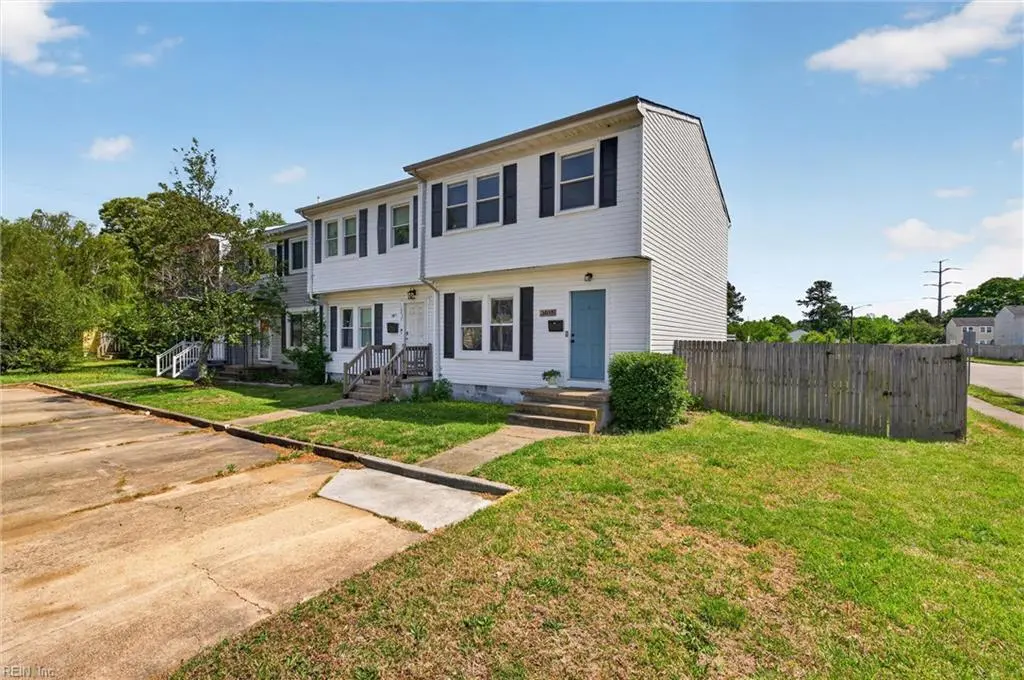
3017 Herrmann Ct · Virginia Beach, VA
Flood risk 3/10 · Minor
- FEMA flood zone
- X (shaded)
- Chance of flooding over 30 yrs
- 0.12%
- Est. flood insurance / yr
- $507 – $1,088
Fire risk 1/10 · Minimal
- Est. fire insurance / yr
- $666 – $1,236
Heat risk 9/10 · Severe
- Hot days now (above 105°F)
- 7 days/yr
- Hot days in 30 yrs
- 17 days/yr
Wind risk 8/10 · Major
- Chance of severe wind over 30 yrs
- 99.0%
Air-quality risk 3/10 · Minor
- Unhealthy air days now
- 2 days/yr
- Unhealthy air days in 30 yrs
- 4 days/yr
Risk factors via First Street. Map © Google.
Why this score? — see what drove the D- grade
The composite is a weighted blend of 9 inputs, each scored 0–100. Each bar is that input's sub-score; the figure is the points it added to the 100-point composite (weight × sub-score).
- Cash flow +10.1/30.0
- Schools +6.4/10.0
- Rent growth +4.9/5.0
- ARV discount +4.7/15.0
- Livability +4.2/5.0
- DSCR +2.9/10.0
- Condition / age +2.5/5.0
- 1% rule +2.4/10.0
- Appreciation +0.0/10.0
$284,500
🖨 Deal sheet 📄 Offer letter ✓ Due diligence
Listing remarks
Updated, end-unit townhome in the heart of Virginia Beach!! Beautifully remodeled kitchen with white cabinetry, SS appliances and a breakfast area!! Oversized, fenced in back yard and a super convenient location to shopping, dining, bases and all things Virginia Beach!! Ready to move right in!!! See this one today before it is SOLD!!!
Key facts
- End-unit townhome
- Remodeled kitchen
- Fenced in back yard
Tags
Property features AI
Finance
- HOA & community: Member of Magic Hollow Community Association; HOA fee $22 monthly
Exterior
- Parking: Driveway with 2 parking spaces
- Utilities: City/County water; City/County sewer; Electric water heater; Electric power
- Home design: Attached townhouse; 2 stories; Crawl foundation; Simple ownership
- Construction: Vinyl exterior siding; Crawlspace foundation; Asphalt shingle roof
- Exterior features: Corner lot; Back yard with wood fence; Vinyl siding; Asphalt shingle roof
Interior
- Kitchen: Dishwasher; Electric range; Microwave; Refrigerator
- Bedrooms: One bedroom has an ensuite
- Flooring: Carpet; Laminate
- Bathrooms: One full bathroom; Two half bathrooms
- Heating & cooling: Heat pump for heating and cooling; Electric heating; Programmable thermostat
- Interior features: Ceiling fan; Breakfast area; Master bedroom with bath; Utility closet
- Laundry & utility: Washer; Dryer
Neighborhood map
What this means for you Summary
Snapshot
- This is a 3-bed/2.0-bath townhouse listed at $284k.
Deal economics
- At list price, monthly cash flow is $-164 ($-2k/yr) — negative.
- To cash-flow at today's rent, offer at most $256k (10.2% below list).
- To meet the 1% rule (rent ≥ 1% of price), the offer needs to be $211k (26.0% below list).
- Recommended offer: $211k (26.0% below list) — sets the bar for 1% rule.
- Cap rate 5.6% vs local median 3.5% in Virginia Beach — top-decile yield for the area; either an underpriced asset or a hidden risk that comps aren't pricing in. Stress-test before assuming the spread holds.
Location & tenants
- Location reads 83/100 on livability (#38 in VA, #880 nationally) — a professional / high-income tenant draw. Strengths: amenities A+, employment A+, housing A+; Watch: cost of living C-, commute F.
- Va Beach City Public School District (urban): math 69% / reading 78% proficiency, ranked #10 of 131 in VA (top 8%) — strong family-tenant draw, lease renewals of 3-5y typical.
- Zoned schools: Brookwood Elementary (math 56% / reading 68%, grade B, #480 of 1,108 statewide, top 46%, 571 students, 66% FRL); Ocean Lakes High (math 73% / reading 89%, grade A, #52 of 319 statewide, top 17%, 1,855 students, 29% FRL) — zoned schools average 48% FRL vs 28% district-wide (19 pts higher); higher-poverty schools than district average — tighter screening recommended.
- Market conditions: Rents rising fast (+9.7%/yr); 99 active listings in the ZIP; 20 comparable units currently listed for rent nearby; rentals at typical pace (median 24d on market — plan ~3-4 weeks tenant-placement turnaround); solid renter incomes; 666 units permitted in Virginia Beach city in 2024 (347 in 5+ unit buildings).
Forward outlook
- Local home prices are declining (-3.0%/yr); year-one equity from $2k of loan paydown is wiped out by about $9k of value loss. Plan a longer hold.
- Virginia Beach County population projected at +6% by 2050 — modest demand growth; plan on rents tracking national, not racing it.
Negotiation context
- It's been on market 62 days — a 6% lower offer ($267k) is reasonable based on typical stale-listing flexibility.
- 4 sale attempts since 4y ago with the ask held roughly flat each time — persistent listings suggest the price (not the market) is what's stuck; bring a comps-based counter.
Risks & watch-outs
- Climate carrying-cost: severe wind risk, 99% chance of damaging wind over 30y; extreme-heat days projected 7→17/yr by 2055 (HVAC capex compounding) — expect insurance premiums to compound above CPI over the hold.
Questions for the listing agent
- What do current leases actually rent for vs. the listed asking? Can we see a recent rent roll and the last 12 months of T-12 income?
- It's been on market 62 days. Have you received any prior offers? Is the seller open to a 26% concession, seller financing, or rate buy-down credit?
- Built in 1973 — when were the roof, HVAC, electrical panel, plumbing, and water heater last replaced?
- What does the HOA fee cover, when was the last increase, and are there any pending special assessments or reserve-fund shortfalls?
- Why hasn't it sold? Are there any deal-killer items the seller is aware of (foundation, flood, title, zoning, code violations)?
- Is there a deadline driving the sale (1031 exchange, divorce, estate, relocation)? That informs how much negotiation room exists.
- Schools are A-rated — typically a magnet for longer-tenancy family renters. What's the average tenant stay here, and is there a school-zone premium baked into asking?
- The area grade is low — what's the realistic commute time and amenity access for the typical tenant pool here? Any planned neighborhood developments (good or bad) we should know about?
- What's the average days-on-market for RENTAL listings here right now (not sales)? A rising rental-DOM trend means longer vacancies and softer asking-rent achievability than the comps imply.
- What's the recent tenant-quality profile in this submarket — average credit score on applications, eviction rate, late-payment / NSF rate, and stable-employment percentage? A property-management company in the area should have these aggregated.
- How much new for-sale + rental construction is in the pipeline within 1–3 miles? Heavy new supply typically softens prices + rents 12–24 months out; constrained supply supports both.
Investment metrics
- 1% rule
- 0.74% ✗
- Cap rate
- 5.60%
- Cash-on-cash
- -2.47%
- DSCR
- 0.89
- GRM
- 11.3
CMA / ARV
- ARV (on-the-fly)
- $267,840
- Comps found
- 12
Show comp detail 12 sales within ~0.75 mi
| Address | Dist | Beds/Ba | Sqft | Sold | Price | $/sf | Match |
|---|---|---|---|---|---|---|---|
| 1010 Scarborough Ct | 0.34mi | 3/1.5 | 1,250 (+1%) | 1mo | $235,000 | $188 | 80 |
| 3218 Scarborough Way | 0.36mi | 3/1.5 | 1,258 (+2%) | 2mo | $245,000 | $195 | 77 |
| 959 S Club House Rd | 0.45mi | 3/1.5 | 1,276 (+3%) | 2mo | $244,000 | $191 | 70 |
| 3176 Ashaway Rd | 0.60mi | 3/2.0 | 1,256 (+1%) | 1mo | $345,000 | $275 | 69 |
| 965 Clubhouse Rd S | 0.44mi | 3/1.5 | 1,320 (+6%) | 2mo | $250,000 | $189 | 65 |
| 3070 Breslaw Ct | 0.09mi | 4/2.5 (+1) | 1,408 (+14%) | 2mo | $243,000 | $173 | 65 |
| 3152 Ashaway Rd | 0.52mi | 3/2.0 | 1,356 (+9%) | 2mo | $342,000 | $252 | 58 |
| 1137 Old Clubhouse Rd | 0.42mi | 2/1.5 (-1) | 1,124 (-9%) | 3mo | $220,000 | $196 | 55 |
| 3234 Creekside Dr | 0.42mi | 2/2.0 (-1) | 1,080 (-13%) | 1mo | $260,000 | $241 | 53 |
| 3300 Waterman Rd | 0.63mi | 3/2.0 | 1,368 (+10%) | 2mo | $340,000 | $249 | 52 |
| 3320 Waterman Rd | 0.67mi | 3/2.0 | 1,386 (+12%) | 3mo | $329,500 | $238 | 46 |
| 3244 Yorkborough Way | 0.70mi | 3/2.5 | 1,386 (+12%) | 0mo | $300,000 | $216 | 46 |
Match score weights: distance 35% · size 25% · config 20% · recency 20%. Top-matched comps best support the ARV.
Projected returns pro-forma
-3.0% appreciation · 8.0% rent growth · sell at horizon
- IRR
- -15.4%
- Equity multiple
- 0.43×
- Total profit
- $-45,470
- Equity at exit
- $42,420
- IRR
- -0.4%
- Equity multiple
- 0.97×
- Total profit
- $-2,601
- Equity at exit
- $24,598
Cash invested: $79,660 (down + closing). Projections, not guarantees.
Landlord ↔ Tenant lean methodology
- Overall (STATE)
- 55 Moderately Landlord-Leaning
- State Virginia
- 55 Moderately Landlord-Leaning · D+2
- County
- — inherits STATE
- City
- — inherits STATE
ZIP-level market 23453
- Home prices YoY
- -13.4%
- Rents YoY
- 9.7%
- Active inventory
- 99
- Price-to-rent
- 11.3×
Monthly cashflow live
- Estimated rent
- $2,106 high interval (Pro) →
- Mortgage (P&I)
- −$1,492
- Tax from tax record
- −$195 /mo · $2,344/yr
- Insurance
- −$119
- HOA
- −$22
- Vacancy / Maint / Mgmt
- −$442
- Net cashflow
- $-164
Break-even live
UW: 25.0% down · 7.5% · 30yr · 1.5% tax · 5.0% vac · 8.0% maint · 8.0% mgmt
Financing live
Cash to close
- Down payment
- $71,125
- Closing costs
- $8,535
- Reserves months
- —
- Total cash needed
- —
Loan-product check · same deal, 3 products live
Conventional
25% down · 7.5% · 30yr
- Down + closing
- —
- Monthly P&I
- —
- Monthly cashflow
- —
- DSCR
- —
- Eligible?
- —
Personal DTI + credit; lowest rate.
DSCR
20% down · 8.5% · 30yr
- Down + closing
- —
- Monthly P&I
- —
- Monthly cashflow
- —
- DSCR
- —
- Eligible?
- —
No personal income docs; deal must DSCR.
Hard money
10% down · 12.0% · 12mo
- Down + closing
- —
- Monthly P&I
- —
- Monthly cashflow
- —
- DSCR
- —
- Eligible?
- —
Short-term bridge; refi at stabilization.
Rent comps 20 comps
| Address | Beds | Baths | Sqft | Rent | $/sqft | DOM | Units | Dist |
|---|---|---|---|---|---|---|---|---|
| 2925 Theodorus Ct Virginia Beach, VA | 3.0 | 1.5 | 1120 | $2,000 | $1.79 | 4d | 1 | 0.19mi |
| 2908 Peppercorn Ct Virginia Beach, VA | 4.0 | 1.5 | 1381 | $2,295 | $1.66 | 23d | 1 | 0.23mi |
| 932 Gossman Dr Virginia Beach, VA | 3.0 | 1.5 | 1430 | $2,300 | $1.61 | 21d | 1 | 0.24mi |
| 1232 White Birch Ln Virginia Beach, VA | 3.0 | 2.0 | 1254 | $2,095 | $1.67 | 23d | 1 | 0.87mi |
| 1240 White Birch Ln Virginia Beach, VA | 3.0 | 1.5 | 1254 | $1,950 | $1.56 | 17d | 1 | 0.88mi |
| 3304 Weeping Willow Ln Virginia Beach, VA | 3.0 | 1.5 | 1254 | $1,750 | $1.40 | 23d | 1 | 0.89mi |
| 1027 Tivoli Cres Virginia Beach, VA | 1.0–2.0 | 1.0 | 787 | $1,573 | $2.00 | 23d | 1 | 0.92mi |
| 1257 Green Cedar Ln Virginia Beach, VA | 2.0 | 1.5 | 950 | $1,725 | $1.82 | 7d | 1 | 1.00mi |
| 3745 Edenberry Ct Virginia Beach, VA | 2.0 | 2.0 | 1044 | $1,899 | $1.82 | 4d | 1 | 1.14mi |
| 3500 Green Garden Cir Virginia Beach, VA | 2.0 | 1.0 | 980 | $1,685 | $1.72 | 23d | 1 | 1.16mi |
| 3416 Hollygreen Dr Virginia Beach, VA | 2.0 | 1.0 | 960 | $1,754 | $1.83 | 23d | 5 | 1.16mi |
| 1301 Pine Cone Cir Virginia Beach, VA | 1.0–3.0 | 1.0–2.0 | 827 | $2,170 | $2.62 | 1d | 13 | 1.18mi |
| 3517 Plum Cres Virginia Beach, VA | 3.0 | 2.0 | 1450 | $2,200 | $1.52 | 12d | 1 | 1.26mi |
| 2914 Lyme Regis Quay Virginia Beach, VA | 2.0 | 2.0 | 1057 | $1,700 | $1.61 | 23d | 1 | 1.33mi |
| 526 Pheasant Run Virginia Beach, VA | 2.0 | 2.0 | 1057 | $1,800 | $1.70 | 23d | 1 | 1.34mi |
| 713 Willow Lake Cir Virginia Beach, VA | 1.0–2.0 | 1.0–2.0 | 1041 | $2,475 | $2.38 | 23d | 1 | 1.34mi |
| 2933 Lyme Regis Quay Virginia Beach, VA | 2.0 | 2.0 | 1032 | $1,700 | $1.65 | 23d | 1 | 1.38mi |
| 666 Rivers Reach Virginia Beach, VA | 2.0 | 2.0 | 1032 | $1,600 | $1.55 | 14d | 1 | 1.39mi |
| 526 Glenn Regis Way Virginia Beach, VA | 2.0 | 2.0 | 969 | $1,799 | $1.86 | 3d | 1 | 1.40mi |
| 1434 Peony Arch Virginia Beach, VA | 3.0 | 2.0 | 1407 | $2,600 | $1.85 | 23d | 1 | 1.50mi |
HOA detail
- Monthly dues
- $22 · $264/yr
Listing history 28 events
-
2026-06-18days on market $284,500 Active 62 DOM
-
2026-06-17days on market $284,500 Active 61 DOM
-
2026-06-16days on market $284,500 Active 60 DOM
-
2026-06-15days on market $284,500 Active 59 DOM
-
2026-06-13days on market $284,500 Active 57 DOM
-
2026-06-09days on market $284,500 Active 53 DOM
-
2026-06-08days on market $284,500 Active 52 DOM
-
2026-06-08pricestatus $284,500 Active 51 DOM
-
2026-06-07days on market $285,000 Active Under Contract 51 DOM
-
2026-06-03days on market $285,000 Active Under Contract 47 DOM
-
2026-06-02days on market $285,000 Active Under Contract 46 DOM
-
2026-06-01days on market $285,000 Active Under Contract 45 DOM
-
2026-05-31days on market $285,000 Active Under Contract 44 DOM
-
2026-05-22historical Active Under Contract
-
2026-05-02price $285,000
-
2026-04-17$289,500 Active
-
2024-03-13soldstatus $260,000
-
2024-02-16status Under Contract
-
2024-02-03historical Active Under Contract
-
2024-02-02status Active
-
2024-01-18historical Active Under Contract
-
2024-01-12$249,900 Active
-
2022-09-17historical
-
2022-09-16soldstatus $236,000
-
2022-08-20status Under Contract
-
2022-08-16historical Active Under Contract
-
2022-08-12$225,000 Active
-
2013-11-08soldstatus $118,800
ⓘ Source: listings_history table (triggers on properties + properties_extension) + one-shot
backfill from property_details.listing_events for pre-trigger history.
Tax reassessment forecast VA · Resets to sale price
- Current annual tax
- $2,344 · $195/mo
- Projected year-2 tax
- $2,344 · $195/mo
- Expected delta
- $0/yr ($0/mo · 0.0%)
ⓘ Screening estimate from a state-policy table — verify with the county assessor before closing.
Climate risk First Street
- Flood 3/10 Moderate FEMA zone X (shaded) · 12% chance over 30 yrs
- Wildfire 1/10 Low
- Heat 9/10 Extreme 7 d/yr ≥105°F today · 17 d/yr by 30 yrs out
- Wind 8/10 Severe 99% chance of damaging wind over 30 yrs
- Air quality 3/10 Moderate 2 unhealthy d/yr today · 4 by 30 yrs out
Nearby sold comps map
Loading sold comps map…
Walkable amenities ~0.75 mi
Loading nearby amenities…
Taxation est. · year 1
- Rental income
- $25,274
- − Mortgage interest
- −$15,936
- − Property taxes
- −$2,344
- − Insurance
- −$1,422
- − Repairs & maintenance
- −$2,022
- − Management
- −$2,022
- − HOA
- −$264
- − Depreciation
- −$8,276
- Taxable loss
- −$7,014
- Est. tax savings @ 24.0%
- +$1,683
- After-tax cash flow
- $-285/yr
For passive investors: Depreciation is non-cash, so a rental often shows a tax loss while cash-flowing — sheltering income. Rental losses are passive: they offset passive income freely, and up to $25,000/yr can offset ordinary (W-2) income if you actively participate and your MAGI is under $100k (phasing out to $0 by $150k); unused losses carry forward. On sale, claimed depreciation is recaptured at up to 25%, and gains may owe capital-gains tax (a 1031 exchange can defer both). Figures are a year-1 estimate at your 24.0% rate — not tax advice; consult a CPA.
Schools (NCES district)
- District
- Va Beach City Public School District
- NCES district ID
- 5103840
- Math proficiency
- 69% ▼ -19.00%
- Reading proficiency
- 78% ▼ -7.00%
- Median HH income
- $66,452
- Composite
- 63.81/100
- National rank
- #594
- State rank
- #10 of 131 in VA
Livability — Virginia Beach
- Score
- 83/100
- State rank
- #38
- US rank
- #880
Category grades
Schools grade is shown separately in the Schools card above.
Census & demographics
- Census place
- Virginia Beach, VA
- County
- Virginia Beach City · 448,227 people
- City population
- 448,227
- Metro
- Virginia Beach-Norfolk-Newport News, VA-NC
- Population (ZIP)
- 34,482
- Household income
- $93,838
- Rent vs Own
- Severe rent burden
- 799.0
Population outlook (Virginia Beach County) Hauer SSP2
- Today (2025)
- 480,401 people
- By 2030
- 491,221 · +2.3%
- By 2040
- 504,882 · +5.1%
- By 2050
- 508,847 · +5.9%
- By 2075
- 504,831 · +5.1%
- By 2100
- 465,867 · -3.0%
Race, ethnicity, and origin ACS 2023
- Neighborhood character
- Highly diverse neighborhood (Simpson 0.72)
- Race & ethnicity
- White 46% Black 22% Two or more races 14% Asian 12% Hispanic / Latino 10%
- Hispanic origin (detail)
- Mexican 2% Puerto Rican 3%
- Common ancestry
- Slovak 2% Romanian 2% Italian 1%
- Foreign-born
- 11% · Canada, China, Vietnam
- Languages at home
- 84% English-only · Tagalog/Filipino 6% Spanish 5% Other Indo-European 1%
Political lean MEDSL · Virginia Beach
- 2024 margin
- Toss-up / Even · D 50.7% · R 48.0% · Other 1.3%
- 2008→2024 swing
- +3.4pp toward D · 2008: -0.7pp · 2024: 2.6pp
- All cycles
- 2024: D+2.6 2020: D+5.4 2016: R+4.5 2012: R+2.5 2008: R+0.7
Not yet ingested
- Civics
- —
Market trends
- HPI YoY
- ▼ -52.96%
- Current HPI
- 341.8757
- Rent YoY
- ▲ 9.69%
- Metro
- Virginia Beach-Norfolk-Newport News, VA-NC
- State GDP YoY
- ▲ 2.40%
- F500 in state
- 50
Industry mix (Fortune 500 HQ in VA)
| Industry | F500 HQs | Revenue |
|---|---|---|
| Aerospace / Defense | 4 | $236B |
|
||
| Technology / Defense | 3 | $32B |
|
||
| Financial Services | 2 | $176B |
|
||
| Utilities | 2 | $27B |
|
||
| Insurance | 2 | $25B |
|
||
| Technology | 2 | $15B |
|
||
Price history
+139.9% since first listed15 events — show timeline
- 2026-05-22 Contingent — REINMLS
- 2026-05-02 Price Changed $285,000 REINMLS
- 2026-04-17 Listed $289,500 REINMLS
- 2024-03-13 Sold (Public Records) $260,000 Public Records
- 2024-02-16 Pending — REINMLS
- 2024-02-03 Contingent — REINMLS
- 2024-02-02 Relisted — REINMLS
- 2024-01-18 Contingent — REINMLS
- 2024-01-12 Listed $249,900 REINMLS
- 2022-09-17 Listing Removed — REINMLS
- 2022-09-16 Sold (Public Records) $236,000 Public Records
- 2022-08-20 Pending — REINMLS
- 2022-08-16 Contingent — REINMLS
- 2022-08-12 Listed $225,000 REINMLS
- 2013-11-08 Sold (Public Records) $118,800 Public Records
Property tax history
+6.4%/yrLatest (2025): $2,344 · +14.0% YoY. Source: county tax records.
Cash-flow waterfall
monthlySold comps — $/sqft
last 12 mo · ≤1 miLoading sold comps…