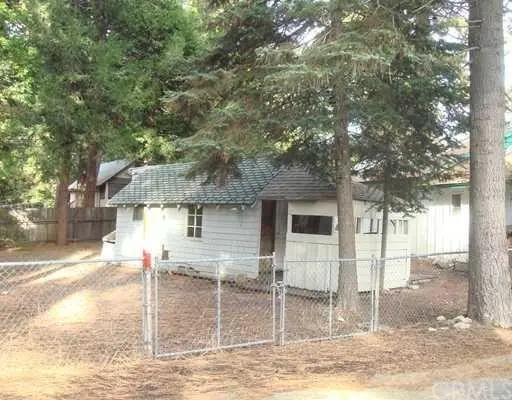
2631 Secret · Running Springs, CA
Flood risk 1/10 · Minimal
- FEMA flood zone
- D
- Chance of flooding over 30 yrs
- 0.0%
- Est. flood insurance / yr
- $544 – $1,084
Fire risk 9/10 · Severe
- Est. fire insurance / yr
- $659 – $1,223
Heat risk 2/10 · Minimal
- Hot days now (above threshold)
- —
- Hot days in 30 yrs
- —
Wind risk 1/10 · Minimal
- Chance of severe wind over 30 yrs
- —
Air-quality risk 10/10 · Severe
- Unhealthy air days now
- 35 days/yr
- Unhealthy air days in 30 yrs
- 45 days/yr
Risk factors via First Street. Map © Google.
Why this score? — see what drove the D+ grade
The composite is a weighted blend of 9 inputs, each scored 0–100. Each bar is that input's sub-score; the figure is the points it added to the 100-point composite (weight × sub-score).
- Cash flow +15.4/30.0
- ARV discount +15.0/15.0
- DSCR +4.7/10.0
- Livability +3.3/5.0
- 1% rule +3.2/10.0
- Rent growth +2.5/5.0
- Condition / age +2.5/5.0
- Schools +2.1/10.0
- Appreciation +0.0/10.0
$189,990
🖨 Deal sheet 📄 Offer letter ✓ Due diligence
Listing remarks MLS
This Is A Fixer. Bring Your Tool Box. Needs Lots Of Work
Key facts
- 5,730 sq ft lot
- Built 1927
- Listed 9 days
Property features AI
Finance
- Other: Located in a mountainous, suburban community; Directions: From 18 Hwy, exit Palo Alto Way, then go West (left) onto Secret Dr. House on right
Exterior
- Utilities: Public sewer; District/Public water
- Home design: Single-story; Entry on main level
- Construction: Year built source: Assessor
- Exterior features: House structure; Treed lot; Back yard; Park nearby; Has a view
Interior
- Kitchen: Fireplace located in the kitchen
- Bedrooms: 1 bedroom on main level
- Bathrooms: 1 full bathroom
- Interior features: One-level home; All bedrooms on main level; Main level entry; Kitchen fireplace
- Laundry & utility: Outdoor laundry area
Neighborhood map
What this means for you Summary
Snapshot
- This is a 1-bed/1.0-bath single-family listed at $190k.
Deal economics
- At list price, monthly cash flow is $74 ($893/yr) — positive.
- The deal already cash-flows at list — no discount required.
- To meet the 1% rule (rent ≥ 1% of price), the offer needs to be $156k (17.8% below list).
- Recommended offer: $156k (17.8% below list) — sets the bar for 1% rule.
- Cap rate 6.8% vs local median 3.9% in Running Springs — top-decile yield for the area; either an underpriced asset or a hidden risk that comps aren't pricing in. Stress-test before assuming the spread holds.
Location & tenants
- Location reads 66/100 on livability (#333 in CA) — a middle-class / working-renter tenant base. Strengths: housing A+, employment A-; Watch: crime C-, schools D+, amenities F.
- Rim Of The World Unified (town): math 13% / reading 34% proficiency, ranked #415 of 517 in CA (top 80%) — low school quality limits family demand, transient renter base, plan for 1-2y turnover.
- Market conditions: 180 active listings in the ZIP; 7 comparable units currently listed for rent nearby; rentals lingering (median 44d on market — plan ~5-8 weeks vacancy on turnover, expect pricing pressure); 71% of comp listings sitting > 30 days — soft ceiling on asking rent; solid renter incomes; 5,458 units permitted in San Bernardino County in 2024 (1,500 in 5+ unit buildings).
Forward outlook
- Local home prices are declining (-3.0%/yr); year-one equity from $1k of loan paydown is wiped out by about $6k of value loss. Plan a longer hold.
- San Bernardino County population projected at +15% by 2050 — modest demand growth; plan on rents tracking national, not racing it.
Negotiation context
- Only 9 days on market — expect competitive offers; lowballing is unlikely to land.
- 4 sale attempts since 22y ago with the ask held roughly flat each time — persistent listings suggest the price (not the market) is what's stuck; bring a comps-based counter.
- Current owner paid $32k; list at $190k implies a 494% gain — meaningful room to come down on a strong offer.
Risks & watch-outs
- Watch-outs: built in 1927 — expect roof / HVAC / electrical / plumbing capex.
- Climate carrying-cost: severe wildfire risk — expect insurance premiums to compound above CPI over the hold.
Questions for the listing agent
- Built in 1927 — when were the roof, HVAC, electrical panel, plumbing, and water heater last replaced?
- Is there a deadline driving the sale (1031 exchange, divorce, estate, relocation)? That informs how much negotiation room exists.
- Schools are D-rated, which usually means shorter tenancies and higher turnover. Who's the typical renter profile here, and what's been the actual vacancy rate?
- The area grade is low — what's the realistic commute time and amenity access for the typical tenant pool here? Any planned neighborhood developments (good or bad) we should know about?
- What's the average days-on-market for RENTAL listings here right now (not sales)? A rising rental-DOM trend means longer vacancies and softer asking-rent achievability than the comps imply.
- What's the recent tenant-quality profile in this submarket — average credit score on applications, eviction rate, late-payment / NSF rate, and stable-employment percentage? A property-management company in the area should have these aggregated.
- How much new for-sale + rental construction is in the pipeline within 1–3 miles? Heavy new supply typically softens prices + rents 12–24 months out; constrained supply supports both.
Investment metrics
- 1% rule
- 0.82% ✗
- Cap rate
- 6.76%
- Cash-on-cash
- 1.68%
- DSCR
- 1.07
- GRM
- 10.1
CMA / ARV
- ARV (on-the-fly)
- $306,900
- Comps found
- 9
Show comp detail 9 sales within ~0.75 mi
| Address | Dist | Beds/Ba | Sqft | Sold | Price | $/sf | Match |
|---|---|---|---|---|---|---|---|
| 2398 Whispering Pines Dr | 0.29mi | 2/1.0 (+1) | 672 (+2%) | 9mo | $320,000 | $476 | 72 |
| 32135 West Dr | 0.23mi | 2/1.5 (+1) | 700 (+6%) | 1mo | $315,000 | $450 | 71 |
| 32146 Fern Dr | 0.29mi | 1/1.0 | 644 (-2%) | 17mo | $225,000 | $349 | 69 |
| 2551 Whispering Pines Dr | 0.09mi | 1/1.0 | 588 (-11%) | 14mo | $330,000 | $561 | 66 |
| 2546 Whispering Pines Dr | 0.11mi | 1/1.0 | 728 (+10%) | 16mo | $340,000 | $467 | 65 |
| 31615 Wagon Wheel Dr | 0.48mi | 2/1.0 (+1) | 662 (+0%) | 23mo | $280,000 | $423 | 53 |
| 31721 Wagon Wheel Dr | 0.45mi | 2/1.0 (+1) | 720 (+9%) | 10mo | $335,000 | $465 | 51 |
| 2430 Whispering Pines Dr | 0.26mi | 2/1.0 (+1) | 569 (-14%) | 15mo | $364,900 | $641 | 48 |
| 2389 Rim Of The World Dr | 0.71mi | 2/1.0 (+1) | 714 (+8%) | 13mo | $209,500 | $293 | 37 |
Match score weights: distance 35% · size 25% · config 20% · recency 20%. Top-matched comps best support the ARV.
Projected returns pro-forma
-3.0% appreciation · 3.0% rent growth · sell at horizon
- IRR
- -13.7%
- Equity multiple
- 0.51×
- Total profit
- $-26,115
- Equity at exit
- $28,328
- IRR
- -4.9%
- Equity multiple
- 0.68×
- Total profit
- $-16,923
- Equity at exit
- $16,427
Cash invested: $53,197 (down + closing). Projections, not guarantees.
Landlord ↔ Tenant lean methodology
- Overall (STATE)
- 18 Strongly Tenant-Friendly
- State California
- 18 Strongly Tenant-Friendly · D+13
- County
- — inherits STATE
- City
- — inherits STATE
ZIP-level market 92382
- Active inventory
- 180
- Price-to-rent
- 10.1×
Monthly cashflow live
- Estimated rent
- $1,562 high interval (Pro) →
- Mortgage (P&I)
- −$996
- Tax from tax record
- −$84 /mo · $1,004/yr
- Insurance
- −$79
- HOA
- −$0
- Vacancy / Maint / Mgmt
- −$328
- Net cashflow
- $74
Break-even live
UW: 25.0% down · 7.5% · 30yr · 1.5% tax · 5.0% vac · 8.0% maint · 8.0% mgmt
Financing live
Cash to close
- Down payment
- $47,498
- Closing costs
- $5,700
- Reserves months
- —
- Total cash needed
- —
Loan-product check · same deal, 3 products live
Conventional
25% down · 7.5% · 30yr
- Down + closing
- —
- Monthly P&I
- —
- Monthly cashflow
- —
- DSCR
- —
- Eligible?
- —
Personal DTI + credit; lowest rate.
DSCR
20% down · 8.5% · 30yr
- Down + closing
- —
- Monthly P&I
- —
- Monthly cashflow
- —
- DSCR
- —
- Eligible?
- —
No personal income docs; deal must DSCR.
Hard money
10% down · 12.0% · 12mo
- Down + closing
- —
- Monthly P&I
- —
- Monthly cashflow
- —
- DSCR
- —
- Eligible?
- —
Short-term bridge; refi at stabilization.
Rent comps 7 comps
| Address | Beds | Baths | Sqft | Rent | $/sqft | DOM | Units | Dist |
|---|---|---|---|---|---|---|---|---|
| 2410 Secret Dr Running Springs, CA | 1.0 | 1.0 | 575 | $1,550 | $2.70 | 24d | 1 | 0.30mi |
| 32132 West Dr Running Springs, CA | 1.0 | 1.0 | 700 | $1,400 | $2.00 | 44d | 1 | 0.30mi |
| 2620 Dade Dr Unit 2 Running Springs, CA | 1.0 | 1.0 | 500 | $1,400 | $2.80 | 44d | 1 | 0.33mi |
| 31379 Lightfoot Way Running Springs, CA | 1.0 | 1.0 | 600 | $1,450 | $2.42 | 44d | 1 | 0.69mi |
| 31144 All View Dr Unit A Running Springs, CA | 2.0 | 1.0 | 650 | $1,800 | $2.77 | 44d | 1 | 1.10mi |
| 2490 Fern Dr Running Springs, CA | 1.0 | 1.0 | 700 | $1,849 | $2.64 | 44d | 1 | 1.25mi |
| 32868 Deer Ln Running Springs, CA | 2.0 | 2.0 | 650 | $1,650 | $2.54 | 24d | 1 | 1.29mi |
Listing history 8 events
-
2026-06-18days on market $189,990 Active 9 DOM
-
2026-06-17days on market $189,990 Active 8 DOM
-
2026-06-16days on market $189,990 Active 7 DOM
-
2026-06-15days on market $189,990 Active 6 DOM
-
2026-06-13days on market $189,990 Active 4 DOM
-
2026-06-13days on market $189,990 Active 3 DOM
-
2026-06-09remarks 464-char remark
-
2026-06-09$189,990 Active 1 DOM
ⓘ Source: listings_history table (triggers on properties + properties_extension) + one-shot
backfill from property_details.listing_events for pre-trigger history.
Tax reassessment forecast CA · Resets to sale price
- Current annual tax
- $1,004 · $84/mo
- Projected year-2 tax
- $1,444 · $120/mo
- Expected delta
- +$440/yr (+$37/mo · 43.8%)
ⓘ Screening estimate from a state-policy table — verify with the county assessor before closing.
Climate risk First Street
- Flood 1/10 Low FEMA zone D · 0% chance over 30 yrs
- Wildfire 9/10 Extreme
- Heat 2/10 Low
- Wind 1/10 Low
- Air quality 10/10 Extreme 35 unhealthy d/yr today · 45 by 30 yrs out
Nearby sold comps map
Loading sold comps map…
Walkable amenities ~0.75 mi
Loading nearby amenities…
Taxation est. · year 1
- Rental income
- $18,738
- − Mortgage interest
- −$10,642
- − Property taxes
- −$1,004
- − Insurance
- −$950
- − Repairs & maintenance
- −$1,499
- − Management
- −$1,499
- − Depreciation
- −$5,527
- Taxable loss
- −$2,383
- Est. tax savings @ 24.0%
- +$572
- After-tax cash flow
- $1,465/yr
For passive investors: Depreciation is non-cash, so a rental often shows a tax loss while cash-flowing — sheltering income. Rental losses are passive: they offset passive income freely, and up to $25,000/yr can offset ordinary (W-2) income if you actively participate and your MAGI is under $100k (phasing out to $0 by $150k); unused losses carry forward. On sale, claimed depreciation is recaptured at up to 25%, and gains may owe capital-gains tax (a 1031 exchange can defer both). Figures are a year-1 estimate at your 24.0% rate — not tax advice; consult a CPA.
Schools (NCES district)
- District
- Rim Of The World Unified
- NCES district ID
- 0632610
- Math proficiency
- 13% ▼ -10.00%
- Reading proficiency
- 34% ▼ -7.00%
- Median HH income
- $55,860
- Composite
- 21.29/100
- National rank
- #8389
- State rank
- #415 of 517 in CA
Livability — Running Springs
- Score
- 66/100
- State rank
- #333
- US rank
- #11396
Category grades
Schools grade is shown separately in the Schools card above.
Census & demographics
- Census place
- Running Springs, CA
- County
- San Bernardino County · 2,030,291 people
- City population
- 5,215
- Metro
- Riverside-San Bernardino-Ontario, CA
- Population (ZIP)
- 5,215
- Household income
- $81,493
- Rent vs Own
- Severe rent burden
- 255.0
Population outlook (San Bernardino County) Hauer SSP2
- Today (2025)
- 2,300,329 people
- By 2030
- 2,378,907 · +3.4%
- By 2040
- 2,523,137 · +9.7%
- By 2050
- 2,642,388 · +14.9%
- By 2075
- 2,880,769 · +25.2%
- By 2100
- 2,909,436 · +26.5%
Race, ethnicity, and origin ACS 2023
- Neighborhood character
- Predominantly White (70%)
- Race & ethnicity
- White 70% Hispanic / Latino 21% Two or more races 17% Asian 3% Native American 1%
- Hispanic origin (detail)
- Mexican 18%
- Common ancestry
- Iranian 2% Slovak 2% Scotch-Irish 2%
- Foreign-born
- 5% · Canada, South Korea
- Languages at home
- 90% English-only · Spanish 6% Tagalog/Filipino 3% French/Haitian/Cajun 1%
Political lean MEDSL · San Bernardino
- 2024 margin
- Toss-up / Even · D 47.5% · R 49.7% · Other 2.8%
- 2008→2024 swing
- -8.5pp toward R · 2008: 6.3pp · 2024: -2.1pp
- All cycles
- 2024: R+2.1 2020: D+10.7 2016: D+9.8 2012: D+5.4 2008: D+6.3
Not yet ingested
- Civics
- —
Market trends
- HPI YoY
- ▼ -263.08%
- Current HPI
- 341.4318
- Rent YoY
- —
- Metro
- Riverside-San Bernardino-Ontario, CA
- State GDP YoY
- ▲ 3.21%
- F500 in state
- 116
Industry mix (Fortune 500 HQ in CA)
| Industry | F500 HQs | Revenue |
|---|---|---|
| Technology | 27 | $1,492B |
|
||
| Financial Services | 3 | $174B |
|
||
| Retail | 3 | $44B |
|
||
| Insurance | 3 | $26B |
|
||
| Media / Entertainment | 2 | $115B |
|
||
| Pharmaceuticals / Biotech | 2 | $62B |
|
||
Price history
+544.0% since first listed12 events — show timeline
- 2026-06-09 Listed $189,990 CRMLS
- 2026-06-09 Coming Soon $189,990 CRMLS
- 2012-11-08 Sold (Public Records) $32,000 Public Records
- 2012-11-08 Sold (MLS) $32,000 MRCAOR
- 2012-11-08 Sold (MLS) $32,000 CRMLS
- 2010-10-27 Listed $39,000 MRCAOR
- 2010-10-27 Listed $39,000 CRMLS
- 2004-02-10 Sold (Public Records) $55,000 Public Records
- 2004-01-20 Sold (MLS) $55,000 CRMLS
- 2004-01-19 Listed $70,000 CRMLS
- 1997-07-03 Sold (Public Records) $30,000 Public Records
- 1989-04-11 Sold (Public Records) $29,500 Public Records
Property tax history
+0.2%/yrLatest (2025): $1,004 · +11.9% YoY. Source: county tax records.
Cash-flow waterfall
monthlySold comps — $/sqft
last 12 mo · ≤1 miLoading sold comps…