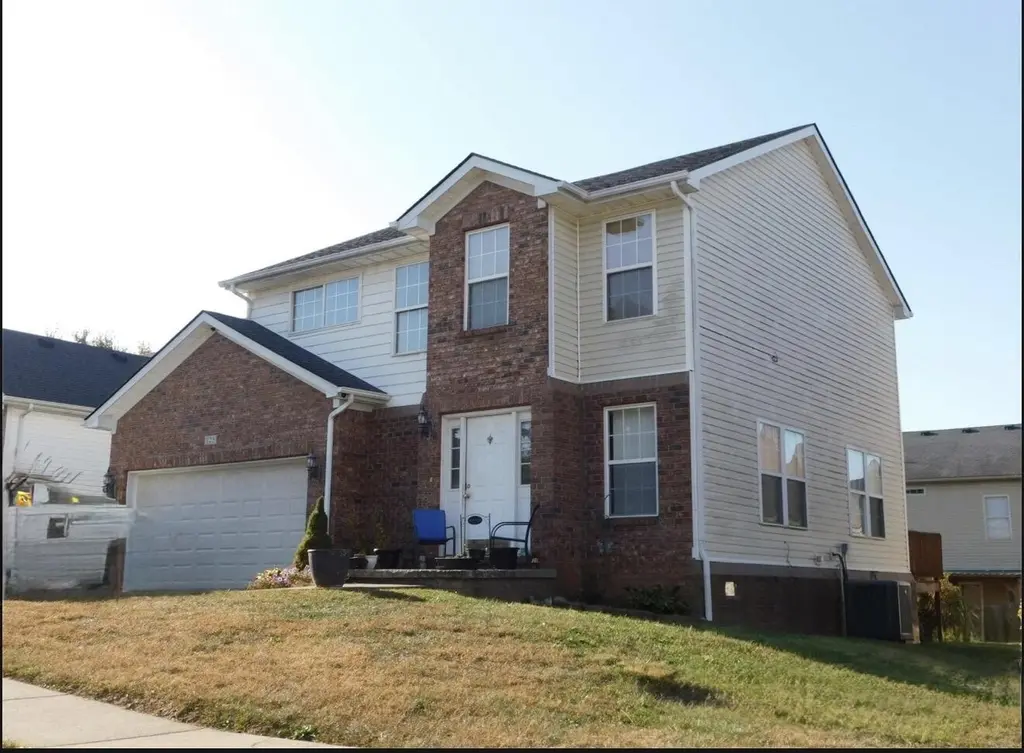
125 Rodeo Dr · Georgetown, KY
Flood risk 1/10 · Minimal
- FEMA flood zone
- X (unshaded)
- Chance of flooding over 30 yrs
- 0.0%
- Est. flood insurance / yr
- $507 – $1,088
Fire risk 3/10 · Minor
- Est. fire insurance / yr
- $839 – $1,559
Heat risk 4/10 · Minor
- Hot days now (above 102°F)
- 7 days/yr
- Hot days in 30 yrs
- 19 days/yr
Wind risk 2/10 · Minimal
- Chance of severe wind over 30 yrs
- 1.0%
Air-quality risk 2/10 · Minimal
- Unhealthy air days now
- 0 days/yr
- Unhealthy air days in 30 yrs
- 1 days/yr
Risk factors via First Street. Map © Google.
Why this score? — see what drove the D grade
The composite is a weighted blend of 9 inputs, each scored 0–100. Each bar is that input's sub-score; the figure is the points it added to the 100-point composite (weight × sub-score).
- Cash flow +15.7/30.0
- ARV discount +7.5/15.0
- DSCR +4.8/10.0
- Livability +3.9/5.0
- 1% rule +3.6/10.0
- Schools +3.4/10.0
- Rent growth +3.2/5.0
- Condition / age +2.5/5.0
- Appreciation +0.0/10.0
$250,000
🖨 Deal sheet 📄 Offer letter ✓ Due diligence
Key facts
- 5,501 sq ft lot
- 2 garage spots
- Built 2006
Property features AI
Finance
- Other: Located in the Mansion Estates subdivision; Directions: In the Mansion Estates turn left off Lemon's mill, turn left onto Santa Barbara, take first roundabout next exit on Rodeo Drive; County: Scott
- HOA & community: Has association with annual fee
Exterior
- Parking: Attached garage; Property has a garage
- Utilities: Public sewer; Electricity connected; Underground utilities
- Home design: Two-story house
- Construction: Brick veneer and vinyl siding construction; Block foundation; Shingle roof
- Exterior features: Brick veneer and vinyl siding; Shingle roof; Block foundation; Public water; Not on waterfront
Interior
- Kitchen: Disposal; Dishwasher; Refrigerator; Range
- Bedrooms: Primary bedroom is on the first floor
- Flooring: Carpet; Vinyl
- Bathrooms: 2 full bathrooms; 1 half bathroom
- Heating & cooling: Electric heating; Heat pump; Electric cooling
- Interior features: Primary suite on the first floor; Walk-in closet(s); Crawl space basement; Insulated windows with screens; No fireplace; 11 total rooms
- Laundry & utility: Washer hookup; Electric dryer hookup; Gas dryer hookup
Neighborhood map
What this means for you Summary
Snapshot
- This is a 4-bed/2.5-bath other listed at $250k.
Deal economics
- At list price, monthly cash flow is $108 ($1k/yr) — positive.
- The deal already cash-flows at list — no discount required.
- To meet the 1% rule (rent ≥ 1% of price), the offer needs to be $216k (13.5% below list).
- Recommended offer: $216k (13.5% below list) — sets the bar for 1% rule.
- Cap rate 6.8% vs local median 3.5% in Georgetown — top-decile yield for the area; either an underpriced asset or a hidden risk that comps aren't pricing in. Stress-test before assuming the spread holds.
Location & tenants
- Location reads 78/100 on livability (#75 in KY, #2,338 nationally) — a middle-class / working-renter tenant base. Strengths: cost of living A+, housing A+, health & safety A+; Watch: amenities D, commute F.
- Scott County (town): math 32% / reading 44% proficiency, ranked #31 of 165 in KY (top 19%) — families likely to look elsewhere, expect single-tenant / working-renter base with shorter leases.
- Zoned schools: Garth Elementary School (math 47% / reading 47%, grade D-, #119 of 676 statewide, top 19%, 368 students, 65% FRL); Georgetown Middle School (math 18% / reading 39%, grade F, #161 of 217 statewide, top 75%, 636 students, 54% FRL); Scott County High School (math 34% / reading 37%, grade F, #73 of 254 statewide, top 28%, 1,197 students, 40% FRL) — zoned schools average 53% FRL vs 37% district-wide (16 pts higher); higher-poverty schools than district average — tighter screening recommended.
- Market conditions: Rents rising (+3.0%/yr); 441 active listings in the ZIP; 2 comparable units currently listed for rent nearby; solid renter incomes; 546 units permitted in Scott County in 2024 (98 in 5+ unit buildings).
- This rent runs 30% of the median local income ($85k/yr) — at the standard rent-burdened threshold; future hikes will face affordability resistance.
Forward outlook
- Local home prices are declining (-3.0%/yr); year-one equity from $2k of loan paydown is wiped out by about $8k of value loss. Plan a longer hold.
- Scott County population projected at +45% by 2050 — long-run rental-demand tailwind backs the buy-and-hold thesis.
Negotiation context
- Only 1 days on market — expect competitive offers; lowballing is unlikely to land.
- 5 sale attempts since 23y ago with the ask held roughly flat each time — persistent listings suggest the price (not the market) is what's stuck; bring a comps-based counter.
Questions for the listing agent
- What does the HOA fee cover, when was the last increase, and are there any pending special assessments or reserve-fund shortfalls?
- Is there a deadline driving the sale (1031 exchange, divorce, estate, relocation)? That informs how much negotiation room exists.
- Schools are D-rated, which usually means shorter tenancies and higher turnover. Who's the typical renter profile here, and what's been the actual vacancy rate?
- The area grade is low — what's the realistic commute time and amenity access for the typical tenant pool here? Any planned neighborhood developments (good or bad) we should know about?
- What's the average days-on-market for RENTAL listings here right now (not sales)? A rising rental-DOM trend means longer vacancies and softer asking-rent achievability than the comps imply.
- What's the recent tenant-quality profile in this submarket — average credit score on applications, eviction rate, late-payment / NSF rate, and stable-employment percentage? A property-management company in the area should have these aggregated.
- How much new for-sale + rental construction is in the pipeline within 1–3 miles? Heavy new supply typically softens prices + rents 12–24 months out; constrained supply supports both.
Investment metrics
- 1% rule
- 0.86% ✗
- Cap rate
- 6.81%
- Cash-on-cash
- 1.86%
- DSCR
- 1.08
- GRM
- 9.6
CMA / ARV
No comps found within radius.
Projected returns pro-forma
-3.0% appreciation · 3.0% rent growth · sell at horizon
- IRR
- -13.4%
- Equity multiple
- 0.52×
- Total profit
- $-33,656
- Equity at exit
- $37,276
- IRR
- -4.5%
- Equity multiple
- 0.71×
- Total profit
- $-20,610
- Equity at exit
- $21,615
Cash invested: $70,000 (down + closing). Projections, not guarantees.
Landlord ↔ Tenant lean methodology
- Overall (STATE)
- 83 Strongly Landlord-Friendly
- State Kentucky
- 83 Strongly Landlord-Friendly · R+16
- County
- — inherits STATE
- City
- — inherits STATE
ZIP-level market 40324
- Rents YoY
- 3.0%
- Active inventory
- 441
- Price-to-rent
- 9.6×
Monthly cashflow live
- Estimated rent
- $2,161 medium interval (Pro) →
- Mortgage (P&I)
- −$1,311
- Tax from tax record
- −$178 /mo · $2,135/yr
- Insurance
- −$104
- HOA
- −$6
- Vacancy / Maint / Mgmt
- −$454
- Net cashflow
- $108
Break-even live
UW: 25.0% down · 7.5% · 30yr · 1.5% tax · 5.0% vac · 8.0% maint · 8.0% mgmt
Financing live
Cash to close
- Down payment
- $62,500
- Closing costs
- $7,500
- Reserves months
- —
- Total cash needed
- —
Loan-product check · same deal, 3 products live
Conventional
25% down · 7.5% · 30yr
- Down + closing
- —
- Monthly P&I
- —
- Monthly cashflow
- —
- DSCR
- —
- Eligible?
- —
Personal DTI + credit; lowest rate.
DSCR
20% down · 8.5% · 30yr
- Down + closing
- —
- Monthly P&I
- —
- Monthly cashflow
- —
- DSCR
- —
- Eligible?
- —
No personal income docs; deal must DSCR.
Hard money
10% down · 12.0% · 12mo
- Down + closing
- —
- Monthly P&I
- —
- Monthly cashflow
- —
- DSCR
- —
- Eligible?
- —
Short-term bridge; refi at stabilization.
Rent comps 2 comps
| Address | Beds | Baths | Sqft | Rent | $/sqft | DOM | Units | Dist |
|---|---|---|---|---|---|---|---|---|
| 102 Amerson Orchard Rd Georgetown, KY | 1.0–3.0 | 1.0–3.0 | 1044 | $2,164 | $2.07 | 13d | 28 | 0.40mi |
| 242 Elkhorn Meadows Dr Georgetown, KY | 3.0 | 2.5 | 1378 | $1,900 | $1.38 | 43d | 1 | 0.59mi |
HOA detail
- Monthly dues
- $6 · $72/yr
Listing history 1 events
-
2026-06-07$250,000 Pending 1 DOM
ⓘ Source: listings_history table (triggers on properties + properties_extension) + one-shot
backfill from property_details.listing_events for pre-trigger history.
Tax reassessment forecast KY · Resets to sale price
- Current annual tax
- $2,135 · $178/mo
- Projected year-2 tax
- $2,150 · $179/mo
- Expected delta
- +$15/yr (+$1/mo · 0.7%)
ⓘ Screening estimate from a state-policy table — verify with the county assessor before closing.
Climate risk First Street
- Flood 1/10 Low FEMA zone X (unshaded) · 0% chance over 30 yrs
- Wildfire 3/10 Moderate
- Heat 4/10 Moderate 7 d/yr ≥102°F today · 19 d/yr by 30 yrs out
- Wind 2/10 Low 100% chance of damaging wind over 30 yrs
- Air quality 2/10 Low 0 unhealthy d/yr today · 1 by 30 yrs out
Nearby sold comps map
Loading sold comps map…
Walkable amenities ~0.75 mi
Loading nearby amenities…
Taxation est. · year 1
- Rental income
- $25,936
- − Mortgage interest
- −$14,004
- − Property taxes
- −$2,135
- − Insurance
- −$1,250
- − Repairs & maintenance
- −$2,075
- − Management
- −$2,075
- − HOA
- −$72
- − Depreciation
- −$7,273
- Taxable loss
- −$2,947
- Est. tax savings @ 24.0%
- +$707
- After-tax cash flow
- $2,008/yr
For passive investors: Depreciation is non-cash, so a rental often shows a tax loss while cash-flowing — sheltering income. Rental losses are passive: they offset passive income freely, and up to $25,000/yr can offset ordinary (W-2) income if you actively participate and your MAGI is under $100k (phasing out to $0 by $150k); unused losses carry forward. On sale, claimed depreciation is recaptured at up to 25%, and gains may owe capital-gains tax (a 1031 exchange can defer both). Figures are a year-1 estimate at your 24.0% rate — not tax advice; consult a CPA.
Schools (NCES district)
- District
- Scott County
- NCES district ID
- 2105260
- Math proficiency
- 32% ▼ -14.00%
- Reading proficiency
- 44% ▼ -16.00%
- Median HH income
- $61,324
- Composite
- 33.87/100
- National rank
- #5348
- State rank
- #31 of 165 in KY
Livability — Georgetown
- Score
- 78/100
- State rank
- #75
- US rank
- #2338
Category grades
Schools grade is shown separately in the Schools card above.
Census & demographics
- Census place
- Georgetown, KY
- County
- Scott County · 53,406 people
- City population
- 53,406
- Metro
- Lexington-Fayette, KY
- Population (ZIP)
- 53,406
- Household income
- $85,110
- Rent vs Own
- Severe rent burden
- 993.0
Population outlook (Scott County) Hauer SSP2
- Today (2025)
- 63,814 people
- By 2030
- 69,637 · +9.1%
- By 2040
- 81,315 · +27.4%
- By 2050
- 92,677 · +45.2%
- By 2075
- 118,956 · +86.4%
- By 2100
- 136,792 · +114.4%
Race, ethnicity, and origin ACS 2023
- Neighborhood character
- Predominantly White (83%)
- Race & ethnicity
- White 83% Hispanic / Latino 6% Two or more races 6% Black 5%
- Hispanic origin (detail)
- Mexican 4%
- Common ancestry
- Italian 2% Serbian 2% Slovak 2%
- Foreign-born
- 3% · Canada
- Languages at home
- 94% English-only · Spanish 4%
Political lean MEDSL · Scott
- 2024 margin
- Strong R (+27.7) · D 35.3% · R 63.0% · Other 1.7%
- 2008→2024 swing
- -7.1pp toward R · 2008: -20.6pp · 2024: -27.7pp
- All cycles
- 2024: R+27.7 2020: R+24.9 2016: R+30.4 2012: R+25.0 2008: R+20.6
Not yet ingested
- Civics
- —
Market trends
- HPI YoY
- ▼ -105.49%
- Current HPI
- 187.89
- Rent YoY
- ▲ 3.00%
- Metro
- Lexington-Fayette, KY
- State GDP YoY
- ▲ 1.81%
- F500 in state
- 4
Industry mix (Fortune 500 HQ in KY)
| Industry | F500 HQs | Revenue |
|---|---|---|
| Healthcare | 1 | $118B |
|
||
| Food / Beverage | 1 | $7B |
|
||
Price history
+71.4% since first listed10 events — show timeline
- 2026-05-07 Pending — ImagineMLS
- 2026-05-07 Listed $250,000 ImagineMLS
- 2008-02-14 Listing Removed — ImagineMLS
- 2007-02-14 Listed $129,900 ImagineMLS
- 2006-07-14 Listing Removed — ImagineMLS
- 2006-02-08 Listed $144,900 ImagineMLS
- 2006-02-02 Listing Removed — ImagineMLS
- 2006-01-19 Listed $143,900 ImagineMLS
- 2004-02-05 Listing Removed — ImagineMLS
- 2003-04-25 Listed $145,900 ImagineMLS
Property tax history
+7.4%/yrLatest (2025): $2,135 · +12.1% YoY. Source: county tax records.
Cash-flow waterfall
monthlySold comps — $/sqft
last 12 mo · ≤1 miLoading sold comps…