3567 Prominence St · New Braunfels, TX
Flood risk 1/10 · Minimal
- FEMA flood zone
- X (unshaded)
- Chance of flooding over 30 yrs
- 0.0%
- Est. flood insurance / yr
- $507 – $1,088
Fire risk 5/10 · Moderate
- Est. fire insurance / yr
- $1,222 – $2,270
Heat risk 8/10 · Major
- Hot days now (above 108°F)
- 7 days/yr
- Hot days in 30 yrs
- 22 days/yr
Wind risk 8/10 · Major
- Chance of severe wind over 30 yrs
- 80.0%
Air-quality risk 1/10 · Minimal
- Unhealthy air days now
- 0 days/yr
- Unhealthy air days in 30 yrs
- 0 days/yr
Risk factors via First Street. Map © Google.
Why this score? — see what drove the D grade
The composite is a weighted blend of 9 inputs, each scored 0–100. Each bar is that input's sub-score; the figure is the points it added to the 100-point composite (weight × sub-score).
- Cash flow +12.5/30.0
- ARV discount +7.5/15.0
- Schools +5.2/10.0
- Livability +4.2/5.0
- DSCR +3.7/10.0
- 1% rule +3.6/10.0
- Condition / age +2.5/5.0
- Rent growth +2.0/5.0
- Appreciation +0.0/10.0
$205,999
🖨 Deal sheet (PDF) 📄 Offer letter ✓ Due diligence
Listing remarks
This single-level home showcases a spacious open floorplan shared between the kitchen, dining area and family room for easy entertaining during gatherings. An owner's suite enjoys a private location in a rear corner of the home, complemented by an en-suite bathroom and walk-in closet. There are two secondary bedrooms along the side of the home, which are comfortable spaces for household members and overnight guests.
Key facts
- Walk-in closet
- Open floorplan
- Secondary bedrooms
Tags
Property features AI
Finance
- Financial info: List price $205,499
Exterior
- Parking: 2 garage spaces (2 total parking spaces)
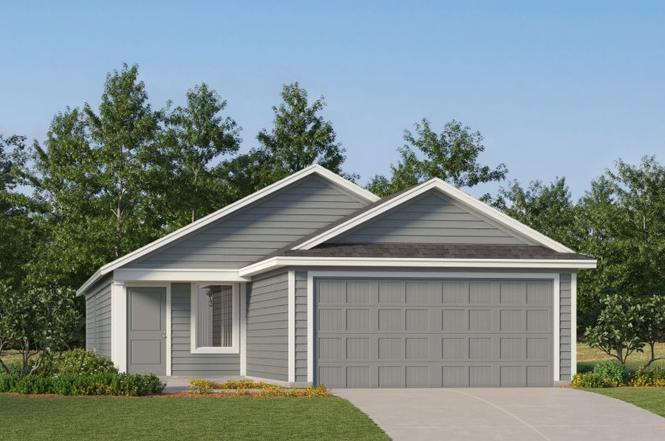
- Home design: Single-family home, Kitson plan; Located at 3567 Prominence St, New Braunfels, TX
- Exterior features: Living area approximately 1402
Interior
- Bedrooms: 3 bedrooms
- Bathrooms: 2 full bathrooms
- Interior features: Spec new construction (Kitson plan)
Neighborhood map
What this means for you Summary
Snapshot
- This is a 3-bed/2.0-bath single-family listed at $206k.
Deal economics
- At list price, monthly cash flow is $-29 ($-351/yr) — negative.
- To cash-flow at today's rent, offer at most $202k (2.1% below list).
- To meet the 1% rule (rent ≥ 1% of price), the offer needs to be $176k (14.3% below list).
- Recommended offer: $176k (14.3% below list) — sets the bar for 1% rule.
- Cap rate 6.1% vs local median 3.3% in New Braunfels — top-decile yield for the area; either an underpriced asset or a hidden risk that comps aren't pricing in. Stress-test before assuming the spread holds.
Location & tenants
- Location reads 83/100 on livability (#9 in TX, #925 nationally) — a professional / high-income tenant draw. Strengths: amenities A+, housing A+, health & safety A+; Watch: commute F.
- Comal ISD (rural): math 57% / reading 59% proficiency, ranked #58 of 826 in TX (top 7%) — acceptable for families but not a draw, mixed tenant base, ~2y average lease.
- Zoned schools: Morningside El (math 44% / reading 33%, grade F, #1,680 of 4,322 statewide, top 40%, 810 students, 63% FRL); Canyon Middle (math 48% / reading 44%, grade D+, #462 of 1,662 statewide, top 28%, 1,175 students, 47% FRL); Canyon H S (math 59% / reading 65%, grade B-, #237 of 1,632 statewide, top 16%, 2,348 students, 35% FRL) — zoned schools average 48% FRL vs 31% district-wide (17 pts higher); higher-poverty schools than district average — tighter screening recommended.
- Market conditions: Rents soft (-2.0%/yr); 1931 active listings in the ZIP; 40 comparable units currently listed for rent nearby; rentals at typical pace (median 20d on market — plan ~3-4 weeks tenant-placement turnaround); solid renter incomes; 2,064 units permitted in Guadalupe County in 2024 (133 in 5+ unit buildings).
Forward outlook
- Local home prices are declining (-3.0%/yr); year-one equity from $1k of loan paydown is wiped out by about $6k of value loss. Plan a longer hold.
- Guadalupe County population projected at +61% by 2050 — long-run rental-demand tailwind backs the buy-and-hold thesis.
Negotiation context
- Only 6 days on market — expect competitive offers; lowballing is unlikely to land.
Risks & watch-outs
- Climate carrying-cost: severe wind risk, 80% chance of damaging wind over 30y; moderate wildfire risk; extreme-heat days projected 7→22/yr by 2055 (HVAC capex compounding) — expect insurance premiums to compound above CPI over the hold.
Questions for the listing agent
- What do current leases actually rent for vs. the listed asking? Can we see a recent rent roll and the last 12 months of T-12 income?
- Is there a deadline driving the sale (1031 exchange, divorce, estate, relocation)? That informs how much negotiation room exists.
- Schools are B-rated — typically a magnet for longer-tenancy family renters. What's the average tenant stay here, and is there a school-zone premium baked into asking?
- The area grade is low — what's the realistic commute time and amenity access for the typical tenant pool here? Any planned neighborhood developments (good or bad) we should know about?
- What's the average days-on-market for RENTAL listings here right now (not sales)? A rising rental-DOM trend means longer vacancies and softer asking-rent achievability than the comps imply.
- What's the recent tenant-quality profile in this submarket — average credit score on applications, eviction rate, late-payment / NSF rate, and stable-employment percentage? A property-management company in the area should have these aggregated.
- How much new for-sale + rental construction is in the pipeline within 1–3 miles? Heavy new supply typically softens prices + rents 12–24 months out; constrained supply supports both.
Investment metrics
- 1% rule
- 0.86% ✗
- Cap rate
- 6.12%
- Cash-on-cash
- -0.61%
- DSCR
- 0.97
- GRM
- 9.7
CMA / ARV
- ARV (on-the-fly)
- $206,094
- Comps found
- 12
Show comp detail 12 sales within ~0.75 mi
| Address | Dist | Beds/Ba | Sqft | Sold | Price | $/sf | Match |
|---|---|---|---|---|---|---|---|
| 3536 Hilts Trl | 0.04mi | 3/2.0 | 1,402 (0%) | 1mo | $221,999 | $158 | 98 |
| 3525 Hilts Trl | 0.08mi | 3/2.0 | 1,402 (0%) | 1mo | $201,999 | $144 | 96 |
| 3529 Hilts Trl | 0.07mi | 3/2.0 | 1,402 (0%) | 1mo | $205,999 | $147 | 96 |
| 3514 Hilts Trl | 0.08mi | 3/2.0 | 1,402 (0%) | 1mo | $200,999 | $143 | 95 |
| 3513 Hilts Trl | 0.10mi | 3/2.0 | 1,402 (0%) | 2mo | $217,999 | $155 | 94 |
| 3522 Hilts Trl | 0.07mi | 3/2.0 | 1,266 (-10%) | 1mo | $189,999 | $150 | 80 |
| 3528 Hilts Trl | 0.05mi | 4/2.0 (+1) | 1,600 (+14%) | 1mo | $212,999 | $133 | 68 |
| 3518 Hilts Trl | 0.07mi | 4/2.0 (+1) | 1,600 (+14%) | 1mo | $213,999 | $134 | 67 |
| 3506 Hilts Trl | 0.10mi | 4/2.0 (+1) | 1,600 (+14%) | 1mo | $209,999 | $131 | 66 |
| 1889 Stonechat | 0.62mi | 3/2.0 | 1,474 (+5%) | 1mo | $209,999 | $142 | 62 |
| 1869 Stonechat | 0.67mi | 3/2.0 | 1,474 (+5%) | 1mo | $216,999 | $147 | 59 |
| 1881 Stonechat | 0.64mi | 3/2.0 | 1,260 (-10%) | 1mo | $208,999 | $166 | 52 |
Match score weights: distance 35% · size 25% · config 20% · recency 20%. Top-matched comps best support the ARV.
Projected returns pro-forma
-3.0% appreciation · 0.0% rent growth · sell at horizon
- IRR
- -20.7%
- Equity multiple
- 0.30×
- Total profit
- $-40,391
- Equity at exit
- $30,715
- IRR
- -22.8%
- Equity multiple
- 0.00×
- Total profit
- $-57,454
- Equity at exit
- $17,811
Cash invested: $57,680 (down + closing). Projections, not guarantees.
Landlord ↔ Tenant lean methodology
- Overall (STATE)
- 87 Strongly Landlord-Friendly
- State Texas
- 87 Strongly Landlord-Friendly · R+5
- County
- — inherits STATE
- City
- — inherits STATE
ZIP-level market 78130
- Rents YoY
- -2.0%
- Active inventory
- 1931
- Price-to-rent
- 9.7×
Monthly cashflow live
- Estimated rent
- $1,765 high interval (Pro) →
- Mortgage (P&I)
- −$1,080
- Tax est. 1.5%
- −$257 /mo · $3,090/yr
- Insurance
- −$86
- HOA
- −$0
- Vacancy / Maint / Mgmt
- −$371
- Net cashflow
- $-29
Break-even live
Sensitivity live
| Price | -10% $113 | -5% $42 | +0% $-29 | +5% $-100 | +10% $-172 |
|---|---|---|---|---|---|
| Rent | -10% $-169 | -5% $-99 | +0% $-29 | +5% $40 | +10% $110 |
| Rate | -1.0pp $74 | -0.5pp $23 | base $-29 | +0.5pp $-83 | +1.0pp $-137 |
UW: 25.0% down · 7.5% · 30yr · 1.5% tax · 5.0% vac · 8.0% maint · 8.0% mgmt
Financing live
Cash to close
- Down payment
- $51,500
- Closing costs
- $6,180
- Reserves months
- —
- Total cash needed
- —
Loan-product check · same deal, 3 products live
Conventional
25% down · 7.5% · 30yr
- Down + closing
- —
- Monthly P&I
- —
- Monthly cashflow
- —
- DSCR
- —
- Eligible?
- —
Personal DTI + credit; lowest rate.
DSCR
20% down · 8.5% · 30yr
- Down + closing
- —
- Monthly P&I
- —
- Monthly cashflow
- —
- DSCR
- —
- Eligible?
- —
No personal income docs; deal must DSCR.
Hard money
10% down · 12.0% · 12mo
- Down + closing
- —
- Monthly P&I
- —
- Monthly cashflow
- —
- DSCR
- —
- Eligible?
- —
Short-term bridge; refi at stabilization.
Rent comps 40 comps
| Address | Beds | Baths | Sqft | Rent | $/sqft | DOM | Units | Dist |
|---|---|---|---|---|---|---|---|---|
| 3514 Hilts Trl New Braunfels, TX | 3.0 | 2.0 | 1402 | $1,695 | $1.21 | 19d | 1 | 0.09mi |
| 3307 Hilts Trl New Braunfels, TX | 3.0 | 2.0 | 1266 | $1,650 | $1.30 | 16d | 1 | 0.20mi |
| 901 Beebrush Ln New Braunfels, TX | 2.0–4.0 | 1.5–3.5 | 1525 | $1,847 | $1.21 | 0d | 129 | 0.22mi |
| 907 Beebrush Ln New Braunfels, TX | 4.0 | 3.0 | 1785 | $1,775 | $0.99 | 0d | 1 | 0.23mi |
| 907 Beebrush Ln New Braunfels, TX | 4.0 | 3.0 | 1785 | $1,775 | $0.99 | 25d | 1 | 0.23mi |
| 905 Beebrush Ln New Braunfels, TX | 3.0 | 2.5 | 1462 | $1,795 | $1.23 | 45d | 1 | 0.23mi |
| 1490 W Klein Rd New Braunfels, TX | 3.0 | 2.0 | 1300 | $1,495 | $1.15 | 45d | 1 | 0.25mi |
| 1211 Foxglove St New Braunfels, TX | 2.0 | 1.0 | 1329 | $1,525 | $1.15 | 25d | 1 | 0.25mi |
| 1211 Foxglove St New Braunfels, TX | 2.0 | 1.0 | 1329 | $1,525 | $1.15 | 0d | 1 | 0.25mi |
| 3230 Mound Rdg New Braunfels, TX | 3.0 | 2.0 | 1402 | $1,595 | $1.14 | 45d | 1 | 0.28mi |
| 957 Beebrush Ln New Braunfels, TX | 3.0 | 2.0 | 1462 | $1,685 | $1.15 | 0d | 1 | 0.31mi |
| 957 Beebrush Ln New Braunfels, TX | 3.0 | 2.0 | 1462 | $1,685 | $1.15 | 25d | 1 | 0.31mi |
| 1422 Copperleaf Ct New Braunfels, TX | 3.0 | 2.0 | 1449 | $1,795 | $1.24 | 45d | 1 | 0.31mi |
| 1422 Copperleaf Ct New Braunfels, TX | 3.0 | 2.0 | 1449 | $1,795 | $1.24 | 0d | 1 | 0.31mi |
| 2924 Whinchat New Braunfels, TX | 3.0 | 2.0 | 1675 | $1,925 | $1.15 | 25d | 1 | 0.34mi |
| 2915 Whinchat Unit N/A Canyon Lake, TX | 3.0 | 2.0 | 1474 | $2,850 | $1.93 | 3d | 1 | 0.37mi |
| 2935 Whinchat New Braunfels, TX | 4.0 | 2.0 | 1648 | $1,700 | $1.03 | 6d | 1 | 0.38mi |
| 2864 Rosefinch New Braunfels, TX | 4.0 | 2.0 | 1667 | $1,750 | $1.05 | 45d | 1 | 0.45mi |
| 2808 Rosefinch New Braunfels, TX | 3.0 | 2.0 | 1216 | $1,650 | $1.36 | 16d | 1 | 0.46mi |
| 2737 Green Finch New Braunfels, TX | 4.0 | 2.0 | 1667 | $1,800 | $1.08 | 16d | 1 | 0.48mi |
| 2815 Rosefinch New Braunfels, TX | 4.0 | 2.0 | 1648 | $1,725 | $1.05 | 6d | 1 | 0.48mi |
| 2766 Rosefinch New Braunfels, TX | 4.0 | 3.0 | 1874 | $1,795 | $0.96 | 18d | 1 | 0.48mi |
| 1941 Stonechat New Braunfels, TX | 3.0 | 2.0 | 1217 | $1,500 | $1.23 | 12d | 1 | 0.56mi |
| 283 Rolling Hls New Braunfels, TX | 4.0 | 2.0 | 1459 | $1,700 | $1.17 | 45d | 1 | 0.60mi |
| 3943 Legend Mdws New Braunfels, TX | 3.0 | 2.0 | 1542 | $1,695 | $1.10 | 0d | 1 | 0.64mi |
| 1881 Stonechat New Braunfels, TX | 3.0 | 2.0 | 1260 | $1,595 | $1.27 | 6d | 1 | 0.66mi |
| 1201 Legend Pass New Braunfels, TX | 3.0 | 2.0 | 1234 | $1,650 | $1.34 | 45d | 1 | 0.69mi |
| 4044 Legend Mdws New Braunfels, TX | 3.0 | 2.0 | 1606 | $1,800 | $1.12 | 0d | 1 | 0.73mi |
| 1837 Stonechat New Braunfels, TX | 3.0 | 2.0 | 1474 | $1,575 | $1.07 | 45d | 1 | 0.75mi |
| 4211 Danforth St New Braunfels, TX | 4.0 | 2.0 | 1585 | $1,800 | $1.14 | 45d | 1 | 0.81mi |
| 2764 Farm to Market Road 1044 Unit 2764 New Braunfels, TX | 3.0 | 2.0 | 1100 | $1,295 | $1.18 | 45d | 1 | 0.83mi |
| 1906 Fieldfare New Braunfels, TX | 3.0 | 2.0 | 1454 | $1,775 | $1.22 | 25d | 1 | 0.83mi |
| 2754 Farm to Market Road 1044 Unit 2754 New Braunfels, TX | 3.0 | 2.0 | 1176 | $1,295 | $1.10 | 45d | 1 | 0.84mi |
| 2754 Farm to Market Road 1044 Unit 1044 New Braunfels, TX | 3.0 | 2.0 | 1176 | $1,295 | $1.10 | 0d | 1 | 0.84mi |
| 2754 Farm to Market Road 1044 New Braunfels, TX | 3.0 | 2.0 | 1176 | $1,295 | $1.10 | 19d | 1 | 0.84mi |
| 4238 Danforth St New Braunfels, TX | 3.0 | 2.5 | 1681 | $1,795 | $1.07 | 45d | 1 | 0.86mi |
| 2744 Farm to Market Road 1044 Unit 1044 New Braunfels, TX | 3.0 | 2.0 | 1176 | $1,295 | $1.10 | 0d | 1 | 0.86mi |
| 2744 Farm to Market Road 1044 New Braunfels, TX | 3.0 | 2.0 | 1176 | $1,295 | $1.10 | 14d | 1 | 0.86mi |
| 1915 Chiffchaff New Braunfels, TX | 3.0 | 2.0 | 1217 | $1,650 | $1.36 | 25d | 1 | 0.89mi |
| 3931 Gentle Mdw New Braunfels, TX | 3.0 | 2.0 | 1698 | $1,861 | $1.10 | 45d | 1 | 0.90mi |
Listing history 6 events
-
2026-06-22price $205,999 Active 6 DOM
-
2026-06-21days on market $205,499 Active 6 DOM
-
2026-06-18days on market $205,499 Active 3 DOM
-
2026-06-17days on market $205,499 Active 2 DOM
-
2026-06-15remarks 419-char remark
-
2026-06-15$205,499 Active 1 DOM
ⓘ Source: listings_history table (triggers on properties + properties_extension) + one-shot
backfill from property_details.listing_events for pre-trigger history.
Climate risk First Street
- Flood 1/10 Low FEMA zone X (unshaded) · 0% chance over 30 yrs
- Wildfire 5/10 Major
- Heat 8/10 Severe 7 d/yr ≥108°F today · 22 d/yr by 30 yrs out
- Wind 8/10 Severe 80% chance of damaging wind over 30 yrs
- Air quality 1/10 Low 0 unhealthy d/yr today · 0 by 30 yrs out
Nearby sold comps map
Loading sold comps map…
Walkable amenities ~0.75 mi
Loading nearby amenities…
Taxation est. · year 1
- Rental income
- $21,180
- − Mortgage interest
- −$11,539
- − Property taxes
- −$3,090
- − Insurance
- −$1,030
- − Repairs & maintenance
- −$1,694
- − Management
- −$1,694
- − Depreciation
- −$5,993
- Taxable loss
- −$3,861
- Est. tax savings @ 24.0%
- +$927
- After-tax cash flow
- $575/yr
For passive investors: Depreciation is non-cash, so a rental often shows a tax loss while cash-flowing — sheltering income. Rental losses are passive: they offset passive income freely, and up to $25,000/yr can offset ordinary (W-2) income if you actively participate and your MAGI is under $100k (phasing out to $0 by $150k); unused losses carry forward. On sale, claimed depreciation is recaptured at up to 25%, and gains may owe capital-gains tax (a 1031 exchange can defer both). Figures are a year-1 estimate at your 24.0% rate — not tax advice; consult a CPA.
Schools (NCES district)
- District
- Comal ISD
- NCES district ID
- 4814730
- Math proficiency
- 57% ▼ -9.00%
- Reading proficiency
- 59% ▼ -2.00%
- Median HH income
- $74,792
- Composite
- 51.79/100
- National rank
- #1671
- State rank
- #58 of 826 in TX
Livability — New Braunfels
- Score
- 83/100
- State rank
- #9
- US rank
- #925
Category grades
Schools grade is shown separately in the Schools card above.
Census & demographics
- County
- Comal County · 206,262 people
- City population
- 144,962
- Metro
- San Antonio-New Braunfels, TX
- Population (ZIP)
- 104,009
- Household income
- $83,064
- Rent vs Own
- Severe rent burden
- 2912.0
Population outlook (Guadalupe County) Hauer SSP2
- Today (2025)
- 196,854 people
- By 2030
- 220,210 · +11.9%
- By 2040
- 268,004 · +36.1%
- By 2050
- 316,333 · +60.7%
- By 2075
- 434,747 · +120.8%
- By 2100
- 520,447 · +164.4%
Race, ethnicity, and origin ACS 2023
- Neighborhood character
- Majority White (58%)
- Race & ethnicity
- White 58% Hispanic / Latino 37% Two or more races 19% Black 2%
- Hispanic origin (detail)
- Mexican 32%
- Common ancestry
- Romanian 2% Lithuanian 2% Slovak 2%
- Foreign-born
- 7% · Canada
- Languages at home
- 78% English-only · Spanish 20% German/W. Germanic 1%
Political lean MEDSL · Guadalupe
- 2024 margin
- Strong R (+29.5) · D 34.8% · R 64.3%
- 2008→2024 swing
- +1.5pp toward D · 2008: -31.0pp · 2024: -29.5pp
- All cycles
- 2024: R+29.5 2020: R+24.2 2016: R+31.8 2012: R+35.1 2008: R+31.0
Not yet ingested
- Civics
- —
Market trends
- HPI YoY
- ▼ -190.61%
- Current HPI
- 173.7128
- Rent YoY
- ▼ -1.97%
- Metro
- San Antonio-New Braunfels, TX
- State GDP YoY
- ▲ 3.95%
- F500 in state
- 110
Industry mix (Fortune 500 HQ in TX)
| Industry | F500 HQs | Revenue |
|---|---|---|
| Energy | 16 | $1,198B |
|
||
| Technology | 5 | $198B |
|
||
| Engineering / Construction | 4 | $72B |
|
||
| Energy Services | 3 | $60B |
|
||
| Utilities | 3 | $41B |
|
||
| Healthcare | 2 | $330B |
|
||
Cash-flow waterfall
monthlySold comps — $/sqft
last 12 mo · ≤1 miLoading sold comps…