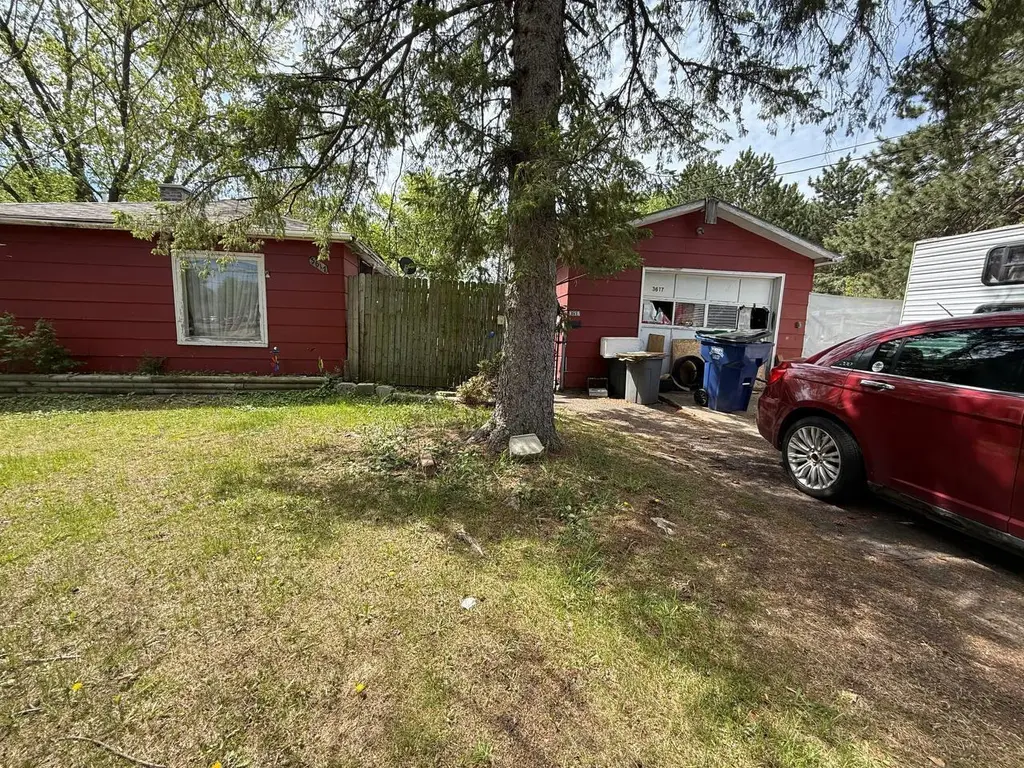
3617 Ross Ave · Weston, WI
Flood risk 4/10 · Minor
- FEMA flood zone
- X (unshaded)
- Chance of flooding over 30 yrs
- 0.22%
- Est. flood insurance / yr
- $507 – $1,088
Fire risk 1/10 · Minimal
- Est. fire insurance / yr
- $636 – $1,182
Heat risk 1/10 · Minimal
- Hot days now (above 94°F)
- 7 days/yr
- Hot days in 30 yrs
- 12 days/yr
Wind risk 1/10 · Minimal
- Chance of severe wind over 30 yrs
- —
Air-quality risk 1/10 · Minimal
- Unhealthy air days now
- 0 days/yr
- Unhealthy air days in 30 yrs
- 0 days/yr
Risk factors via First Street. Map © Google.
Why this score? — see what drove the B- grade
The composite is a weighted blend of 9 inputs, each scored 0–100. Each bar is that input's sub-score; the figure is the points it added to the 100-point composite (weight × sub-score).
- Cash flow +30.0/30.0
- 1% rule +10.0/10.0
- DSCR +10.0/10.0
- ARV discount +7.5/15.0
- Livability +3.6/5.0
- Schools +3.4/10.0
- Rent growth +2.5/5.0
- Condition / age +2.5/5.0
- Appreciation +0.0/10.0
$75,000
🖨 Deal sheet 📄 Offer letter ✓ Due diligence
Listing remarks
Bring your ideas to life with this cozy home full of potential! Functional layout and great opportunity to make your own. This property is perfect for investors or buyers to add their personal touch! Property sold AS IS. Tenant occupied, on a verbal month-month lease.
Key facts
- 0.41 acre lot
- Garage
- Built 1962
Property features AI
Finance
- Other: Tenant/seller personal property excluded from sale
Exterior
- Parking: Detached 1-car garage
- Utilities: Municipal water; Municipal sewer; Natural gas
- Home design: Single-family, one-story home; Construction completed
- Construction: Estimated above-grade finished area about 900; No finished below-grade living area reported
- Exterior features: Cedar exterior; Lot under 1/2 acre (approximately 0.41 acre); Residential zoning
Interior
- Kitchen: Kitchen on the main level (about 10 x 6)
- Bedrooms: Three bedrooms on the main level (each approximately 11 x 10); Master bedroom on the main level (about 11 x 10)
- Bathrooms: One full bathroom
- Heating & cooling: Forced air heating; Window/wall air conditioning; Natural gas heating fuel
- Interior features: Crawl space with block foundation
Neighborhood map
What this means for you Summary
Snapshot
- This is a 3-bed/1.0-bath single-family listed at $75k.
Deal economics
- At list price, monthly cash flow is $554 ($7k/yr) — positive.
- The deal already cash-flows at list — no discount required.
- Meets the 1% rule at list price ($1k rent vs $75k).
- Cap rate 15.2% vs local median 1.7% in Weston — top-decile yield for the area; either an underpriced asset or a hidden risk that comps aren't pricing in. Stress-test before assuming the spread holds.
Location & tenants
- Location reads 71/100 on livability (#263 in WI) — a middle-class / working-renter tenant base. Strengths: cost of living A+, housing A+, employment A-; Watch: schools D+, health & safety D, amenities F.
- D C Everest Area School District (suburban): math 37% / reading 40% proficiency, ranked #160 of 342 in WI (top 47%) — families likely to look elsewhere, expect single-tenant / working-renter base with shorter leases.
- Market conditions: 68 active listings in the ZIP; 1 comparable units currently listed for rent nearby; solid renter incomes; 298 units permitted in Marathon County in 2024 (81 in 5+ unit buildings).
Forward outlook
- Local home prices are declining (-3.0%/yr); year-one equity from $519 of loan paydown is wiped out by about $2k of value loss. Plan a longer hold.
- Marathon County population projected to shrink 6% by 2050 — rents likely to lag national; underwrite the cash flow, not the appreciation.
- At projected returns (-3.0% appreciation + 3.0% rent growth), your $21k cash investment doubles in ~4 years — after that, you're playing with house money.
Negotiation context
- Only 5 days on market — expect competitive offers; lowballing is unlikely to land.
Questions for the listing agent
- Built in 1962 — when were the roof, HVAC, electrical panel, plumbing, and water heater last replaced?
- Is there a deadline driving the sale (1031 exchange, divorce, estate, relocation)? That informs how much negotiation room exists.
- Schools are D-rated, which usually means shorter tenancies and higher turnover. Who's the typical renter profile here, and what's been the actual vacancy rate?
- What's the average days-on-market for RENTAL listings here right now (not sales)? A rising rental-DOM trend means longer vacancies and softer asking-rent achievability than the comps imply.
- What's the recent tenant-quality profile in this submarket — average credit score on applications, eviction rate, late-payment / NSF rate, and stable-employment percentage? A property-management company in the area should have these aggregated.
- How much new for-sale + rental construction is in the pipeline within 1–3 miles? Heavy new supply typically softens prices + rents 12–24 months out; constrained supply supports both.
Investment metrics
- 1% rule
- 1.88% ✓
- Cap rate
- 15.16%
- Cash-on-cash
- 31.68%
- DSCR
- 2.41
- GRM
- 4.4
CMA / ARV
No comps found within radius.
Projected returns pro-forma
-3.0% appreciation · 3.0% rent growth · sell at horizon
- IRR
- 26.6%
- Equity multiple
- 2.10×
- Total profit
- $23,197
- Equity at exit
- $11,183
- IRR
- 34.2%
- Equity multiple
- 4.14×
- Total profit
- $65,844
- Equity at exit
- $6,485
Cash invested: $21,000 (down + closing). Projections, not guarantees.
Landlord ↔ Tenant lean methodology
- Overall (STATE)
- 73 Landlord-Friendly
- State Wisconsin
- 73 Landlord-Friendly · R+2
- County
- — inherits STATE
- City
- — inherits STATE
ZIP-level market 54476
- Home prices YoY
- -33.7%
- Active inventory
- 68
- Price-to-rent
- 4.4×
Monthly cashflow live
- Estimated rent
- $1,407 medium interval (Pro) →
- Mortgage (P&I)
- −$393
- Tax from tax record
- −$132 /mo · $1,587/yr
- Insurance
- −$31
- HOA
- −$0
- Vacancy / Maint / Mgmt
- −$295
- Net cashflow
- $554
Break-even live
UW: 25.0% down · 7.5% · 30yr · 1.5% tax · 5.0% vac · 8.0% maint · 8.0% mgmt
Financing live
Cash to close
- Down payment
- $18,750
- Closing costs
- $2,250
- Reserves months
- —
- Total cash needed
- —
Loan-product check · same deal, 3 products live
Conventional
25% down · 7.5% · 30yr
- Down + closing
- —
- Monthly P&I
- —
- Monthly cashflow
- —
- DSCR
- —
- Eligible?
- —
Personal DTI + credit; lowest rate.
DSCR
20% down · 8.5% · 30yr
- Down + closing
- —
- Monthly P&I
- —
- Monthly cashflow
- —
- DSCR
- —
- Eligible?
- —
No personal income docs; deal must DSCR.
Hard money
10% down · 12.0% · 12mo
- Down + closing
- —
- Monthly P&I
- —
- Monthly cashflow
- —
- DSCR
- —
- Eligible?
- —
Short-term bridge; refi at stabilization.
Rent comps 1 comps
| Address | Beds | Baths | Sqft | Rent | $/sqft | DOM | Units | Dist |
|---|---|---|---|---|---|---|---|---|
| 6001 Alderson St Schofield, WI | 3.0 | 1.0 | 582 | $2,275 | $3.91 | 43d | 5 | 0.85mi |
Listing history 4 events
-
2026-06-07statusdays on market $75,000 Pending 5 DOM
-
2026-06-05days on market $75,000 Active 2 DOM
-
2026-06-03remarks 268-char remark
-
2026-06-03$75,000 Active 1 DOM
ⓘ Source: listings_history table (triggers on properties + properties_extension) + one-shot
backfill from property_details.listing_events for pre-trigger history.
Tax reassessment forecast WI · Partial reset (capped growth)
- Current annual tax
- $1,587 · $132/mo
- Projected year-2 tax
- $1,587 · $132/mo
- Expected delta
- $0/yr ($0/mo · 0.0%)
ⓘ Screening estimate from a state-policy table — verify with the county assessor before closing.
Climate risk First Street
- Flood 4/10 Moderate FEMA zone X (unshaded) · 22% chance over 30 yrs
- Wildfire 1/10 Low
- Heat 1/10 Low 7 d/yr ≥94°F today · 12 d/yr by 30 yrs out
- Wind 1/10 Low
- Air quality 1/10 Low 0 unhealthy d/yr today · 0 by 30 yrs out
Nearby sold comps map
Loading sold comps map…
Walkable amenities ~0.75 mi
Loading nearby amenities…
Taxation est. · year 1
- Rental income
- $16,878
- − Mortgage interest
- −$4,201
- − Property taxes
- −$1,587
- − Insurance
- −$375
- − Repairs & maintenance
- −$1,350
- − Management
- −$1,350
- − Depreciation
- −$2,182
- Taxable income
- $5,833
- Est. tax owed @ 24.0%
- −$1,400
- After-tax cash flow
- $5,252/yr
For passive investors: Depreciation is non-cash, so a rental often shows a tax loss while cash-flowing — sheltering income. Rental losses are passive: they offset passive income freely, and up to $25,000/yr can offset ordinary (W-2) income if you actively participate and your MAGI is under $100k (phasing out to $0 by $150k); unused losses carry forward. On sale, claimed depreciation is recaptured at up to 25%, and gains may owe capital-gains tax (a 1031 exchange can defer both). Figures are a year-1 estimate at your 24.0% rate — not tax advice; consult a CPA.
Schools (NCES district)
- District
- D C Everest Area School District
- NCES district ID
- 5513170
- Math proficiency
- 37% ▼ -5.00%
- Reading proficiency
- 40% ▼ -2.00%
- Median HH income
- $59,328
- Composite
- 34.14/100
- National rank
- #5284
- State rank
- #160 of 342 in WI
Livability — Weston
- Score
- 71/100
- State rank
- #263
- US rank
- #6727
Category grades
Schools grade is shown separately in the Schools card above.
Census & demographics
- Census place
- Weston, WI
- County
- Marathon County · 76,019 people
- City population
- 19,377
- Metro
- Wausau-Weston, WI
- Population (ZIP)
- 19,377
- Household income
- $78,079
- Rent vs Own
- Severe rent burden
- 493.0
Population outlook (Marathon County) Hauer SSP2
- Today (2025)
- 138,030 people
- By 2030
- 138,087 · +0.0%
- By 2040
- 135,688 · -1.7%
- By 2050
- 129,390 · -6.3%
- By 2075
- 110,912 · -19.6%
- By 2100
- 85,136 · -38.3%
Race, ethnicity, and origin ACS 2023
- Neighborhood character
- Predominantly White (84%)
- Race & ethnicity
- White 84% Asian 9% Two or more races 5% Hispanic / Latino 2% Black 2%
- Common ancestry
- Romanian 18% Portuguese 5% Iranian 2%
- Foreign-born
- 6% · Canada, China
- Languages at home
- 93% English-only · Other Asian/Pacific 3% Other Indo-European 2% Spanish 1%
Political lean MEDSL · Marathon
- 2024 margin
- R (+18.7) · D 40.1% · R 58.7% · Other 1.2%
- 2008→2024 swing
- -27.5pp toward R · 2008: 8.9pp · 2024: -18.7pp
- All cycles
- 2024: R+18.7 2020: R+18.0 2016: R+18.2 2012: R+6.1 2008: D+8.9
Not yet ingested
- Civics
- —
Market trends
- HPI YoY
- ▼ -105.33%
- Current HPI
- 206.859
- Rent YoY
- —
- Metro
- Wausau-Weston, WI
- State GDP YoY
- ▲ 2.10%
- F500 in state
- 20
Industry mix (Fortune 500 HQ in WI)
| Industry | F500 HQs | Revenue |
|---|---|---|
| Industrial Machinery | 4 | $23B |
|
||
| Industrial Technology | 2 | $36B |
|
||
| Insurance | 1 | $36B |
|
||
| Professional Services | 1 | $19B |
|
||
| Utilities | 1 | $9B |
|
||
| Consumer Goods | 1 | $3B |
|
||
Price history
1 event — show timeline
- 2026-06-02 Listed $75,000 RANW
Property tax history
-1.0%/yrLatest (2025): $1,587 · +6.3% YoY. Source: county tax records.
Cash-flow waterfall
monthlySold comps — $/sqft
last 12 mo · ≤1 miLoading sold comps…