670 Calabash Rd NW · Carolina Shores, NC
Flood risk 5/10 · Moderate
- FEMA flood zone
- X (unshaded)
- Chance of flooding over 30 yrs
- 0.51%
- Est. flood insurance / yr
- $507 – $1,088
Fire risk 3/10 · Minor
- Est. fire insurance / yr
- $906 – $1,684
Heat risk 9/10 · Severe
- Hot days now (above 105°F)
- 7 days/yr
- Hot days in 30 yrs
- 18 days/yr
Wind risk 8/10 · Major
- Chance of severe wind over 30 yrs
- 99.0%
Air-quality risk 2/10 · Minimal
- Unhealthy air days now
- 1 days/yr
- Unhealthy air days in 30 yrs
- 1 days/yr
Risk factors via First Street. Map © Google.
Why this score? — see what drove the B- grade
The composite is a weighted blend of 9 inputs, each scored 0–100. Each bar is that input's sub-score; the figure is the points it added to the 100-point composite (weight × sub-score).
- Cash flow +30.0/30.0
- 1% rule +10.0/10.0
- DSCR +10.0/10.0
- ARV discount +7.5/15.0
- Schools +3.9/10.0
- Livability +3.2/5.0
- Rent growth +2.5/5.0
- Condition / age +2.5/5.0
- Appreciation +0.0/10.0
$155,000
🖨 Deal sheet 📄 Offer letter ✓ Due diligence
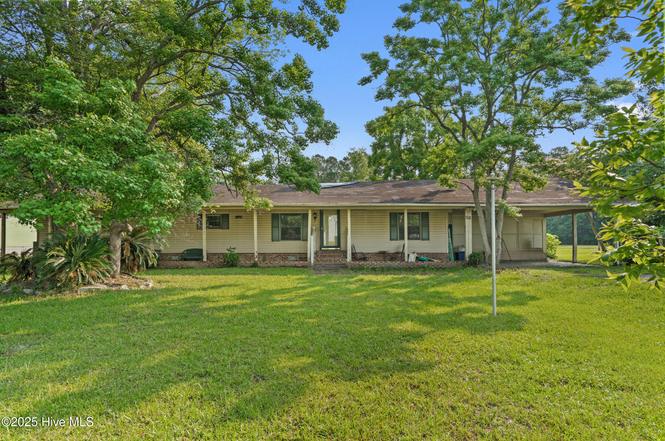
Listing remarks
Every property tells a story, and this one is ready for its next chapter. This manufactured home needs significant renovation and will require vision and effort to bring it back to life. Or, remove the SWMH and build your beach retreat. Situated on approximately 0.50 acres, the property will be combined at closing with an additional 1.05± acres from an adjoining tract, offering a total of about 1.55± acres. Conveniently located just minutes from the South Brunswick Island beaches and close to shopping, dining, and local attractions, it also offers easy access to the South Carolina state line. With no HOA restrictions, you have the freedom to create a property that fits your ne
Key facts
- County water
- Open space
- Coastal retreat
Tags
Property features AI
Finance
- Financial info: Annual tax amount available
Exterior
- Parking: Attached garage; Carport (1 space); Unpaved parking
- Utilities: Water available; Paved road access; Road frontage: city street and state road; Zoning: Co-R-7500
- Home design: Manufactured home; One level; Entry level: 1
- Construction: Shingle roof; Construction and foundation: see remarks
- Exterior features: Covered porch; Porch; No fencing; Has a view
Interior
- Kitchen: Electric oven
- Bedrooms: Total rooms: 7
- Bathrooms: 2 full bathrooms
- Heating & cooling: Electric heating; Heat pump; Central air conditioning
- Interior features: Walk-in closets; Unfurnished
- Laundry & utility: Electric water heater
Neighborhood map
What this means for you Summary
Snapshot
- This is a 3-bed/2.0-bath manufactured listed at $155k.
Deal economics
- At list price, monthly cash flow is $936 ($11k/yr) — positive.
- The deal already cash-flows at list — no discount required.
- Meets the 1% rule at list price ($2k rent vs $155k).
- Recommended offer: $136k (12.0% below list) — sets the bar for market timing.
- Cap rate 13.5% vs local median 3.9% in Carolina Shores — top-decile yield for the area; either an underpriced asset or a hidden risk that comps aren't pricing in. Stress-test before assuming the spread holds.
Location & tenants
- Location reads 64/100 on livability (#352 in NC) — a middle-class / working-renter tenant base. Strengths: housing A+, crime A, cost of living B+; Watch: health & safety D, amenities F, commute F.
- Brunswick County Schools (rural): math 45% / reading 47% proficiency, ranked #82 of 178 in NC (top 46%) — families likely to look elsewhere, expect single-tenant / working-renter base with shorter leases.
- Zoned schools: Jessie Mae Monroe Elementary (math 43% / reading 41%, grade F, #633 of 1,410 statewide, top 48%, 394 students, 99% FRL); Shallotte Middle (math 40% / reading 50%, grade D, #160 of 475 statewide, top 35%, 674 students, 100% FRL); West Brunswick High (math 50% / reading 56%, grade C-, #281 of 535 statewide, top 53%, 1,526 students, 100% FRL) — zoned schools average 100% FRL vs 53% district-wide (46 pts higher); higher-poverty schools than district average — tighter screening recommended.
- Market conditions: 691 active listings in the ZIP; 6 comparable units currently listed for rent nearby; rentals at typical pace (median 22d on market — plan ~3-4 weeks tenant-placement turnaround); solid renter incomes; 6,112 units permitted in Brunswick County in 2024 (990 in 5+ unit buildings).
- This rent runs 38% of the median local income ($75k/yr) — at the standard rent-burdened threshold; future hikes will face affordability resistance.
Forward outlook
- Local home prices are declining (-3.0%/yr); year-one equity from $1k of loan paydown is wiped out by about $5k of value loss. Plan a longer hold.
- Brunswick County population projected at +36% by 2050 — long-run rental-demand tailwind backs the buy-and-hold thesis.
- At projected returns (-3.0% appreciation + 3.0% rent growth), your $43k cash investment doubles in ~5 years — after that, you're playing with house money.
Negotiation context
- It's been on market 263 days — a 12% lower offer ($136k) is reasonable based on typical stale-listing flexibility.
Risks & watch-outs
- Climate carrying-cost: moderate flood risk; severe wind risk, 99% chance of damaging wind over 30y; extreme-heat days projected 7→18/yr by 2055 (HVAC capex compounding) — expect insurance premiums to compound above CPI over the hold.
Questions for the listing agent
- It's been on market 263 days. Have you received any prior offers? Is the seller open to a 12% concession, seller financing, or rate buy-down credit?
- Built in 1974 — when were the roof, HVAC, electrical panel, plumbing, and water heater last replaced?
- Why hasn't it sold? Are there any deal-killer items the seller is aware of (foundation, flood, title, zoning, code violations)?
- Is there a deadline driving the sale (1031 exchange, divorce, estate, relocation)? That informs how much negotiation room exists.
- Schools are F-rated, which usually means shorter tenancies and higher turnover. Who's the typical renter profile here, and what's been the actual vacancy rate?
- What's the average days-on-market for RENTAL listings here right now (not sales)? A rising rental-DOM trend means longer vacancies and softer asking-rent achievability than the comps imply.
- What's the recent tenant-quality profile in this submarket — average credit score on applications, eviction rate, late-payment / NSF rate, and stable-employment percentage? A property-management company in the area should have these aggregated.
- How much new for-sale + rental construction is in the pipeline within 1–3 miles? Heavy new supply typically softens prices + rents 12–24 months out; constrained supply supports both.
Investment metrics
- 1% rule
- 1.53% ✓
- Cap rate
- 13.54%
- Cash-on-cash
- 25.89%
- DSCR
- 2.15
- GRM
- 5.4
CMA / ARV
No comps found within radius.
Projected returns pro-forma
-3.0% appreciation · 3.0% rent growth · sell at horizon
- IRR
- 19.5%
- Equity multiple
- 1.79×
- Total profit
- $34,482
- Equity at exit
- $23,111
- IRR
- 27.8%
- Equity multiple
- 3.46×
- Total profit
- $106,640
- Equity at exit
- $13,402
Cash invested: $43,400 (down + closing). Projections, not guarantees.
Landlord ↔ Tenant lean methodology
- Overall (STATE)
- 85 Strongly Landlord-Friendly
- State North Carolina
- 85 Strongly Landlord-Friendly · R+3
- County
- — inherits STATE
- City
- — inherits STATE
ZIP-level market 28467
- Home prices YoY
- -33.7%
- Active inventory
- 691
- Price-to-rent
- 5.4×
Monthly cashflow live
- Estimated rent
- $2,372 high interval (Pro) →
- Mortgage (P&I)
- −$813
- Tax from tax record
- −$60 /mo · $719/yr
- Insurance
- −$65
- HOA
- −$0
- Vacancy / Maint / Mgmt
- −$498
- Net cashflow
- $936
Break-even live
UW: 25.0% down · 7.5% · 30yr · 1.5% tax · 5.0% vac · 8.0% maint · 8.0% mgmt
Financing live
Cash to close
- Down payment
- $38,750
- Closing costs
- $4,650
- Reserves months
- —
- Total cash needed
- —
Loan-product check · same deal, 3 products live
Conventional
25% down · 7.5% · 30yr
- Down + closing
- —
- Monthly P&I
- —
- Monthly cashflow
- —
- DSCR
- —
- Eligible?
- —
Personal DTI + credit; lowest rate.
DSCR
20% down · 8.5% · 30yr
- Down + closing
- —
- Monthly P&I
- —
- Monthly cashflow
- —
- DSCR
- —
- Eligible?
- —
No personal income docs; deal must DSCR.
Hard money
10% down · 12.0% · 12mo
- Down + closing
- —
- Monthly P&I
- —
- Monthly cashflow
- —
- DSCR
- —
- Eligible?
- —
Short-term bridge; refi at stabilization.
Rent comps 6 comps
| Address | Beds | Baths | Sqft | Rent | $/sqft | DOM | Units | Dist |
|---|---|---|---|---|---|---|---|---|
| 570 Tullimore Ln NW Carolina Shores, NC | 4.0 | 3.0 | 2587 | $2,800 | $1.08 | 14d | 1 | 0.30mi |
| 1204 Calabash Station Blvd NW Ocean Isle Beach, NC | 3.0 | 2.0 | 1811 | $2,200 | $1.21 | 23d | 1 | 0.30mi |
| 3021 Siskin Dr NW Calabash, NC | 2.0–3.0 | 2.0–2.5 | 1557 | $2,279 | $1.46 | 14d | 46 | 0.35mi |
| 2042 Parow Ln NW Calabash, NC | 3.0 | 2.5 | 1680 | $1,800 | $1.07 | 14d | 1 | 0.94mi |
| 2033 Wild Indigo CIR NW Calabash, NC | 3.0 | 3.0 | 1457 | $1,775 | $1.22 | 23d | 1 | 0.99mi |
| 31 Quaker Ridge Dr Calabash, NC | 2.0–3.0 | 2.0 | 1411 | $2,292 | $1.62 | 21d | 51 | 1.31mi |
Listing history 9 events
-
2026-06-07statusdays on market $155,000 Pending 263 DOM
-
2026-06-05days on market $155,000 Active 262 DOM
-
2026-06-03days on market $155,000 Active 261 DOM
-
2026-06-02days on market $155,000 Active 260 DOM
-
2026-06-01days on market $155,000 Active 259 DOM
-
2026-05-31days on market $155,000 Active 258 DOM
-
2026-05-30days on market $155,000 Active 257 DOM
-
2026-04-21price $155,000
-
2025-09-15$167,000 Active
ⓘ Source: listings_history table (triggers on properties + properties_extension) + one-shot
backfill from property_details.listing_events for pre-trigger history.
Tax reassessment forecast NC · Resets to sale price
- Current annual tax
- $719 · $60/mo
- Projected year-2 tax
- $1,271 · $106/mo
- Expected delta
- +$552/yr (+$46/mo · 76.9%)
ⓘ Screening estimate from a state-policy table — verify with the county assessor before closing.
Climate risk First Street
- Flood 5/10 Major FEMA zone X (unshaded) · 51% chance over 30 yrs
- Wildfire 3/10 Moderate
- Heat 9/10 Extreme 7 d/yr ≥105°F today · 18 d/yr by 30 yrs out
- Wind 8/10 Severe 99% chance of damaging wind over 30 yrs
- Air quality 2/10 Low 1 unhealthy d/yr today · 1 by 30 yrs out
Nearby sold comps map
Loading sold comps map…
Walkable amenities ~0.75 mi
Loading nearby amenities…
Taxation est. · year 1
- Rental income
- $28,463
- − Mortgage interest
- −$8,682
- − Property taxes
- −$719
- − Insurance
- −$775
- − Repairs & maintenance
- −$2,277
- − Management
- −$2,277
- − Depreciation
- −$4,509
- Taxable income
- $9,223
- Est. tax owed @ 24.0%
- −$2,214
- After-tax cash flow
- $9,024/yr
For passive investors: Depreciation is non-cash, so a rental often shows a tax loss while cash-flowing — sheltering income. Rental losses are passive: they offset passive income freely, and up to $25,000/yr can offset ordinary (W-2) income if you actively participate and your MAGI is under $100k (phasing out to $0 by $150k); unused losses carry forward. On sale, claimed depreciation is recaptured at up to 25%, and gains may owe capital-gains tax (a 1031 exchange can defer both). Figures are a year-1 estimate at your 24.0% rate — not tax advice; consult a CPA.
Schools (NCES district)
- District
- Brunswick County Schools
- NCES district ID
- 3700420
- Math proficiency
- 45% ▲ 4.00%
- Reading proficiency
- 47% ▲ 4.00%
- Median HH income
- $47,494
- Composite
- 39.23/100
- National rank
- #4011
- State rank
- #82 of 178 in NC
Livability — Carolina Shores
- Score
- 64/100
- State rank
- #352
- US rank
- #13907
Category grades
Schools grade is shown separately in the Schools card above.
Census & demographics
- County
- Brunswick County · 131,536 people
- City population
- 13,313
- Metro
- Myrtle Beach-Conway-North Myrtle Beach, SC-NC
- Population (ZIP)
- 13,313
- Household income
- $75,341
- Rent vs Own
- Severe rent burden
- 81.0
Population outlook (Brunswick County) Hauer SSP2
- Today (2025)
- 152,111 people
- By 2030
- 165,705 · +8.9%
- By 2040
- 188,494 · +23.9%
- By 2050
- 206,228 · +35.6%
- By 2075
- 237,876 · +56.4%
- By 2100
- 251,451 · +65.3%
Race, ethnicity, and origin ACS 2023
- Neighborhood character
- Predominantly White (90%)
- Race & ethnicity
- White 90% Two or more races 4% Black 3% Hispanic / Latino 2%
- Common ancestry
- Slovak 5% Romanian 5% Lithuanian 3%
- Foreign-born
- 3% · Canada
- Languages at home
- 98% English-only · Spanish 1%
Political lean MEDSL · Brunswick
- 2024 margin
- Strong R (+24.9) · D 37.2% · R 62.0%
- 2008→2024 swing
- -6.9pp toward R · 2008: -17.9pp · 2024: -24.9pp
- All cycles
- 2024: R+24.9 2020: R+25.0 2016: R+28.7 2012: R+22.2 2008: R+17.9
Not yet ingested
- Civics
- —
Market trends
- HPI YoY
- ▼ -67.90%
- Current HPI
- 133.7186
- Rent YoY
- —
- Metro
- Myrtle Beach-Conway-North Myrtle Beach, SC-NC
- State GDP YoY
- ▲ 3.28%
- F500 in state
- 26
Industry mix (Fortune 500 HQ in NC)
| Industry | F500 HQs | Revenue |
|---|---|---|
| Financial Services | 2 | $213B |
|
||
| Retail | 2 | $95B |
|
||
| Industrial Conglomerate | 1 | $38B |
|
||
| Metals / Steel | 1 | $35B |
|
||
| Utilities | 1 | $30B |
|
||
| Industrial Machinery | 1 | $19B |
|
||
Price history
-7.2% since first listed2 events — show timeline
- 2026-04-21 Price Changed $155,000 Hive MLS
- 2025-09-15 Listed $167,000 Hive MLS
Property tax history
+3.1%/yrLatest (2025): $719 · +0.0% YoY. Source: county tax records.
Cash-flow waterfall
monthlySold comps — $/sqft
last 12 mo · ≤1 miLoading sold comps…