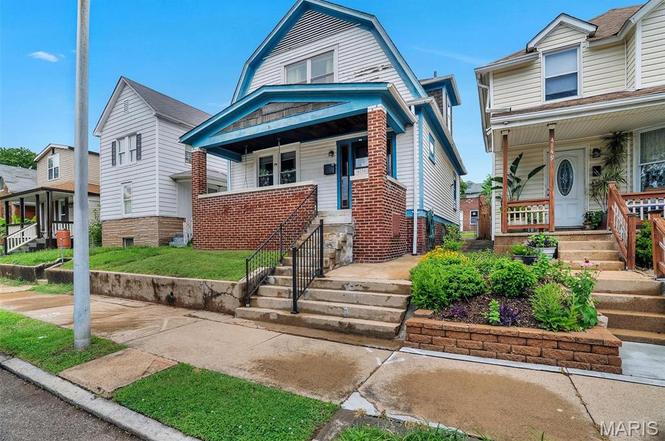
4151 Beethoven Ave · St. Louis, MO
Flood risk 1/10 · Minimal
- FEMA flood zone
- X (unshaded)
- Chance of flooding over 30 yrs
- 0.0%
- Est. flood insurance / yr
- $473 – $860
Fire risk 1/10 · Minimal
- Est. fire insurance / yr
- $1,054 – $1,958
Heat risk 5/10 · Moderate
- Hot days now (above 108°F)
- 7 days/yr
- Hot days in 30 yrs
- 21 days/yr
Wind risk 2/10 · Minimal
- Chance of severe wind over 30 yrs
- 1.0%
Air-quality risk 3/10 · Minor
- Unhealthy air days now
- 3 days/yr
- Unhealthy air days in 30 yrs
- 4 days/yr
Risk factors via First Street. Map © Google.
Why this score? — see what drove the C- grade
The composite is a weighted blend of 9 inputs, each scored 0–100. Each bar is that input's sub-score; the figure is the points it added to the 100-point composite (weight × sub-score).
- Cash flow +17.9/30.0
- ARV discount +15.0/15.0
- DSCR +5.6/10.0
- 1% rule +4.8/10.0
- Rent growth +3.2/5.0
- Livability +2.5/5.0
- Condition / age +2.5/5.0
- Schools +1.2/10.0
- Appreciation +0.0/10.0
$149,900
🖨 Deal sheet (PDF) 📄 Offer letter ✓ Due diligence
Key facts
- 3,598 sq ft lot
- 3 garage spots
- Built 1925
Property features AI
Finance
- HOA & community: Curbs
Exterior
- Parking: Detached garage with 3 garage spaces; Off-street parking; Alley access; Three total parking spaces
- Security: Security system
- Utilities: Public water; Public sewer; Electric service (Ameren); Cable available; Phone available; Electricity available; Water available; Sewer available
- Home design: Single-family house; Two levels; Private ownership; Level lot; Asphalt road frontage on a private road
- Construction: Brick veneer, frame and vinyl siding exterior; Architectural/composition shingle roof; Block foundation; Basement: full, concrete, unfinished with storage space
- Exterior features: Covered front porch; Porch; Entry steps/stairs; Private yard; Rain gutters; Ramped accessible approach; Exterior storage; Back yard chain-link fencing; Lighting
Interior
- Kitchen: Stainless steel appliances; Dishwasher; Microwave; Electric oven; Free-standing gas range; Refrigerator; Walk-in pantry
- Bedrooms: Three bedrooms total — two on the upper level, one on the main level
- Flooring: Carpet; Hardwood; Tile; Vinyl
- Bathrooms: One full bathroom
- Heating & cooling: Forced air heating (natural gas); Central electric air conditioning; Humidifier; Gas water heater
- Interior features: Ceiling fans; Eat-in kitchen; High ceilings; Laminate counters; Walk-in closet(s); Walk-in pantry; Stained glass windows; Window treatments; Decorative masonry fireplace (1)
- Laundry & utility: Washer hookup; Gas dryer hookup; Laundry located in basement
Neighborhood map
What this means for you Summary
Snapshot
- This is a 3-bed/1.0-bath single-family listed at $150k.
Deal economics
- At list price, monthly cash flow is $125 ($2k/yr) — positive.
- The deal already cash-flows at list — no discount required.
- To meet the 1% rule (rent ≥ 1% of price), the offer needs to be $147k (2.2% below list).
- Recommended offer: $147k (2.2% below list) — sets the bar for 1% rule.
- Cap rate 7.3% vs local median 5.0% in St. Louis — top-decile yield for the area; either an underpriced asset or a hidden risk that comps aren't pricing in. Stress-test before assuming the spread holds.
Location & tenants
- Location reads: area grade C — affects rentability + tenant quality, not the cash-flow math above.
- St. Louis City (urban): math 10% / reading 18% proficiency, ranked #312 of 324 in MO (top 96%) — low school quality limits family demand, transient renter base, plan for 1-2y turnover; 80% free/reduced lunch — lower-income household profile, screen leases tightly.
- Zoned schools: Oak Hill Elem. (math 12% / reading 12%, grade F, #1,016 of 1,115 statewide, top 92%, 238 students, 99% FRL); Gateway Middle (math 0% / reading 8%, grade F, #389 of 391 statewide, top 100%, 506 students, 99% FRL); Roosevelt High (math 2% / reading 8%, grade F, #517 of 521 statewide, top 100%, 460 students, 99% FRL) — zoned schools average 99% FRL vs 80% district-wide (19 pts higher); higher-poverty schools than district average — tighter screening recommended.
- Market conditions: Rents rising (+2.6%/yr); 261 active listings in the ZIP; 40 comparable units currently listed for rent nearby; rentals at typical pace (median 26d on market — plan ~3-4 weeks tenant-placement turnaround); 294 units permitted in St. Louis city in 2024 (227 in 5+ unit buildings).
Forward outlook
- Local home prices are declining (-3.0%/yr); year-one equity from $1k of loan paydown is wiped out by about $4k of value loss. Plan a longer hold.
- St. Louis County population projected to shrink 6% by 2050 — rents likely to lag national; underwrite the cash flow, not the appreciation.
Negotiation context
- Only 1 days on market — expect competitive offers; lowballing is unlikely to land.
- Current owner paid $118k; 27% above their basis — modest negotiation headroom, anchor on the comps not their cost.
Risks & watch-outs
- Watch-outs: built in 1925 — expect roof / HVAC / electrical / plumbing capex.
- Climate carrying-cost: extreme-heat days projected 7→21/yr by 2055 (HVAC capex compounding) — expect insurance premiums to compound above CPI over the hold.
Questions for the listing agent
- Built in 1925 — when were the roof, HVAC, electrical panel, plumbing, and water heater last replaced?
- Is there a deadline driving the sale (1031 exchange, divorce, estate, relocation)? That informs how much negotiation room exists.
- What's the average days-on-market for RENTAL listings here right now (not sales)? A rising rental-DOM trend means longer vacancies and softer asking-rent achievability than the comps imply.
- What's the recent tenant-quality profile in this submarket — average credit score on applications, eviction rate, late-payment / NSF rate, and stable-employment percentage? A property-management company in the area should have these aggregated.
- How much new for-sale + rental construction is in the pipeline within 1–3 miles? Heavy new supply typically softens prices + rents 12–24 months out; constrained supply supports both.
Investment metrics
- 1% rule
- 0.98% ✗
- Cap rate
- 7.29%
- Cash-on-cash
- 3.58%
- DSCR
- 1.16
- GRM
- 8.5
CMA / ARV
- ARV (on-the-fly)
- $250,368
- Comps found
- 12
Show comp detail 12 sales within ~0.75 mi
| Address | Dist | Beds/Ba | Sqft | Sold | Price | $/sf | Match |
|---|---|---|---|---|---|---|---|
| 4314 Ellenwood Ave | 0.20mi | 3/1.5 | 1,415 (-8%) | 2mo | $219,900 | $155 | 74 |
| 4426 Beethoven Ave | 0.33mi | 2/1.0 (-1) | 1,565 (+2%) | 3mo | $255,000 | $163 | 74 |
| 4250 Ellenwood Ave | 0.15mi | 4/2.0 (+1) | 1,650 (+7%) | 2mo | $219,000 | $133 | 70 |
| 4436 Miami St | 0.56mi | 2/1.0 (-1) | 1,500 (-2%) | 4mo | $89,000 | $59 | 62 |
| 4359 Tholozan Ave | 0.48mi | 3/1.0 | 1,313 (-14%) | 2mo | $225,000 | $171 | 52 |
| 4009 Delor St | 0.61mi | 3/2.0 | 1,649 (+7%) | 4mo | $279,900 | $170 | 52 |
| 3892 Kingsland Ct | 0.65mi | 3/1.0 | 1,700 (+11%) | 3mo | $224,900 | $132 | 49 |
| 4267 Miami St | 0.50mi | 2/2.0 (-1) | 1,368 (-11%) | 2mo | $149,900 | $110 | 48 |
| 4435 Miami St | 0.58mi | 2/1.0 (-1) | 1,354 (-12%) | 2mo | $199,900 | $148 | 47 |
| 4044 Walsh St | 0.67mi | 3/2.0 | 1,384 (-10%) | 2mo | $244,900 | $177 | 47 |
| 4125 Miami St | 0.55mi | 2/1.0 (-1) | 1,312 (-15%) | 0mo | $250,000 | $191 | 45 |
| 4252 Gertrude Ave | 0.75mi | 4/2.0 (+1) | 1,730 (+13%) | 1mo | $289,900 | $168 | 34 |
Match score weights: distance 35% · size 25% · config 20% · recency 20%. Top-matched comps best support the ARV.
Projected returns pro-forma
-3.0% appreciation · 2.62% rent growth · sell at horizon
- IRR
- -11.1%
- Equity multiple
- 0.60×
- Total profit
- $-16,864
- Equity at exit
- $22,351
- IRR
- -2.4%
- Equity multiple
- 0.84×
- Total profit
- $-6,620
- Equity at exit
- $12,961
Cash invested: $41,972 (down + closing). Projections, not guarantees.
Landlord ↔ Tenant lean methodology
- Overall (STATE)
- 81 Strongly Landlord-Friendly
- State Missouri
- 81 Strongly Landlord-Friendly · R+10
- County
- — inherits STATE
- City
- — inherits STATE
ZIP-level market 63116
- Rents YoY
- 2.6%
- Active inventory
- 261
- Price-to-rent
- 8.5×
Monthly cashflow live
- Estimated rent
- $1,466 high interval (Pro) →
- Mortgage (P&I)
- −$786
- Tax from tax record
- −$184 /mo · $2,211/yr
- Insurance
- −$62
- HOA
- −$0
- Vacancy / Maint / Mgmt
- −$308
- Net cashflow
- $125
Break-even live
Sensitivity live
| Price | -10% $210 | -5% $167 | +0% $125 | +5% $83 | +10% $40 |
|---|---|---|---|---|---|
| Rent | -10% $9 | -5% $67 | +0% $125 | +5% $183 | +10% $241 |
| Rate | -1.0pp $201 | -0.5pp $163 | base $125 | +0.5pp $86 | +1.0pp $47 |
UW: 25.0% down · 7.5% · 30yr · 1.5% tax · 5.0% vac · 8.0% maint · 8.0% mgmt
Financing live
Cash to close
- Down payment
- $37,475
- Closing costs
- $4,497
- Reserves months
- —
- Total cash needed
- —
Loan-product check · same deal, 3 products live
Conventional
25% down · 7.5% · 30yr
- Down + closing
- —
- Monthly P&I
- —
- Monthly cashflow
- —
- DSCR
- —
- Eligible?
- —
Personal DTI + credit; lowest rate.
DSCR
20% down · 8.5% · 30yr
- Down + closing
- —
- Monthly P&I
- —
- Monthly cashflow
- —
- DSCR
- —
- Eligible?
- —
No personal income docs; deal must DSCR.
Hard money
10% down · 12.0% · 12mo
- Down + closing
- —
- Monthly P&I
- —
- Monthly cashflow
- —
- DSCR
- —
- Eligible?
- —
Short-term bridge; refi at stabilization.
Rent comps 40 comps
| Address | Beds | Baths | Sqft | Rent | $/sqft | DOM | Units | Dist |
|---|---|---|---|---|---|---|---|---|
| 4215 Gannett St Unit 1F St. Louis, MO | 2.0 | 1.0 | 1148 | $1,025 | $0.89 | 12d | 1 | 0.26mi |
| 3955 Winnebago St Saint Louis, MO | 2.0 | 1.0 | 1125 | $1,395 | $1.24 | 25d | 1 | 0.55mi |
| 4177 Schiller Pl Saint Louis, MO | 2.0 | 1.0 | 1200 | $1,150 | $0.96 | 25d | 1 | 0.69mi |
| 4645 Wilcox Ave Unit 1st Floor St. Louis, MO | 2.0 | 1.0 | 1150 | $1,375 | $1.20 | 23d | 1 | 0.69mi |
| 4945 Winona Ave Unit 4945A St. Louis, MO | 2.0 | 1.0 | 1150 | $1,200 | $1.04 | 25d | 1 | 0.75mi |
| 5006 Christy Blvd Unit 1st Fl St. Louis, MO | 3.0 | 1.0 | 1100 | $1,450 | $1.32 | 45d | 1 | 0.76mi |
| 4950 Sutherland Ave Unit 1F St. Louis, MO | 2.0 | 1.0 | 1056 | $1,295 | $1.23 | 12d | 1 | 0.78mi |
| 4980 Tholozan Ave Unit 4980A St. Louis, MO | 2.0 | 1.0 | 1100 | $1,395 | $1.27 | 23d | 1 | 0.81mi |
| 4053 Giles Ave Unit A St. Louis, MO | 2.0 | 1.0 | 1082 | $995 | $0.92 | 12d | 1 | 0.82mi |
| 4000 Schiller Pl Saint Louis, MO | 2.0 | 2.5 | 1448 | $1,600 | $1.10 | 0d | 1 | 0.84mi |
| 4222 S 38th St St. Louis, MO | 3.0 | 2.0 | 1836 | $1,400 | $0.76 | 0d | 1 | 0.87mi |
| 4222 S 38th St Unit 4222 St. Louis, MO | 3.0 | 2.0 | 1836 | $1,400 | $0.76 | 22d | 1 | 0.87mi |
| 5046 Winona Ave Unit B St. Louis, MO | 3.0 | 1.0 | 1057 | $1,650 | $1.56 | 21d | 1 | 0.88mi |
| 5970 Wanda Ave Saint Louis, MO | 4.0 | 2.0 | 1282 | $1,995 | $1.56 | 19d | 1 | 0.93mi |
| 3908 McDonald Ave Saint Louis, MO | 3.0 | 2.0 | 1927 | $2,500 | $1.30 | 6d | 1 | 0.94mi |
| 4766 Dahlia Ave Saint Louis, MO | 2.0 | 1.0 | 1184 | $1,695 | $1.43 | 5d | 1 | 0.95mi |
| 3526 S Spring Ave Saint Louis, MO | 4.0 | 2.0 | 2244 | $2,877 | $1.28 | 45d | 1 | 0.95mi |
| 4005 S Grand Blvd Saint Louis, MO | 4.0 | 1.0 | 1323 | $1,150 | $0.87 | 18d | 1 | 0.98mi |
| 5836 Goener Ave Unit 2F St. Louis, MO | 3.0 | 1.0 | 1250 | $1,500 | $1.20 | 45d | 1 | 1.01mi |
| 3637 Meramec St Saint Louis, MO | 3.0 | 1.5 | 1632 | $1,925 | $1.18 | 19d | 1 | 1.02mi |
| 5300 Bancroft Ave Unit A St. Louis, MO | 2.0 | 1.0 | 1404 | $1,295 | $0.92 | 25d | 1 | 1.03mi |
| 3635 Marceline Ter Unit 2ND St. Louis, MO | 3.0 | 1.0 | 1250 | $1,275 | $1.02 | 45d | 1 | 1.04mi |
| 3458 Giles Ave Saint Louis, MO | 3.0 | 2.5 | 2204 | $2,400 | $1.09 | 9d | 1 | 1.07mi |
| 4217 S Grand Blvd Unit 1 St. Louis, MO | 3.0 | 1.0 | 1250 | $1,400 | $1.12 | 6d | 1 | 1.08mi |
| 3161 Alfred Ave St. Louis, MO | 2.0 | 1.0 | 1400 | $1,435 | $1.02 | 16d | 1 | 1.10mi |
| 3428 Dunnica Ave Saint Louis, MO | 2.0 | 1.0 | 1050 | $995 | $0.95 | 45d | 1 | 1.14mi |
| 3430 Grace Ave Unit 3432 St. Louis, MO | 2.0 | 1.0 | 1106 | $1,475 | $1.33 | 45d | 1 | 1.14mi |
| 5616 S Kingshighway Blvd Saint Louis, MO | 3.0 | 2.0 | 1400 | $1,830 | $1.31 | 0d | 1 | 1.15mi |
| 4075 Bowen St Saint Louis, MO | 2.0 | 1.0 | 1200 | $1,200 | $1.00 | 45d | 1 | 1.18mi |
| 5127 Goethe Ave Unit 1st St. Louis, MO | 2.0 | 1.0 | 1325 | $1,450 | $1.09 | 45d | 1 | 1.19mi |
| 5127 Goethe Ave Saint Louis, MO | 2.0 | 1.0 | 1250 | $1,395 | $1.12 | 25d | 1 | 1.19mi |
| 3176 Gustine Ave Apt 1S St. Louis, MO | 3.0 | 1.0 | 1600 | $1,675 | $1.05 | 0d | 1 | 1.22mi |
| 4637 Louisiana Ave Saint Louis, MO | 2.0 | 1.0 | 1104 | $1,175 | $1.06 | 14d | 1 | 1.23mi |
| 4716 Louisiana Ave Unit 2F St. Louis, MO | 2.0 | 1.0 | 1200 | $995 | $0.83 | 45d | 1 | 1.29mi |
| 5185 Goethe Ave Fl 2 St. Louis, MO | 2.0 | 1.0 | 1578 | $1,695 | $1.07 | 45d | 1 | 1.29mi |
| 5185 Goethe Ave Fl 1 St. Louis, MO | 3.0 | 2.0 | 1858 | $2,240 | $1.21 | 45d | 1 | 1.29mi |
| 4135 S Compton Ave Saint Louis, MO | 3.0 | 2.0 | 2104 | $1,600 | $0.76 | 45d | 1 | 1.31mi |
| 4145 S Compton Ave Saint Louis, MO | 3.0 | 2.0 | 1656 | $1,520 | $0.92 | 45d | 1 | 1.32mi |
| 3628 Wyoming St Unit 2F St. Louis, MO | 4.0 | 1.0 | 1700 | $1,950 | $1.15 | 45d | 1 | 1.33mi |
| 5028 Louisiana Ave Saint Louis, MO | 2.0 | 1.0 | 1200 | $1,100 | $0.92 | 45d | 1 | 1.34mi |
Listing history 6 events
-
2026-06-19statusdays on market $149,900 Pending 1 DOM
-
2026-06-18days on market $149,900 Coming Soon 8 DOM
-
2026-06-17days on market $149,900 Coming Soon 7 DOM
-
2026-06-16days on market $149,900 Coming Soon 6 DOM
-
2026-06-15days on market $149,900 Coming Soon 5 DOM
-
2026-06-13$149,900 Coming Soon 3 DOM
ⓘ Source: listings_history table (triggers on properties + properties_extension) + one-shot
backfill from property_details.listing_events for pre-trigger history.
Tax reassessment forecast MO · Resets to sale price
- Current annual tax
- $2,211 · $184/mo
- Projected year-2 tax
- $2,211 · $184/mo
- Expected delta
- $0/yr ($0/mo · 0.0%)
ⓘ Screening estimate from a state-policy table — verify with the county assessor before closing.
Climate risk First Street
- Flood 1/10 Low FEMA zone X (unshaded) · 0% chance over 30 yrs
- Wildfire 1/10 Low
- Heat 5/10 Major 7 d/yr ≥108°F today · 21 d/yr by 30 yrs out
- Wind 2/10 Low 100% chance of damaging wind over 30 yrs
- Air quality 3/10 Moderate 3 unhealthy d/yr today · 4 by 30 yrs out
Nearby sold comps map
Loading sold comps map…
Walkable amenities ~0.75 mi
Loading nearby amenities…
Taxation est. · year 1
- Rental income
- $17,588
- − Mortgage interest
- −$8,397
- − Property taxes
- −$2,211
- − Insurance
- −$750
- − Repairs & maintenance
- −$1,407
- − Management
- −$1,407
- − Depreciation
- −$4,361
- Taxable loss
- −$944
- Est. tax savings @ 24.0%
- +$227
- After-tax cash flow
- $1,727/yr
For passive investors: Depreciation is non-cash, so a rental often shows a tax loss while cash-flowing — sheltering income. Rental losses are passive: they offset passive income freely, and up to $25,000/yr can offset ordinary (W-2) income if you actively participate and your MAGI is under $100k (phasing out to $0 by $150k); unused losses carry forward. On sale, claimed depreciation is recaptured at up to 25%, and gains may owe capital-gains tax (a 1031 exchange can defer both). Figures are a year-1 estimate at your 24.0% rate — not tax advice; consult a CPA.
Schools (NCES district)
- District
- St. Louis City
- NCES district ID
- 2929280
- Math proficiency
- 10% ▼ -6.00%
- Reading proficiency
- 18% ▼ -3.00%
- Median HH income
- $35,685
- Composite
- 11.54/100
- National rank
- #9699
- State rank
- #312 of 324 in MO
Livability — St. Louis
No livability data for this city. (Only ~50 U.S. cities are tracked.)
Census & demographics
- Census place
- St. Louis, MO
- County
- Saint Louis City · 254,015 people
- City population
- 283,259
- Metro
- St. Louis, MO-IL
- Population (ZIP)
- 42,170
- Household income
- $61,433
- Rent vs Own
- Severe rent burden
- 1923.0
Population outlook (St. Louis County) Hauer SSP2
- Today (2025)
- 315,737 people
- By 2030
- 313,865 · -0.6%
- By 2040
- 305,439 · -3.3%
- By 2050
- 296,529 · -6.1%
- By 2075
- 271,028 · -14.2%
- By 2100
- 255,359 · -19.1%
Race, ethnicity, and origin ACS 2023
- Neighborhood character
- Diverse neighborhood (Simpson 0.63)
- Race & ethnicity
- White 54% Black 27% Hispanic / Latino 10% Two or more races 8% Asian 5%
- Hispanic origin (detail)
- Mexican 7%
- Common ancestry
- Lithuanian 4% Romanian 2% Italian 2%
- Foreign-born
- 11% · Canada, Vietnam, Philippines
- Languages at home
- 85% English-only · Spanish 6% Vietnamese 2% Arabic 2%
Political lean MEDSL · St. Louis
- 2024 margin
- Solid D (+64.7) · D 81.4% · R 16.7% · Other 2.0%
- 2008→2024 swing
- -3.5pp toward R · 2008: 68.2pp · 2024: 64.7pp
- All cycles
- 2024: D+64.7 2020: D+66.2 2016: D+63.7 2012: D+66.6 2008: D+68.2
Not yet ingested
- Civics
- —
Market trends
- HPI YoY
- ▼ -271.19%
- Current HPI
- 215.7108
- Rent YoY
- ▲ 2.62%
- Metro
- St. Louis, MO-IL
- State GDP YoY
- ▲ 1.84%
- F500 in state
- 20
Industry mix (Fortune 500 HQ in MO)
| Industry | F500 HQs | Revenue |
|---|---|---|
| Healthcare | 1 | $163B |
|
||
| Insurance | 1 | $21B |
|
||
| Industrial Technology | 1 | $17B |
|
||
| Retail | 1 | $16B |
|
||
| Industrial Distribution | 1 | $10B |
|
||
| Utilities | 1 | $9B |
|
||
Price history
+27.0% since first listed2 events — show timeline
- 2026-06-10 Coming Soon $149,900 MARIS as Distributed by MLS Grid
- 2010-05-14 Sold (Public Records) $118,000 Public Records
Property tax history
+5.5%/yrLatest (2024): $2,211 · +5.1% YoY. Source: county tax records.
Cash-flow waterfall
monthlySold comps — $/sqft
last 12 mo · ≤1 miLoading sold comps…