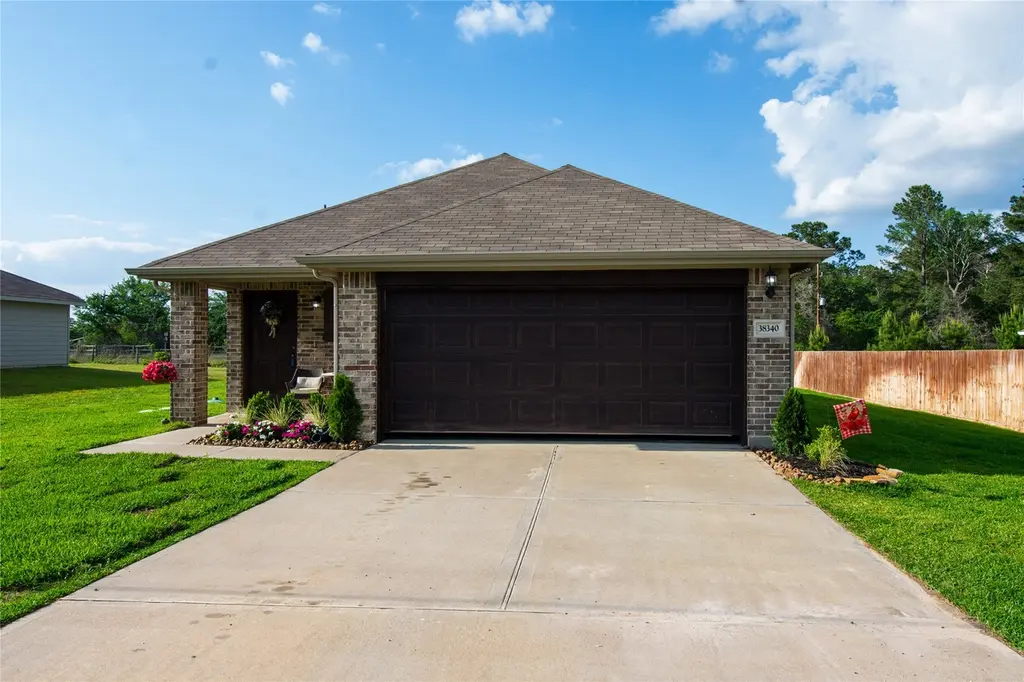
38340 Park View Dr · Hempstead, TX
Flood risk 1/10 · Minimal
- FEMA flood zone
- X (unshaded)
- Chance of flooding over 30 yrs
- 0.0%
- Est. flood insurance / yr
- $507 – $1,088
Fire risk 4/10 · Minor
- Est. fire insurance / yr
- $1,222 – $2,270
Heat risk 8/10 · Major
- Hot days now (above 111°F)
- 7 days/yr
- Hot days in 30 yrs
- 23 days/yr
Wind risk 8/10 · Major
- Chance of severe wind over 30 yrs
- 99.0%
Air-quality risk 2/10 · Minimal
- Unhealthy air days now
- 1 days/yr
- Unhealthy air days in 30 yrs
- 1 days/yr
Risk factors via First Street. Map © Google.
Why this score? — see what drove the D- grade
The composite is a weighted blend of 9 inputs, each scored 0–100. Each bar is that input's sub-score; the figure is the points it added to the 100-point composite (weight × sub-score).
- Appreciation +10.0/10.0
- ARV discount +7.6/15.0
- Cash flow +6.8/30.0
- Livability +3.0/5.0
- Schools +2.9/10.0
- Rent growth +2.5/5.0
- Condition / age +2.5/5.0
- 1% rule +1.9/10.0
- DSCR +1.0/10.0
$275,000
🖨 Deal sheet 📄 Offer letter ✓ Due diligence
Listing remarks MLS
Gated community in the Country but close enough to Houston and Waller area. Come build your dream home here, where its still peaceful and quiet. No mobile homes allowed. Buyer to verify with HOA plans for building, permits required and restrictions.
Key facts
- Gated community
- Open floor plan
- Community pool
Tags
Property features AI
Finance
- HOA & community: Deerwood Lakes Association; Association fee $122 semi-annually; HOA amenities include clubhouse, common areas and recreation facilities; Community pool
Exterior
- Parking: Attached garage with 2 spaces
- Security: Gated community
- Utilities: Public water; Public sewer and aerobic septic
- Home design: Residential property; Built in 2021; Slab foundation
- Construction: Brick and cement siding exterior; Composition roof
- Exterior features: Lot approximately 0.2755 acres (about 12,001 sq ft); Lot described as Other
Interior
- Kitchen: Dishwasher; Electric oven; Electric range; Microwave; Garbage disposal
- Bedrooms: Primary bedroom on the first floor (approx. 12 x 14); Bedroom on the first floor (approx. 11 x 10); Bedroom on the first floor (approx. 11 x 10)
- Bathrooms: 2 full bathrooms
- Heating & cooling: Central heating (electric); Central air conditioning (electric)
- Interior features: Dishwasher; Electric oven; Electric range; Garbage disposal; Microwave
Neighborhood map
What this means for you Summary
Snapshot
- This is a 3-bed/2.0-bath single-family listed at $275k.
Deal economics
- At list price, monthly cash flow is $-433 ($-5k/yr) — negative.
- To cash-flow at today's rent, offer at most $199k (27.8% below list).
- To meet the 1% rule (rent ≥ 1% of price), the offer needs to be $190k (30.9% below list).
- Recommended offer: $190k (30.9% below list) — sets the bar for 1% rule.
- Cap rate 4.4% vs local median 2.3% in Hempstead — top-decile yield for the area; either an underpriced asset or a hidden risk that comps aren't pricing in. Stress-test before assuming the spread holds.
Location & tenants
- Location reads 60/100 on livability (#1,099 in TX) — a middle-class / working-renter tenant base. Strengths: cost of living A+, housing A+; Watch: crime D+, employment D, amenities F.
- Waller ISD (rural): math 30% / reading 35% proficiency, ranked #532 of 826 in TX (top 64%) — families likely to look elsewhere, expect single-tenant / working-renter base with shorter leases.
- Zoned schools: Fields Store El (math 47% / reading 43%, grade D-, #1,133 of 4,322 statewide, top 27%, 663 students, 63% FRL); Waller H S (math 25% / reading 40%, grade F, #1,029 of 1,632 statewide, top 64%, 2,639 students, 62% FRL) — zoned schools at 62% FRL track the district average.
- Market conditions: 422 active listings in the ZIP; 1 comparable units currently listed for rent nearby; 483 units permitted in Waller County in 2024 (89 in 5+ unit buildings).
Forward outlook
- In year one you build about $29k of equity ($2k loan paydown + $28k appreciation (10.0% local appreciation)).
- Waller County population projected at +62% by 2050 — long-run rental-demand tailwind backs the buy-and-hold thesis.
- By year 2, paydown + projected appreciation supports a ~$47k cash-out refi (75% LTV) — recoverable capital for the next deal without selling this one.
Negotiation context
- It's been on market 52 days — a 3% lower offer ($267k) is reasonable based on typical stale-listing flexibility.
- 2 sale attempts since 5y ago with the ask held roughly flat each time — persistent listings suggest the price (not the market) is what's stuck; bring a comps-based counter.
Risks & watch-outs
- Climate carrying-cost: severe wind risk, 99% chance of damaging wind over 30y; extreme-heat days projected 7→23/yr by 2055 (HVAC capex compounding) — expect insurance premiums to compound above CPI over the hold.
Questions for the listing agent
- What do current leases actually rent for vs. the listed asking? Can we see a recent rent roll and the last 12 months of T-12 income?
- It's been on market 52 days. Have you received any prior offers? Is the seller open to a 31% concession, seller financing, or rate buy-down credit?
- What does the HOA fee cover, when was the last increase, and are there any pending special assessments or reserve-fund shortfalls?
- Is there a deadline driving the sale (1031 exchange, divorce, estate, relocation)? That informs how much negotiation room exists.
- Schools are F-rated, which usually means shorter tenancies and higher turnover. Who's the typical renter profile here, and what's been the actual vacancy rate?
- Crime grade is D in this area — have there been break-ins, vandalism, or insurance claims at this property in the last 3 years? What carrier currently insures it and at what premium?
- The area grade is low — what's the realistic commute time and amenity access for the typical tenant pool here? Any planned neighborhood developments (good or bad) we should know about?
- What's the average days-on-market for RENTAL listings here right now (not sales)? A rising rental-DOM trend means longer vacancies and softer asking-rent achievability than the comps imply.
- What's the recent tenant-quality profile in this submarket — average credit score on applications, eviction rate, late-payment / NSF rate, and stable-employment percentage? A property-management company in the area should have these aggregated.
- How much new for-sale + rental construction is in the pipeline within 1–3 miles? Heavy new supply typically softens prices + rents 12–24 months out; constrained supply supports both.
Investment metrics
- 1% rule
- 0.69% ✗
- Cap rate
- 4.40%
- Cash-on-cash
- -6.75%
- DSCR
- 0.70
- GRM
- 12.1
CMA / ARV
- ARV (median comp)
- $275,533
- List price
- $275,000
- Delta
- -0.19%
- Verdict
- FAIR
- Comps
- 20 within 1.0 mi
Show comp detail 8 sales within ~0.75 mi
| Address | Dist | Beds/Ba | Sqft | Sold | Price | $/sf | Match |
|---|---|---|---|---|---|---|---|
| 38466 Park View Dr | 0.12mi | 3/2.0 | 1,517 (+2%) | 1mo | $289,000 | $191 | 90 |
| 29522 Loch Ness Dr | 0.16mi | 3/2.0 | 1,532 (+3%) | 7mo | $209,999 | $137 | 82 |
| 26776 Fawn Dr | 0.15mi | 4/2.0 (+1) | 1,582 (+6%) | 9mo | $315,000 | $199 | 70 |
| 26533 Deerwood Dr | 0.50mi | 3/2.0 | 1,488 (-0%) | 15mo | $297,000 | $200 | 64 |
| 26449 Lakeshore Dr | 0.36mi | 3/2.0 | 1,638 (+10%) | 10mo | $262,900 | $161 | 58 |
| 26758 Callie Dr | 0.43mi | 3/2.0 | 1,568 (+5%) | 22mo | $300,000 | $191 | 53 |
| 26447 Pin Oak Dr | 0.46mi | 4/2.0 (+1) | 1,537 (+3%) | 23mo | $259,900 | $169 | 49 |
| 26702 Callie Dr | 0.47mi | 4/2.0 (+1) | 1,683 (+13%) | 4mo | $309,000 | $184 | 48 |
Match score weights: distance 35% · size 25% · config 20% · recency 20%. Top-matched comps best support the ARV.
Projected returns pro-forma
10.0% appreciation · 3.0% rent growth · sell at horizon
- IRR
- 19.5%
- Equity multiple
- 2.59×
- Total profit
- $122,243
- Equity at exit
- $247,742
- IRR
- 17.9%
- Equity multiple
- 5.96×
- Total profit
- $381,771
- Equity at exit
- $534,265
Cash invested: $77,000 (down + closing). Projections, not guarantees.
Landlord ↔ Tenant lean methodology
- Overall (STATE)
- 87 Strongly Landlord-Friendly
- State Texas
- 87 Strongly Landlord-Friendly · R+5
- County
- — inherits STATE
- City
- — inherits STATE
ZIP-level market 77445
- Home prices YoY
- 12.3%
- Active inventory
- 422
- Price-to-rent
- 12.1×
Monthly cashflow live
- Estimated rent
- $1,900 medium interval (Pro) →
- Mortgage (P&I)
- −$1,442
- Tax from tax record
- −$357 /mo · $4,288/yr
- Insurance
- −$115
- HOA
- −$20
- Vacancy / Maint / Mgmt
- −$399
- Net cashflow
- $-433
Break-even live
UW: 25.0% down · 7.5% · 30yr · 1.5% tax · 5.0% vac · 8.0% maint · 8.0% mgmt
Financing live
Cash to close
- Down payment
- $68,750
- Closing costs
- $8,250
- Reserves months
- —
- Total cash needed
- —
Loan-product check · same deal, 3 products live
Conventional
25% down · 7.5% · 30yr
- Down + closing
- —
- Monthly P&I
- —
- Monthly cashflow
- —
- DSCR
- —
- Eligible?
- —
Personal DTI + credit; lowest rate.
DSCR
20% down · 8.5% · 30yr
- Down + closing
- —
- Monthly P&I
- —
- Monthly cashflow
- —
- DSCR
- —
- Eligible?
- —
No personal income docs; deal must DSCR.
Hard money
10% down · 12.0% · 12mo
- Down + closing
- —
- Monthly P&I
- —
- Monthly cashflow
- —
- DSCR
- —
- Eligible?
- —
Short-term bridge; refi at stabilization.
Rent comps 1 comps
| Address | Beds | Baths | Sqft | Rent | $/sqft | DOM | Units | Dist |
|---|---|---|---|---|---|---|---|---|
| 26579 Pin Oak Dr Hempstead, TX | 3.0 | 2.0 | 1750 | $1,900 | $1.09 | 1d | 1 | 0.42mi |
HOA detail
- Monthly dues
- $20 · $240/yr
- Likely covers
- security
Listing history 18 events
-
2026-06-18days on market $275,000 Active 52 DOM
-
2026-06-17days on market $275,000 Active 51 DOM
-
2026-06-16days on market $275,000 Active 50 DOM
-
2026-06-15days on market $275,000 Active 49 DOM
-
2026-06-13days on market $275,000 Active 47 DOM
-
2026-06-09days on market $275,000 Active 43 DOM
-
2026-06-08days on market $275,000 Active 42 DOM
-
2026-06-07days on market $275,000 Active 41 DOM
-
2026-06-04days on market $275,000 Active 38 DOM
-
2026-06-03days on market $275,000 Active 37 DOM
-
2026-06-02days on market $275,000 Active 36 DOM
-
2026-06-01days on market $275,000 Active 35 DOM
-
2026-05-31days on market $275,000 Active 34 DOM
-
2026-04-27$275,000 Active 950-char remark
-
2022-05-18soldstatus
-
2021-06-30soldstatus Sold 249-char remark
Show marketing remark (249 chars)
Gated community in the Country but close enough to Houston and Waller area. Come build your dream home here, where its still peaceful and quiet. No mobile homes allowed. Buyer to verify with HOA plans for building, permits required and restrictions.
-
2021-04-23status Pending 249-char remark
Show marketing remark (249 chars)
Gated community in the Country but close enough to Houston and Waller area. Come build your dream home here, where its still peaceful and quiet. No mobile homes allowed. Buyer to verify with HOA plans for building, permits required and restrictions.
-
2021-04-16$150,000 Active 249-char remark
Show marketing remark (249 chars)
Gated community in the Country but close enough to Houston and Waller area. Come build your dream home here, where its still peaceful and quiet. No mobile homes allowed. Buyer to verify with HOA plans for building, permits required and restrictions.
ⓘ Source: listings_history table (triggers on properties + properties_extension) + one-shot
backfill from property_details.listing_events for pre-trigger history.
Tax reassessment forecast TX · Resets to sale price
- Current annual tax
- $4,288 · $357/mo
- Projected year-2 tax
- $5,032 · $419/mo
- Expected delta
- +$745/yr (+$62/mo · 17.4%)
ⓘ Screening estimate from a state-policy table — verify with the county assessor before closing.
Climate risk First Street
- Flood 1/10 Low FEMA zone X (unshaded) · 0% chance over 30 yrs
- Wildfire 4/10 Moderate
- Heat 8/10 Severe 7 d/yr ≥111°F today · 23 d/yr by 30 yrs out
- Wind 8/10 Severe 99% chance of damaging wind over 30 yrs
- Air quality 2/10 Low 1 unhealthy d/yr today · 1 by 30 yrs out
Nearby sold comps map
Loading sold comps map…
Walkable amenities ~0.75 mi
Loading nearby amenities…
Taxation est. · year 1
- Rental income
- $22,800
- − Mortgage interest
- −$15,404
- − Property taxes
- −$4,288
- − Insurance
- −$1,375
- − Repairs & maintenance
- −$1,824
- − Management
- −$1,824
- − HOA
- −$240
- − Depreciation
- −$8,000
- Taxable loss
- −$10,155
- Est. tax savings @ 24.0%
- +$2,437
- After-tax cash flow
- $-2,759/yr
For passive investors: Depreciation is non-cash, so a rental often shows a tax loss while cash-flowing — sheltering income. Rental losses are passive: they offset passive income freely, and up to $25,000/yr can offset ordinary (W-2) income if you actively participate and your MAGI is under $100k (phasing out to $0 by $150k); unused losses carry forward. On sale, claimed depreciation is recaptured at up to 25%, and gains may owe capital-gains tax (a 1031 exchange can defer both). Figures are a year-1 estimate at your 24.0% rate — not tax advice; consult a CPA.
Schools (NCES district)
- District
- Waller ISD
- NCES district ID
- 4844430
- Math proficiency
- 30% ▼ -23.00%
- Reading proficiency
- 35% ▼ -11.00%
- Median HH income
- $58,911
- Composite
- 29.12/100
- National rank
- #6593
- State rank
- #532 of 826 in TX
Livability — Hempstead
- Score
- 60/100
- State rank
- #1099
- US rank
- #19446
Category grades
Schools grade is shown separately in the Schools card above.
Census & demographics
- City population
- 14,943
- Population (ZIP)
- 14,943
Population outlook (Waller County) Hauer SSP2
- Today (2025)
- 60,772 people
- By 2030
- 67,616 · +11.3%
- By 2040
- 82,283 · +35.4%
- By 2050
- 98,276 · +61.7%
- By 2075
- 142,860 · +135.1%
- By 2100
- 175,596 · +188.9%
Race, ethnicity, and origin ACS 2023
- Neighborhood character
- Diverse neighborhood (Simpson 0.69)
- Race & ethnicity
- Hispanic / Latino 34% White 32% Black 31% Two or more races 10% Native American 2%
- Hispanic origin (detail)
- Mexican 30% Cuban 1%
- Common ancestry
- Romanian 2% Lithuanian 2% Slovak 1%
- Foreign-born
- 13% · Canada
- Languages at home
- 74% English-only · Spanish 25%
Political lean MEDSL · Waller
- 2024 margin
- Strong R (+25.0) · D 37.0% · R 62.0% · Other 1.0%
- 2008→2024 swing
- -17.9pp toward R · 2008: -7.2pp · 2024: -25.0pp
- All cycles
- 2024: R+25.0 2020: R+26.7 2016: R+28.6 2012: R+17.6 2008: R+7.2
Not yet ingested
- Civics
- —
Market trends
- HPI YoY
- ▲ 39.43%
- Current HPI
- 359.93
- Rent YoY
- —
- Metro
- —
- State GDP YoY
- ▲ 3.95%
- F500 in state
- 110
Industry mix (Fortune 500 HQ in TX)
| Industry | F500 HQs | Revenue |
|---|---|---|
| Energy | 16 | $1,198B |
|
||
| Technology | 5 | $198B |
|
||
| Engineering / Construction | 4 | $72B |
|
||
| Energy Services | 3 | $60B |
|
||
| Utilities | 3 | $41B |
|
||
| Healthcare | 2 | $330B |
|
||
Price history
+83.3% since first listed5 events — show timeline
- 2026-04-27 Listed $275,000 HARMLS
- 2022-05-18 Sold (Public Records) — Public Records
- 2021-06-30 Sold (MLS) — HARMLS
- 2021-04-23 Pending — HARMLS
- 2021-04-16 Listed $150,000 HARMLS
Property tax history
+66.5%/yrLatest (2025): $4,288 · +0.3% YoY. Source: county tax records.
Cash-flow waterfall
monthlySold comps — $/sqft
last 12 mo · ≤1 miLoading sold comps…