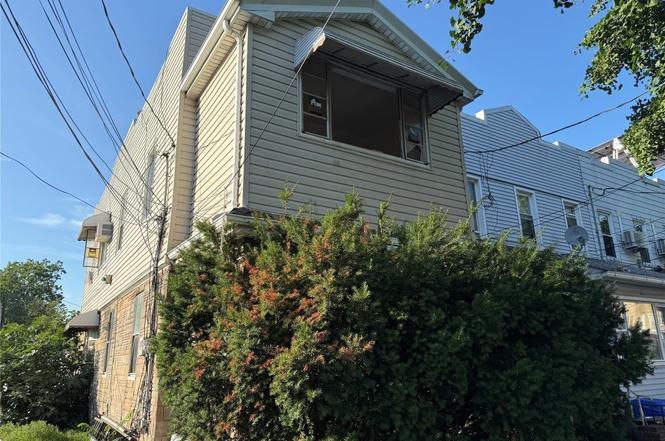
 Duplex
78-01 95th Avenue Ave · New York, NY
Flood risk 1/10 · Minimal
- FEMA flood zone
- X (unshaded)
- Chance of flooding over 30 yrs
- 0.0%
- Est. flood insurance / yr
- $507 – $1,088
Fire risk 1/10 · Minimal
- Est. fire insurance / yr
- $691 – $1,283
Heat risk 7/10 · Major
- Hot days now (above 99°F)
- 7 days/yr
- Hot days in 30 yrs
- 15 days/yr
Wind risk 6/10 · Moderate
- Chance of severe wind over 30 yrs
- 50.0%
Air-quality risk 5/10 · Moderate
- Unhealthy air days now
- 6 days/yr
- Unhealthy air days in 30 yrs
- 8 days/yr
Risk factors via First Street. Map © Google.
Why this score? — see what drove the C- grade
The composite is a weighted blend of 9 inputs, each scored 0–100. Each bar is that input's sub-score; the figure is the points it added to the 100-point composite (weight × sub-score).
- ARV discount +15.0/15.0
- Cash flow +13.8/30.0
- Schools +5.0/10.0
- DSCR +4.2/10.0
- Livability +3.8/5.0
- 1% rule +3.3/10.0
- Rent growth +2.5/5.0
- Condition / age +2.5/5.0
- Appreciation +0.0/10.0
$729,000
🖨 Deal sheet 📄 Offer letter ✓ Due diligence
Multi-family units
County records classify this as Multi-Family (2-4 Unit). Listing-text estimate: 2 units. confirmed
Listing remarks
2 Family house, in poor condition , Short sale, 5 bed rooms, LR, DR, only 1 Kitchen on 1st floor, no kitchen on 2nd fl. Basement in a terrible state, subject to asbestos, mold , damage walls etc. FHA Clause : "Seller may cancel this agreement prior to the ending date of the listing period without advance notice to the broker/agent and any other consideration if the property is conveyed to the mortgage insurer or the mortgage holder. "
Key facts
- 2,000 sq ft lot
- Garage
- Built 1915
Property features AI
Exterior
- Parking: 1-car garage; No carport
- Utilities: Public sewer; Cable available; Electricity available and connected
- Home design: Duplex
- Construction: Aluminum siding construction
- Exterior features: Aluminum siding; Not waterfront; No additional parcels
Interior
- Bedrooms: One 4-bedroom unit
- Flooring: Combination flooring
- Bathrooms: 2 full bathrooms
- Heating & cooling: Natural gas heating; No central cooling
- Interior features: First-floor bedroom; Partially finished basement
Neighborhood map
What this means for you Summary
Snapshot
- This is a 2 × 2-bed/1.0-bath units multifamily listed at $729k.
Deal economics
- At list price, monthly cash flow is $64 ($764/yr) — positive. Per door: $32/mo.
- The deal already cash-flows at list — no discount required.
- To meet the 1% rule (rent ≥ 1% of price), the offer needs to be $608k (16.7% below list).
- Recommended offer: $608k (16.7% below list) — sets the bar for 1% rule.
- Cap rate 6.4% vs local median 2.6% in New York — top-decile yield for the area; either an underpriced asset or a hidden risk that comps aren't pricing in. Stress-test before assuming the spread holds.
Location & tenants
- Location reads 75/100 on livability (#268 in NY, #4,188 nationally) — a middle-class / working-renter tenant base. Strengths: amenities A+, commute A+, health & safety A; Watch: crime F, cost of living F.
- Market conditions: 55 active listings in the ZIP; 12 comparable units currently listed for rent nearby; rentals at typical pace (median 24d on market — plan ~3-4 weeks tenant-placement turnaround); 5,302 units permitted in Queens County in 2024 (4,918 in 5+ unit buildings).
Forward outlook
- Local home prices are declining (-3.0%/yr); year-one equity from $5k of loan paydown is wiped out by about $22k of value loss. Plan a longer hold.
- Queens County population projected at +16% by 2050 — long-run rental-demand tailwind backs the buy-and-hold thesis.
Negotiation context
- It's been on market 270 days — a 12% lower offer ($642k) is reasonable based on typical stale-listing flexibility.
- 2 sale attempts since 8y ago; this cycle's ask is 39% above the opening price — seller raised mid-cycle; expect resistance to lowballs.
- Current owner paid $535k; 36% above their basis — modest negotiation headroom, anchor on the comps not their cost.
Risks & watch-outs
- Watch-outs: built in 1915 — expect roof / HVAC / electrical / plumbing capex.
- Climate carrying-cost: major wind risk, 50% chance of damaging wind over 30y; extreme-heat days projected 7→15/yr by 2055 (HVAC capex compounding) — expect insurance premiums to compound above CPI over the hold.
Questions for the listing agent
- It's been on market 270 days. Have you received any prior offers? Is the seller open to a 17% concession, seller financing, or rate buy-down credit?
- Can we see the unit-by-unit rent roll, current vacancy, and any below-market leases? What's the average tenancy length?
- What capital expenditures (roof, boiler, parking lot, exteriors) have been made in the last 5 years, and what's planned in the next 2?
- Built in 1915 — when were the roof, HVAC, electrical panel, plumbing, and water heater last replaced?
- Why hasn't it sold? Are there any deal-killer items the seller is aware of (foundation, flood, title, zoning, code violations)?
- Is there a deadline driving the sale (1031 exchange, divorce, estate, relocation)? That informs how much negotiation room exists.
- Schools are B-rated — typically a magnet for longer-tenancy family renters. What's the average tenant stay here, and is there a school-zone premium baked into asking?
- Crime grade is F in this area — have there been break-ins, vandalism, or insurance claims at this property in the last 3 years? What carrier currently insures it and at what premium?
- What's the average days-on-market for RENTAL listings here right now (not sales)? A rising rental-DOM trend means longer vacancies and softer asking-rent achievability than the comps imply.
- What's the recent tenant-quality profile in this submarket — average credit score on applications, eviction rate, late-payment / NSF rate, and stable-employment percentage? A property-management company in the area should have these aggregated.
- How much new apartment / multifamily construction is in the pipeline within 1–3 miles? Heavy new supply (>2% of stock underway) typically softens rents 12–24 months out; light construction supports rent growth.
Investment metrics
- 1% rule
- 0.83% ✗
- Cap rate
- 6.40%
- Cash-on-cash
- 0.37%
- DSCR
- 1.02
- GRM
- 10.0
CMA / ARV
- ARV (on-the-fly)
- $908,160
- Comps found
- 12
Show comp detail 12 sales within ~0.75 mi
| Address | Dist | Beds/Ba | Sqft | Sold | Price | $/sf | Match |
|---|---|---|---|---|---|---|---|
| 106-35 79th St | 0.47mi | 4/2.0 | 1,932 (+1%) | 1mo | $960,000 | $497 | 76 |
| 9406 76th St | 0.13mi | 5/3.0 (+1) | 1,814 (-6%) | 4mo | $875,000 | $482 | 72 |
| 80-60 90 Ave | 0.34mi | 5/2.0 (+1) | 1,848 (-4%) | 2mo | $875,000 | $473 | 72 |
| 105-18 77th St | 0.33mi | 4/2.0 | 1,720 (-10%) | 5mo | $710,000 | $413 | 63 |
| 9117 78th St | 0.18mi | 5/2.0 (+1) | 1,696 (-12%) | 5mo | $945,000 | $557 | 63 |
| 85 Autumn Ave | 0.63mi | 5/2.0 (+1) | 1,904 (-1%) | 4mo | $725,000 | $381 | 61 |
| 12 Danforth St | 0.64mi | 4/2.0 | 1,980 (+3%) | 5mo | $800,000 | $404 | 61 |
| 89-10 91 Ave | 0.53mi | 4/2.0 | 2,080 (+8%) | 4mo | $990,000 | $476 | 58 |
| 197 Nichols Ave | 0.44mi | 5/3.0 (+1) | 2,160 (+12%) | 4mo | $995,000 | $461 | 46 |
| 88 Nichols Ave | 0.57mi | 5/2.0 (+1) | 1,720 (-10%) | 7mo | $960,000 | $558 | 45 |
| 132 Euclid Ave | 0.75mi | 5/2.0 (+1) | 2,080 (+8%) | 6mo | $860,000 | $413 | 41 |
| 8615 75th St | 0.59mi | 5/3.0 (+1) | 2,160 (+12%) | 5mo | $955,000 | $442 | 38 |
Match score weights: distance 35% · size 25% · config 20% · recency 20%. Top-matched comps best support the ARV.
Projected returns pro-forma
-3.0% appreciation · 3.0% rent growth · sell at horizon
- IRR
- -15.7%
- Equity multiple
- 0.44×
- Total profit
- $-114,166
- Equity at exit
- $108,696
- IRR
- -7.3%
- Equity multiple
- 0.54×
- Total profit
- $-94,572
- Equity at exit
- $63,031
Cash invested: $204,120 (down + closing). Projections, not guarantees.
Landlord ↔ Tenant lean methodology
- Overall (CITY)
- 0 Strongly Tenant-Friendly
- State New York
- 15 Strongly Tenant-Friendly · D+10
- County
- — inherits STATE
- City New York
- 0 Strongly Tenant-Friendly · D+34
ZIP-level market 11416
- Active inventory
- 55
- Price-to-rent
- 20.0×
Monthly cashflow live
- Estimated rent
- $6,075 high interval (Pro) →
- Mortgage (P&I)
- −$3,823
- Tax from tax record
- −$609 /mo · $7,306/yr
- Insurance
- −$304
- HOA
- −$0
- Vacancy / Maint / Mgmt
- −$1,276
- Net cashflow
- $64
Break-even live
2-unit breakdown (identical units grouped — click to expand)
| Units | Beds | Baths | Est. rent |
|---|---|---|---|
| 2× units | 2 | 1 | $6,076 |
| #1 | 2 | 1 | $3,038 |
| #2 | 2 | 1 | $3,038 |
| Total (2 units) | $6,075 | ||
UW: 25.0% down · 7.5% · 30yr · 1.5% tax · 5.0% vac · 8.0% maint · 8.0% mgmt
Financing live
Cash to close
- Down payment
- $182,250
- Closing costs
- $21,870
- Reserves months
- —
- Total cash needed
- —
Loan-product check · same deal, 3 products live
Conventional
25% down · 7.5% · 30yr
- Down + closing
- —
- Monthly P&I
- —
- Monthly cashflow
- —
- DSCR
- —
- Eligible?
- —
Personal DTI + credit; lowest rate.
DSCR
20% down · 8.5% · 30yr
- Down + closing
- —
- Monthly P&I
- —
- Monthly cashflow
- —
- DSCR
- —
- Eligible?
- —
No personal income docs; deal must DSCR.
Hard money
10% down · 12.0% · 12mo
- Down + closing
- —
- Monthly P&I
- —
- Monthly cashflow
- —
- DSCR
- —
- Eligible?
- —
Short-term bridge; refi at stabilization.
Rent comps 12 comps
| Address | Beds | Baths | Sqft | Rent | $/sqft | DOM | Units | Dist |
|---|---|---|---|---|---|---|---|---|
| 10124 78th St Ozone Park, NY | 3.0 | 1.0 | 2299 | $3,500 | $1.52 | 24d | 1 | 0.24mi |
| 8836 77th St Woodhaven, NY | 4.0 | 2.0 | 1500 | $4,200 | $2.80 | 24d | 1 | 0.42mi |
| 8812 86th St Woodhaven, NY | 3.0 | 2.0 | 2200 | $3,000 | $1.36 | 14d | 1 | 0.54mi |
| 13214 81st St Ozone Park, NY | 3.0 | 1.0 | 1280 | $4,100 | $3.20 | 11d | 1 | 0.64mi |
| 132-13 81st St #1 Jamaica, NY | 3.0 | 1.0 | 1280 | $4,100 | $3.20 | 2d | 1 | 0.65mi |
| 88-16 Jamaica Ave Unit 2 Jamaica, NY | 4.0 | 1.0 | 2280 | $2,600 | $1.14 | 24d | 1 | 0.71mi |
| 10541 90th St Ozone Park, NY | 3.0 | 2.0 | 1264 | $4,111 | $3.25 | 24d | 1 | 0.74mi |
| 9309 103rd Ave Ozone Park, NY | 3.0 | 1.5 | 1892 | $3,000 | $1.59 | 24d | 1 | 0.77mi |
| 10144 98th St Ozone Park, NY | 3.0 | 1.0 | 2112 | $3,450 | $1.63 | 24d | 1 | 0.95mi |
| 14912 83rd St Howard Beach, NY | 3.0 | 2.0 | 1250 | $3,200 | $2.56 | 24d | 1 | 1.09mi |
| 9210 104th St Richmond Hill, NY | 4.0 | 2.0 | 2240 | $3,600 | $1.61 | 3d | 1 | 1.16mi |
| 8231 Woodhaven Blvd Glendale, NY | 4.0 | 1.0 | 2000 | $3,800 | $1.90 | 24d | 1 | 1.42mi |
Listing history 19 events
-
2026-06-18days on market $729,000 Active 270 DOM
-
2026-06-17days on market $729,000 Active 269 DOM
-
2026-06-15days on market $729,000 Active 267 DOM
-
2026-06-13days on market $729,000 Active 265 DOM
-
2026-06-10days on market $729,000 Active 261 DOM
-
2026-06-08days on market $729,000 Active 260 DOM
-
2026-06-03days on market $729,000 Active 255 DOM
-
2026-06-01days on market $729,000 Active 253 DOM
-
2026-05-31days on market $729,000 Active 252 DOM
-
2026-03-12price $729,000
-
2026-01-09price $605,000
-
2026-01-09price $600,000
-
2025-09-15$525,000 Active
-
2020-03-27status Pending
-
2018-12-11status Under Contract
-
2018-12-10historical
-
2018-10-01$739,000 New
-
2009-07-16soldstatus $535,000
-
1993-01-11soldstatus $185,000
ⓘ Source: listings_history table (triggers on properties + properties_extension) + one-shot
backfill from property_details.listing_events for pre-trigger history.
Tax reassessment forecast NY · Partial reset (capped growth)
- Current annual tax
- $7,306 · $609/mo
- Projected year-2 tax
- $9,813 · $818/mo
- Expected delta
- +$2,507/yr (+$209/mo · 34.3%)
ⓘ Screening estimate from a state-policy table — verify with the county assessor before closing.
Climate risk First Street
- Flood 1/10 Low FEMA zone X (unshaded) · 0% chance over 30 yrs
- Wildfire 1/10 Low
- Heat 7/10 Severe 7 d/yr ≥99°F today · 15 d/yr by 30 yrs out
- Wind 6/10 Major 50% chance of damaging wind over 30 yrs
- Air quality 5/10 Major 6 unhealthy d/yr today · 8 by 30 yrs out
Nearby sold comps map
Loading sold comps map…
Walkable amenities ~0.75 mi
Loading nearby amenities…
Taxation est. · year 1
- Rental income
- $72,900
- − Mortgage interest
- −$40,835
- − Property taxes
- −$7,306
- − Insurance
- −$3,645
- − Repairs & maintenance
- −$5,832
- − Management
- −$5,832
- − Depreciation
- −$21,207
- Taxable loss
- −$11,758
- Est. tax savings @ 24.0%
- +$2,822
- After-tax cash flow
- $3,586/yr
For passive investors: Depreciation is non-cash, so a rental often shows a tax loss while cash-flowing — sheltering income. Rental losses are passive: they offset passive income freely, and up to $25,000/yr can offset ordinary (W-2) income if you actively participate and your MAGI is under $100k (phasing out to $0 by $150k); unused losses carry forward. On sale, claimed depreciation is recaptured at up to 25%, and gains may owe capital-gains tax (a 1031 exchange can defer both). Figures are a year-1 estimate at your 24.0% rate — not tax advice; consult a CPA.
Schools (NCES district)
No district data.
Livability — New York
- Score
- 75/100
- State rank
- #268
- US rank
- #4188
Category grades
Schools grade is shown separately in the Schools card above.
Census & demographics
- Census place
- New York, NY
- City population
- 7,731,280
- Population (ZIP)
- 26,660
Population outlook (Queens County) Hauer SSP2
- Today (2025)
- 2,546,320 people
- By 2030
- 2,643,059 · +3.8%
- By 2040
- 2,815,563 · +10.6%
- By 2050
- 2,944,423 · +15.6%
- By 2075
- 3,123,338 · +22.7%
- By 2100
- 3,098,688 · +21.7%
Race, ethnicity, and origin ACS 2023
- Neighborhood character
- Diverse neighborhood (Simpson 0.69)
- Race & ethnicity
- Hispanic / Latino 43% Asian 33% Two or more races 17% White 12% Black 4%
- Hispanic origin (detail)
- Mexican 5% Puerto Rican 10% Dominican 11%
- Common ancestry
- Romanian 3%
- Foreign-born
- 54% · Canada, Jamaica, China
- Languages at home
- 35% English-only · Spanish 37% Other Indo-European 21% Russian/Polish/Slavic 3%
Political lean MEDSL · Queens
- 2024 margin
- Strong D (+24.6) · D 62.3% · R 37.7%
- 2008→2024 swing
- -26.2pp toward R · 2008: 50.8pp · 2024: 24.6pp
- All cycles
- 2024: D+24.6 2020: D+45.2 2016: D+53.4 2012: D+58.5 2008: D+50.8
Not yet ingested
- Civics
- —
Market trends
- HPI YoY
- ▼ -185.71%
- Current HPI
- 274.1375
- Rent YoY
- —
- Metro
- —
- State GDP YoY
- ▲ 2.60%
- F500 in state
- 92
Industry mix (Fortune 500 HQ in NY)
| Industry | F500 HQs | Revenue |
|---|---|---|
| Financial Services | 10 | $950B |
|
||
| Consumer Goods | 9 | $162B |
|
||
| Insurance | 4 | $225B |
|
||
| Telecommunications | 2 | $144B |
|
||
| Pharmaceuticals | 2 | $112B |
|
||
| Media / Entertainment | 2 | $69B |
|
||
Price history
+294.1% since first listed10 events — show timeline
- 2026-03-12 Price Changed $729,000 OneKey® MLS as Distributed by MLS Grid
- 2026-01-09 Price Changed $605,000 OneKey® MLS as Distributed by MLS Grid
- 2026-01-09 Price Changed $600,000 OneKey® MLS as Distributed by MLS Grid
- 2025-09-15 Listed $525,000 OneKey® MLS as Distributed by MLS Grid
- 2020-03-27 Pending — OneKey® MLS as Distributed by MLS Grid
- 2018-12-11 Pending — OneKey® MLS as Distributed by MLS Grid
- 2018-12-10 Listing Removed — OneKey® MLS as Distributed by MLS Grid
- 2018-10-01 Listed $739,000 OneKey® MLS as Distributed by MLS Grid
- 2009-07-16 Sold (Public Records) $535,000 Public Records
- 1993-01-11 Sold (Public Records) $185,000 Public Records
Property tax history
+5.2%/yrLatest (2025): $7,306 · +3.4% YoY. Source: county tax records.
Cash-flow waterfall
monthlySold comps — $/sqft
last 12 mo · ≤1 miLoading sold comps…