7944 Carson Rd · Birch Bay, WA
Flood risk 1/10 · Minimal
- FEMA flood zone
- X (unshaded)
- Chance of flooding over 30 yrs
- 0.0%
- Est. flood insurance / yr
- $507 – $1,088
Fire risk 3/10 · Minor
- Est. fire insurance / yr
- $604 – $1,122
Heat risk 2/10 · Minimal
- Hot days now (above 81°F)
- 7 days/yr
- Hot days in 30 yrs
- 17 days/yr
Wind risk 1/10 · Minimal
- Chance of severe wind over 30 yrs
- —
Air-quality risk 6/10 · Moderate
- Unhealthy air days now
- 7 days/yr
- Unhealthy air days in 30 yrs
- 10 days/yr
Risk factors via First Street. Map © Google.
Why this score? — see what drove the D grade
The composite is a weighted blend of 9 inputs, each scored 0–100. Each bar is that input's sub-score; the figure is the points it added to the 100-point composite (weight × sub-score).
- Appreciation +10.0/10.0
- ARV discount +7.5/15.0
- Cash flow +7.1/30.0
- Schools +4.6/10.0
- Rent growth +3.3/5.0
- Livability +3.1/5.0
- Condition / age +2.5/5.0
- DSCR +1.3/10.0
- 1% rule +0.8/10.0
$484,000
🖨 Deal sheet (PDF) 📄 Offer letter ✓ Due diligence
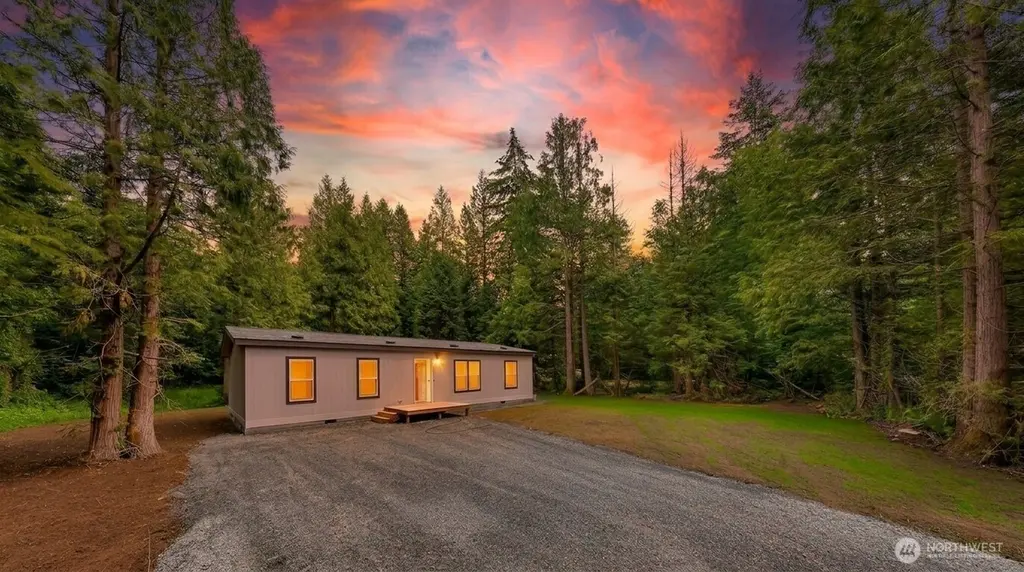
Listing remarks
Brand-new 4-bedroom, 2-bath home in Blaine, tucked away on a quiet street with easy access to Birch Bay and I-5. Be the first to live in this thoughtfully designed home featuring an open-concept layout where the living room flows seamlessly into the dining area and kitchen—ideal for everyday living and entertaining. A sliding glass door leads to the backyard, bringing in natural light and extending your living space outdoors. The primary suite is privately located on one side of the home, while three additional bedrooms are positioned on the opposite end, offering comfort, flexibility, and privacy for guests or a home office. A fresh start in a peaceful and convenient location. Locate
Key facts
- Backyard
- Sliding glass door
- Privately located
Tags
Property features AI
Finance
- Other: Lot size approximately 0.46 acres
- Financial info: Listing terms: Cash or Conventional
- HOA & community: Monthly HOA fee of $94; Has HOA
Exterior
- Parking: Driveway
- Utilities: Electric energy source; Community water (Birch Bay Water and Sewer); Sewer connected (Birch Bay Water and Sewer); Power provided by PSE
- Home design: Manufactured home (double wide) on land; One level; Main level entry; Completed new construction
- Construction: Cement plank construction; Composition roof; Tie-down foundation; Manufactured house / double wide
- Exterior features: Cement plank exterior; Has a view
Interior
- Kitchen: Kitchen with eating space; Refrigerator; Stove/Range
- Bedrooms: 4 bedrooms (all on the main level); Primary bedroom on the main level
- Flooring: Vinyl; Carpet
- Bathrooms: 2 full bathrooms (both on the main level)
- Heating & cooling: Forced air heating; No cooling
- Interior features: Dining room; Walk-in closet(s)
- Laundry & utility: Washer; Dryer; Utility room on the main level
Neighborhood map
What this means for you Summary
Snapshot
- This is a 4-bed/2.0-bath other listed at $484k.
Deal economics
- At list price, monthly cash flow is $-697 ($-8k/yr) — negative.
- To cash-flow at today's rent, offer at most $361k (25.5% below list).
- To meet the 1% rule (rent ≥ 1% of price), the offer needs to be $283k (41.5% below list).
- Recommended offer: $283k (41.5% below list) — sets the bar for 1% rule.
- Cap rate 4.6% vs local median 2.6% in Birch Bay — top-decile yield for the area; either an underpriced asset or a hidden risk that comps aren't pricing in. Stress-test before assuming the spread holds.
Location & tenants
- Location reads 62/100 on livability (#406 in WA) — a middle-class / working-renter tenant base. Strengths: housing A; Watch: cost of living D+, health & safety D, schools F.
- Ferndale School District (suburban): math 43% / reading 58% proficiency, ranked #138 of 291 in WA (top 47%) — acceptable for families but not a draw, mixed tenant base, ~2y average lease.
- Market conditions: Rents rising (+3.1%/yr); 461 active listings in the ZIP; solid renter incomes; 1,190 units permitted in Whatcom County in 2024 (327 in 5+ unit buildings).
- This rent runs 39% of the median local income ($87k/yr) — at the standard rent-burdened threshold; future hikes will face affordability resistance.
Forward outlook
- In year one you build about $52k of equity ($3k loan paydown + $48k appreciation (10.0% local appreciation)).
- Whatcom County population projected at +28% by 2050 — long-run rental-demand tailwind backs the buy-and-hold thesis.
- By year 2, paydown + projected appreciation supports a ~$83k cash-out refi (75% LTV) — recoverable capital for the next deal without selling this one.
Negotiation context
- It's been on market 16 days — a 2% lower offer ($477k) is reasonable based on typical stale-listing flexibility.
- Current owner paid $130k; list at $484k implies a 271% gain — meaningful room to come down on a strong offer.
Questions for the listing agent
- What do current leases actually rent for vs. the listed asking? Can we see a recent rent roll and the last 12 months of T-12 income?
- What does the HOA fee cover, when was the last increase, and are there any pending special assessments or reserve-fund shortfalls?
- Is there a deadline driving the sale (1031 exchange, divorce, estate, relocation)? That informs how much negotiation room exists.
- Schools are F-rated, which usually means shorter tenancies and higher turnover. Who's the typical renter profile here, and what's been the actual vacancy rate?
- The area grade is low — what's the realistic commute time and amenity access for the typical tenant pool here? Any planned neighborhood developments (good or bad) we should know about?
- What's the average days-on-market for RENTAL listings here right now (not sales)? A rising rental-DOM trend means longer vacancies and softer asking-rent achievability than the comps imply.
- What's the recent tenant-quality profile in this submarket — average credit score on applications, eviction rate, late-payment / NSF rate, and stable-employment percentage? A property-management company in the area should have these aggregated.
- How much new for-sale + rental construction is in the pipeline within 1–3 miles? Heavy new supply typically softens prices + rents 12–24 months out; constrained supply supports both.
Investment metrics
- 1% rule
- 0.58% ✗
- Cap rate
- 4.56%
- Cash-on-cash
- -6.17%
- DSCR
- 0.73
- GRM
- 14.3
CMA / ARV
No comps found within radius.
Projected returns pro-forma
10.0% appreciation · 3.1% rent growth · sell at horizon
- IRR
- 19.9%
- Equity multiple
- 2.62×
- Total profit
- $219,263
- Equity at exit
- $436,026
- IRR
- 18.2%
- Equity multiple
- 6.02×
- Total profit
- $680,780
- Equity at exit
- $940,306
Cash invested: $135,520 (down + closing). Projections, not guarantees.
Landlord ↔ Tenant lean methodology
- Overall (STATE)
- 28 Tenant-Leaning
- State Washington
- 28 Tenant-Leaning · D+8
- County
- — inherits STATE
- City
- — inherits STATE
ZIP-level market 98230
- Home prices YoY
- 14.0%
- Rents YoY
- 3.1%
- Active inventory
- 461
- Price-to-rent
- 14.3×
Monthly cashflow live
- Estimated rent
- $2,830 medium interval (Pro) →
- Mortgage (P&I)
- −$2,538
- Tax from tax record
- −$99 /mo · $1,190/yr
- Insurance
- −$202
- HOA
- −$94
- Vacancy / Maint / Mgmt
- −$594
- Net cashflow
- $-697
Break-even live
Sensitivity live
| Price | -10% $-423 | -5% $-560 | +0% $-697 | +5% $-834 | +10% $-971 |
|---|---|---|---|---|---|
| Rent | -10% $-921 | -5% $-809 | +0% $-697 | +5% $-586 | +10% $-474 |
| Rate | -1.0pp $-454 | -0.5pp $-574 | base $-697 | +0.5pp $-823 | +1.0pp $-950 |
UW: 25.0% down · 7.5% · 30yr · 1.5% tax · 5.0% vac · 8.0% maint · 8.0% mgmt
Financing live
Cash to close
- Down payment
- $121,000
- Closing costs
- $14,520
- Reserves months
- —
- Total cash needed
- —
Loan-product check · same deal, 3 products live
Conventional
25% down · 7.5% · 30yr
- Down + closing
- —
- Monthly P&I
- —
- Monthly cashflow
- —
- DSCR
- —
- Eligible?
- —
Personal DTI + credit; lowest rate.
DSCR
20% down · 8.5% · 30yr
- Down + closing
- —
- Monthly P&I
- —
- Monthly cashflow
- —
- DSCR
- —
- Eligible?
- —
No personal income docs; deal must DSCR.
Hard money
10% down · 12.0% · 12mo
- Down + closing
- —
- Monthly P&I
- —
- Monthly cashflow
- —
- DSCR
- —
- Eligible?
- —
Short-term bridge; refi at stabilization.
HOA detail
- Monthly dues
- $94 · $1,128/yr
Listing history 12 events
-
2026-06-21days on market $484,000 Active 16 DOM
-
2026-06-18days on market $484,000 Active 13 DOM
-
2026-06-17days on market $484,000 Active 12 DOM
-
2026-06-16days on market $484,000 Active 11 DOM
-
2026-06-15days on market $484,000 Active 10 DOM
-
2026-06-14days on market $484,000 Active 8 DOM
-
2026-06-13days on market $484,000 Active 7 DOM
-
2026-06-10days on market $484,000 Active 5 DOM
-
2026-06-09days on market $484,000 Active 4 DOM
-
2026-06-08days on market $484,000 Active 3 DOM
-
2026-06-07remarks 693-char remark
-
2026-06-07$484,000 Active 2 DOM
ⓘ Source: listings_history table (triggers on properties + properties_extension) + one-shot
backfill from property_details.listing_events for pre-trigger history.
Tax reassessment forecast WA · Resets to sale price
- Current annual tax
- $1,190 · $99/mo
- Projected year-2 tax
- $4,743 · $395/mo
- Expected delta
- +$3,553/yr (+$296/mo · 298.6%)
ⓘ Screening estimate from a state-policy table — verify with the county assessor before closing.
Climate risk First Street
- Flood 1/10 Low FEMA zone X (unshaded) · 0% chance over 30 yrs
- Wildfire 3/10 Moderate
- Heat 2/10 Low 7 d/yr ≥81°F today · 17 d/yr by 30 yrs out
- Wind 1/10 Low
- Air quality 6/10 Major 7 unhealthy d/yr today · 10 by 30 yrs out
Nearby sold comps map
Loading sold comps map…
Walkable amenities ~0.75 mi
Loading nearby amenities…
Taxation est. · year 1
- Rental income
- $33,960
- − Mortgage interest
- −$27,112
- − Property taxes
- −$1,190
- − Insurance
- −$2,420
- − Repairs & maintenance
- −$2,717
- − Management
- −$2,717
- − HOA
- −$1,128
- − Depreciation
- −$14,080
- Taxable loss
- −$17,403
- Est. tax savings @ 24.0%
- +$4,177
- After-tax cash flow
- $-4,191/yr
For passive investors: Depreciation is non-cash, so a rental often shows a tax loss while cash-flowing — sheltering income. Rental losses are passive: they offset passive income freely, and up to $25,000/yr can offset ordinary (W-2) income if you actively participate and your MAGI is under $100k (phasing out to $0 by $150k); unused losses carry forward. On sale, claimed depreciation is recaptured at up to 25%, and gains may owe capital-gains tax (a 1031 exchange can defer both). Figures are a year-1 estimate at your 24.0% rate — not tax advice; consult a CPA.
Schools (NCES district)
- District
- Ferndale School District
- NCES district ID
- 5302850
- Math proficiency
- 43% ▲ 1.00%
- Reading proficiency
- 58% ▲ 4.00%
- Median HH income
- $59,413
- Composite
- 46.06/100
- National rank
- #5494
- State rank
- #138 of 291 in WA
Livability — Birch Bay
- Score
- 62/100
- State rank
- #406
- US rank
- #16180
Category grades
Schools grade is shown separately in the Schools card above.
Census & demographics
- Census place
- Birch Bay, WA
- County
- Whatcom County · 209,776 people
- Metro
- Bellingham, WA
- Population (ZIP)
- 18,744
- Household income
- $86,623
- Rent vs Own
- Severe rent burden
- 454.0
Population outlook (Whatcom County) Hauer SSP2
- Today (2025)
- 240,408 people
- By 2030
- 254,667 · +5.9%
- By 2040
- 281,365 · +17.0%
- By 2050
- 307,592 · +27.9%
- By 2075
- 375,576 · +56.2%
- By 2100
- 421,637 · +75.4%
Race, ethnicity, and origin ACS 2023
- Neighborhood character
- Predominantly White (77%)
- Race & ethnicity
- White 77% Two or more races 11% Hispanic / Latino 9% Asian 3% Pacific Islander 2% Black 1%
- Hispanic origin (detail)
- Mexican 5%
- Common ancestry
- Portuguese 6% Iranian 4% Lithuanian 3%
- Foreign-born
- 13% · Canada, China
- Languages at home
- 89% English-only · Spanish 4% Russian/Polish/Slavic 1% Other Indo-European 1%
Political lean MEDSL · Whatcom
- 2024 margin
- Strong D (+24.9) · D 60.8% · R 35.9% · Other 3.3%
- 2008→2024 swing
- +6.9pp toward D · 2008: 18.0pp · 2024: 24.9pp
- All cycles
- 2024: D+24.9 2020: D+23.9 2016: D+17.7 2012: D+12.1 2008: D+18.0
Not yet ingested
- Civics
- —
Market trends
- HPI YoY
- ▲ 106.58%
- Current HPI
- 868.68
- Rent YoY
- ▲ 3.10%
- Metro
- Bellingham, WA
- State GDP YoY
- ▲ 4.65%
- F500 in state
- 22
Industry mix (Fortune 500 HQ in WA)
| Industry | F500 HQs | Revenue |
|---|---|---|
| Retail | 2 | $269B |
|
||
| Technology / Retail | 1 | $638B |
|
||
| Technology | 1 | $245B |
|
||
| Telecommunications | 1 | $38B |
|
||
| Food / Beverage | 1 | $36B |
|
||
| Automotive / Trucks | 1 | $34B |
|
||
Price history
+271.4% since first listed2 events — show timeline
- 2026-06-05 Listed $484,000 NWMLS as Distributed by MLS Grid
- 2025-05-09 Sold (Public Records) $130,312 Public Records
Property tax history
+4.6%/yrLatest (2026): $1,190 · +6.7% YoY. Source: county tax records.
Cash-flow waterfall
monthlySold comps — $/sqft
last 12 mo · ≤1 miLoading sold comps…