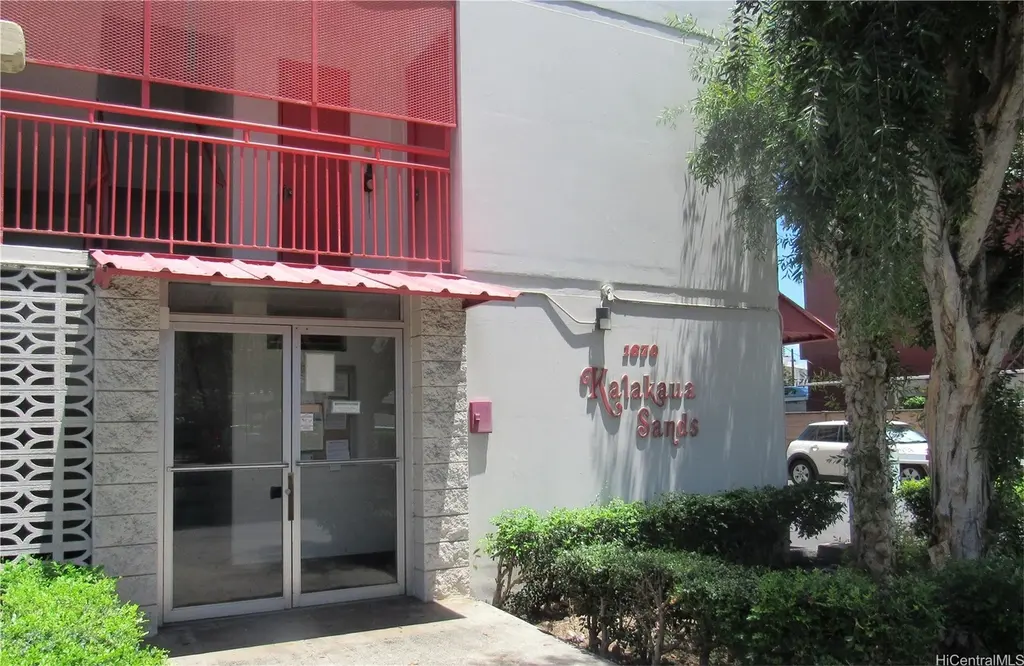
1670 Kalakaua Ave. Kalakaua Ave #603 · Urban Honolulu, HI
Flood risk 5/10 · Moderate
- FEMA flood zone
- X (unshaded)
- Chance of flooding over 30 yrs
- 0.24%
- Est. flood insurance / yr
- $507 – $1,088
Fire risk No data
- Est. fire insurance / yr
- —
Heat risk No data
- Hot days now (above threshold)
- —
- Hot days in 30 yrs
- —
Wind risk No data
- Chance of severe wind over 30 yrs
- —
Air-quality risk 1/10 · Minimal
- Unhealthy air days now
- —
- Unhealthy air days in 30 yrs
- —
Risk factors via First Street. Map © Google.
Why this score? — see what drove the C- grade
The composite is a weighted blend of 9 inputs, each scored 0–100. Each bar is that input's sub-score; the figure is the points it added to the 100-point composite (weight × sub-score).
- ARV discount +13.7/15.0
- Cash flow +13.0/30.0
- 1% rule +5.7/10.0
- Appreciation +4.5/10.0
- DSCR +3.9/10.0
- Schools +3.7/10.0
- Rent growth +3.4/5.0
- Livability +2.5/5.0
- Condition / age +2.5/5.0
$275,000
🖨 Deal sheet 📄 Offer letter ✓ Due diligence
Listing remarks MLS
Clean & spacious One-Bedroom/One-Bath unit with stacked washer/dryer included. Location is a key benefit with a short walk to Palama Market, Don Quijote, eating establishments, and Ala Moana Shopp. Center. Upgraded appliances, custom closet doors, shuttered windows, ceiling fan, and a walk-in shower are added benefits. Separate storage locker on same floor and no parking.
Key facts
- Ceiling fan
- Stacked washer dryer
- Upgraded appliances
Tags
Neighborhood map
What this means for you Summary
Snapshot
- This is a 1-bed/1.0-bath condo listed at $275k.
Deal economics
- At list price, monthly cash flow is $-15 ($-175/yr) — negative.
- To cash-flow at today's rent, offer at most $272k (0.9% below list).
- Meets the 1% rule at list price ($3k rent vs $275k).
- Recommended offer: $258k (6.0% below list) — sets the bar for market timing.
- Cap rate 6.2% vs local median 1.5% in Urban Honolulu — top-decile yield for the area; either an underpriced asset or a hidden risk that comps aren't pricing in. Stress-test before assuming the spread holds.
Location & tenants
- Location reads: area grade C — affects rentability + tenant quality, not the cash-flow math above.
- Hawaii Department Of Education (suburban): math 32% / reading 50% proficiency, ranked #1 of 1 in HI (top 100%) — families likely to look elsewhere, expect single-tenant / working-renter base with shorter leases.
- Market conditions: Rents rising (+3.5%/yr); 161 active listings in the ZIP; 40 comparable units currently listed for rent nearby; rentals at typical pace (median 21d on market — plan ~3-4 weeks tenant-placement turnaround); 1,638 units permitted in Honolulu County in 2024 (793 in 5+ unit buildings).
- At $2,937/mo this rent would consume 52% of the median local household income ($68k/yr) (locally 2466% of renters already pay >50% of income on rent) — very limited rent-growth headroom before tenants either downsize or default.
Forward outlook
- Local home prices are declining (-1.0%/yr); year-one equity from $2k of loan paydown is wiped out by about $3k of value loss. Plan a longer hold.
- Honolulu County population projected at +17% by 2050 — long-run rental-demand tailwind backs the buy-and-hold thesis.
Negotiation context
- It's been on market 83 days — a 6% lower offer ($258k) is reasonable based on typical stale-listing flexibility.
- 2 sale attempts with the ask held roughly flat each time — persistent listings suggest the price (not the market) is what's stuck; bring a comps-based counter.
- Current owner paid $32k; list at $275k implies a 766% gain — meaningful room to come down on a strong offer.
Risks & watch-outs
- Watch-outs: HOA is 25% of rent.
- Climate carrying-cost: moderate flood risk — expect insurance premiums to compound above CPI over the hold.
Questions for the listing agent
- What do current leases actually rent for vs. the listed asking? Can we see a recent rent roll and the last 12 months of T-12 income?
- It's been on market 83 days. Have you received any prior offers? Is the seller open to a 6% concession, seller financing, or rate buy-down credit?
- Built in 1968 — when were the roof, HVAC, electrical panel, plumbing, and water heater last replaced?
- What does the HOA fee cover, when was the last increase, and are there any pending special assessments or reserve-fund shortfalls?
- Any open or pending special assessments — roof, HVAC, plumbing, elevator, façade? What's the per-unit balance and payoff schedule, and is the seller paying it off at close or rolling it to the buyer?
- Why hasn't it sold? Are there any deal-killer items the seller is aware of (foundation, flood, title, zoning, code violations)?
- Is there a deadline driving the sale (1031 exchange, divorce, estate, relocation)? That informs how much negotiation room exists.
- What's the average days-on-market for RENTAL listings here right now (not sales)? A rising rental-DOM trend means longer vacancies and softer asking-rent achievability than the comps imply.
- What's the recent tenant-quality profile in this submarket — average credit score on applications, eviction rate, late-payment / NSF rate, and stable-employment percentage? A property-management company in the area should have these aggregated.
- How much new apartment / multifamily construction is in the pipeline within 1–3 miles? Heavy new supply (>2% of stock underway) typically softens rents 12–24 months out; light construction supports rent growth.
Investment metrics
- 1% rule
- 1.07% ✓
- Cap rate
- 6.23%
- Cash-on-cash
- -0.23%
- DSCR
- 0.99
- GRM
- 7.8
CMA / ARV
- ARV (median comp)
- $318,596
- List price
- $275,000
- Delta
- -13.68%
- Verdict
- UNDERPRICED
- Comps
- 20 within 1.0 mi
Projected returns pro-forma
-1.0% appreciation · 3.55% rent growth · sell at horizon
- IRR
- -5.9%
- Equity multiple
- 0.74×
- Total profit
- $-19,751
- Equity at exit
- $66,317
- IRR
- 1.6%
- Equity multiple
- 1.16×
- Total profit
- $11,986
- Equity at exit
- $69,582
Cash invested: $77,000 (down + closing). Projections, not guarantees.
Landlord ↔ Tenant lean methodology
- Overall (STATE)
- 37 Tenant-Leaning
- State Hawaii
- 37 Tenant-Leaning · D+13
- County
- — inherits STATE
- City
- — inherits STATE
ZIP-level market 96826
- Home prices YoY
- -0.4%
- Rents YoY
- 3.5%
- Active inventory
- 161
- Price-to-rent
- 7.8×
Monthly cashflow live
- Estimated rent
- $2,937 high interval (Pro) →
- Mortgage (P&I)
- −$1,442
- Tax from tax record
- −$48 /mo · $578/yr
- Insurance
- −$115
- HOA
- −$730
- Vacancy / Maint / Mgmt
- −$617
- Net cashflow
- $-15
Break-even live
UW: 25.0% down · 7.5% · 30yr · 1.5% tax · 5.0% vac · 8.0% maint · 8.0% mgmt
Financing live
Cash to close
- Down payment
- $68,750
- Closing costs
- $8,250
- Reserves months
- —
- Total cash needed
- —
Loan-product check · same deal, 3 products live
Conventional
25% down · 7.5% · 30yr
- Down + closing
- —
- Monthly P&I
- —
- Monthly cashflow
- —
- DSCR
- —
- Eligible?
- —
Personal DTI + credit; lowest rate.
DSCR
20% down · 8.5% · 30yr
- Down + closing
- —
- Monthly P&I
- —
- Monthly cashflow
- —
- DSCR
- —
- Eligible?
- —
No personal income docs; deal must DSCR.
Hard money
10% down · 12.0% · 12mo
- Down + closing
- —
- Monthly P&I
- —
- Monthly cashflow
- —
- DSCR
- —
- Eligible?
- —
Short-term bridge; refi at stabilization.
Rent comps 40 comps
| Address | Beds | Baths | Sqft | Rent | $/sqft | DOM | Units | Dist |
|---|---|---|---|---|---|---|---|---|
| 1655 Makaloa St #1510 Honolulu, HI | 1.0 | 1.0 | 500 | $2,600 | $5.20 | 21d | 1 | 0.13mi |
| 1861 Kapiolani Blvd Unit C Honolulu, HI | 1.0 | 1.0 | 525 | $2,700 | $5.14 | 21d | 1 | 0.24mi |
| 475 Atkinson Dr Honolulu, HI | 1.0–2.0 | 1.0 | 798 | $2,600 | $3.26 | 21d | 3 | 0.25mi |
| 475 Atkinson Dr Honolulu, HI | 1.0–2.0 | 1.0 | 855 | $2,700 | $3.16 | 23d | 2 | 0.25mi |
| 419A Atkinson Dr #1103 Honolulu, HI | 2.0 | 1.0 | 664 | $2,700 | $4.07 | 15d | 1 | 0.35mi |
| 419A Atkinson Dr Honolulu, HI | 2.0 | 1.0 | 664 | $2,698 | $4.06 | 16d | 2 | 0.35mi |
| 629 Keeaumoku St Honolulu, HI | 1.0–2.0 | 1.0–2.0 | 923 | $3,400 | $3.68 | 16d | 2 | 0.38mi |
| 629 Keeaumoku St Honolulu, HI | 1.0–2.0 | 1.0–2.0 | 919 | $3,500 | $3.81 | 43d | 2 | 0.38mi |
| 629 Keeaumoku St Honolulu, HI | 1.0 | 1.0 | 618 | $3,350 | $5.42 | 1d | 2 | 0.38mi |
| 1500 Rycroft St Unit 2304 Honolulu, HI | 1.0 | 1.0 | 569 | $3,200 | $5.62 | 23d | 1 | 0.39mi |
| 1500 Rycroft St Unit 3903 Honolulu, HI | 1.0 | 1.0 | 571 | $3,750 | $6.57 | 23d | 1 | 0.39mi |
| 1500 Rycroft St Unit 2607R Honolulu, HI | 1.0 | 1.0 | 618 | $3,500 | $5.66 | 23d | 1 | 0.39mi |
| 1500 Rycroft St Honolulu, HI | 1.0 | 1.0 | 523 | $3,200 | $6.12 | 16d | 1 | 0.39mi |
| 1500 Rycroft St Unit 3005R Honolulu, HI | 1.0 | 1.0 | 523 | $3,200 | $6.12 | 19d | 1 | 0.39mi |
| 1500 Rycroft St Unit 1509R Honolulu, HI | — | 1.0 | 416 | $3,000 | $7.21 | 23d | 1 | 0.39mi |
| 1500 Rycroft St Unit 1904 Honolulu, HI | 1.0 | 1.0 | 564 | $3,400 | $6.03 | 16d | 1 | 0.39mi |
| 1500 Rycroft St Unit 2306R Honolulu, HI | 1.0 | 1.0 | 563 | $4,000 | $7.10 | 43d | 1 | 0.39mi |
| 400 Hobron Ln #2712 Honolulu, HI | 1.0 | 1.0 | 582 | $2,700 | $4.64 | 11d | 1 | 0.39mi |
| 1515 Liona St #4407 Honolulu, HI | 1.0 | 1.0 | 606 | $3,750 | $6.19 | 3d | 1 | 0.39mi |
| 1314 Kalakaua Ave Honolulu, HI | 2.0 | 1.0–2.0 | 773 | $4,675 | $6.04 | 23d | 3 | 0.41mi |
| 411 Hobron Ln Unit 1327718P Honolulu, HI | 1.0 | 1.0 | 538 | $3,558 | $6.61 | 11d | 1 | 0.43mi |
| 411 Hobron Ln Honolulu, HI | 1.0 | 1.0 | 575 | $3,322 | $5.78 | 3d | 4 | 0.44mi |
| 411 Hobron Ln Honolulu, HI | 1.0 | 1.0 | 575 | $3,475 | $6.04 | 44d | 3 | 0.44mi |
| 411 Hobron Ln Honolulu, HI | 1.0 | 1.0 | 566 | $3,575 | $6.31 | 43d | 2 | 0.44mi |
| 425 Ena Rd Unit 204C Honolulu, HI | 1.0 | 1.0 | 600 | $2,700 | $4.50 | 23d | 1 | 0.47mi |
| 1388 Kapiolani Blvd Unit 3910 Honolulu, HI | 1.0 | 1.0 | 619 | $4,000 | $6.46 | 3d | 1 | 0.49mi |
| 1388 Kapiolani Blvd #4205 Honolulu, HI | 1.0 | 1.0 | 567 | $4,500 | $7.94 | 43d | 1 | 0.50mi |
| 1388 Kapiolani Blvd #2703 Honolulu, HI | 1.0 | 1.0 | 574 | $3,500 | $6.10 | 23d | 1 | 0.50mi |
| 1388 Kapiolani Blvd #2903 Honolulu, HI | 1.0 | 1.0 | 574 | $3,500 | $6.10 | 10d | 1 | 0.50mi |
| 1391 Kapiolani Blvd Honolulu, HI | 1.0–3.0 | 1.0–2.0 | 971 | $3,500 | $3.60 | 3d | 2 | 0.51mi |
| 1778 Ala Moana Blvd Unit 1541754P Honolulu, HI | 1.0 | 1.0 | 721 | $4,387 | $6.08 | 14d | 1 | 0.53mi |
| 1315 Liona St Honolulu, HI | 1.0 | 1.0 | 606 | $3,950 | $6.52 | 19d | 1 | 0.54mi |
| 1778 Ala Moana Blvd #1219 Honolulu, HI | 1.0 | 1.0 | 724 | $4,600 | $6.35 | 23d | 1 | 0.55mi |
| 1778 Ala Moana Blvd #801 Honolulu, HI | 1.0 | 1.0 | 724 | $3,400 | $4.70 | 23d | 1 | 0.55mi |
| 1778 Ala Moana Blvd #1307 Honolulu, HI | 1.0 | 1.0 | 683 | $2,900 | $4.25 | 23d | 1 | 0.55mi |
| 1778 Ala Moana Blvd #2606 Honolulu, HI | 1.0 | 1.0 | 724 | $2,895 | $4.00 | 3d | 1 | 0.55mi |
| 1778 Ala Moana Blvd #1317 Honolulu, HI | 1.0 | 1.0 | 683 | $2,775 | $4.06 | 21d | 1 | 0.55mi |
| 1778 Ala Moana Blvd #3318 Honolulu, HI | 1.0 | 1.0 | 683 | $3,400 | $4.98 | 3d | 1 | 0.55mi |
| 1765 Ala Moana Blvd #1183 Honolulu, HI | 1.0 | 1.0 | 440 | $3,100 | $7.05 | 3d | 1 | 0.56mi |
| 2333 Kapiolani Blvd Unit 1008B Honolulu, HI | 2.0 | 1.0 | 600 | $2,700 | $4.50 | 23d | 1 | 0.60mi |
HOA detail condo
- Monthly dues
- $730 · $8,760/yr
- Assessments
- None detected in remarks — confirm with the listing agent.
Listing history 22 events
-
2026-06-18days on market $275,000 Active 83 DOM
-
2026-06-17days on market $275,000 Active 82 DOM
-
2026-06-16days on market $275,000 Active 81 DOM
-
2026-06-15days on market $275,000 Active 80 DOM
-
2026-06-13days on market $275,000 Active 78 DOM
-
2026-06-13days on market $275,000 Active 77 DOM
-
2026-06-10days on market $275,000 Active 75 DOM
-
2026-06-09days on market $275,000 Active 74 DOM
-
2026-06-08days on market $275,000 Active 73 DOM
-
2026-06-07days on market $275,000 Active 72 DOM
-
2026-06-05days on market $275,000 Active 69 DOM
-
2026-06-03days on market $275,000 Active 68 DOM
-
2026-06-02days on market $275,000 Active 67 DOM
-
2026-06-02price $275,000 Active 66 DOM
-
2026-06-01days on market $285,000 Active 66 DOM
-
2026-05-31days on market $285,000 Active 65 DOM
-
2026-03-27$285,000 Active 380-char remark
Show marketing remark (380 chars)
Clean & spacious One-Bedroom/One-Bath unit with stacked washer/dryer included. Location is a key benefit with a short walk to Palama Market, Don Quijote, eating establishments, and Ala Moana Shopp. Center. Upgraded appliances, custom closet doors, shuttered windows, ceiling fan, and a walk-in shower are added benefits. Separate storage locker on same floor and no parking.
-
2025-12-19historical
-
2025-10-06price $275,000
-
2025-06-19price $295,000
-
2025-05-12$305,000 Active
-
1977-11-01soldstatus $31,750
ⓘ Source: listings_history table (triggers on properties + properties_extension) + one-shot
backfill from property_details.listing_events for pre-trigger history.
Tax reassessment forecast HI · Partial reset (capped growth)
- Current annual tax
- $578 · $48/mo
- Projected year-2 tax
- $674 · $56/mo
- Expected delta
- +$96/yr (+$8/mo · 16.7%)
ⓘ Screening estimate from a state-policy table — verify with the county assessor before closing.
Climate risk First Street
- Flood 5/10 Major FEMA zone X (unshaded) · 24% chance over 30 yrs
- Air quality 1/10 Low
Nearby sold comps map
Loading sold comps map…
Walkable amenities ~0.75 mi
Loading nearby amenities…
Taxation est. · year 1
- Rental income
- $35,244
- − Mortgage interest
- −$15,404
- − Property taxes
- −$578
- − Insurance
- −$1,375
- − Repairs & maintenance
- −$2,820
- − Management
- −$2,820
- − HOA
- −$8,760
- − Depreciation
- −$8,000
- Taxable loss
- −$4,512
- Est. tax savings @ 24.0%
- +$1,083
- After-tax cash flow
- $908/yr
For passive investors: Depreciation is non-cash, so a rental often shows a tax loss while cash-flowing — sheltering income. Rental losses are passive: they offset passive income freely, and up to $25,000/yr can offset ordinary (W-2) income if you actively participate and your MAGI is under $100k (phasing out to $0 by $150k); unused losses carry forward. On sale, claimed depreciation is recaptured at up to 25%, and gains may owe capital-gains tax (a 1031 exchange can defer both). Figures are a year-1 estimate at your 24.0% rate — not tax advice; consult a CPA.
Schools (NCES district)
- District
- Hawaii Department Of Education
- NCES district ID
- 1500030
- Math proficiency
- 32% ▼ -10.00%
- Reading proficiency
- 50% ▼ -3.00%
- Median HH income
- $69,005
- Composite
- 37.07/100
- National rank
- #4504
- State rank
- #1 of 1 in HI
Livability — Urban Honolulu
No livability data for this city. (Only ~50 U.S. cities are tracked.)
Census & demographics
- Census place
- Urban Honolulu, HI
- County
- Honolulu County · 963,448 people
- City population
- 309,956
- Metro
- Urban Honolulu, HI
- Population (ZIP)
- 29,174
- Household income
- $68,296
- Rent vs Own
- Severe rent burden
- 2466.0
Population outlook (Honolulu County) Hauer SSP2
- Today (2025)
- 1,072,641 people
- By 2030
- 1,110,460 · +3.5%
- By 2040
- 1,181,593 · +10.2%
- By 2050
- 1,257,584 · +17.2%
- By 2075
- 1,501,120 · +39.9%
- By 2100
- 1,764,430 · +64.5%
Race, ethnicity, and origin ACS 2023
- Neighborhood character
- Diverse neighborhood (Simpson 0.69)
- Race & ethnicity
- Asian 54% Two or more races 18% White 13% Pacific Islander 10% Hispanic / Latino 6% Black 2%
- Hispanic origin (detail)
- Mexican 3% Puerto Rican 2%
- Common ancestry
- Russian 1% Lithuanian 1% Serbian 1%
- Foreign-born
- 30% · Vietnam, China, South Korea
- Languages at home
- 63% English-only · Other Asian/Pacific 13% Chinese 6% Vietnamese 6%
Political lean MEDSL · Honolulu
- 2024 margin
- Strong D (+21.6) · D 59.9% · R 38.3% · Other 1.8%
- 2008→2024 swing
- -19.4pp toward R · 2008: 41.1pp · 2024: 21.6pp
- All cycles
- 2024: D+21.6 2020: D+26.9 2016: D+29.9 2012: D+39.1 2008: D+41.1
Not yet ingested
- Civics
- —
Market trends
- HPI YoY
- ▼ -1.00%
- Current HPI
- 272.9183
- Rent YoY
- ▲ 3.55%
- Metro
- Urban Honolulu, HI
- State GDP YoY
- —
- F500 in state
- 0
Price history
+797.6% since first listed6 events — show timeline
- 2026-03-27 Listed $285,000 HiCentral MLS
- 2025-12-19 Listing Removed — HiCentral MLS
- 2025-10-06 Price Changed $275,000 HiCentral MLS
- 2025-06-19 Price Changed $295,000 HiCentral MLS
- 2025-05-12 Listed $305,000 HiCentral MLS
- 1977-11-01 Sold (Public Records) $31,750 Public Records
Property tax history
+4.4%/yrLatest (2022): $578 · +8.7% YoY. Source: county tax records.
Cash-flow waterfall
monthlySold comps — $/sqft
last 12 mo · ≤1 miLoading sold comps…