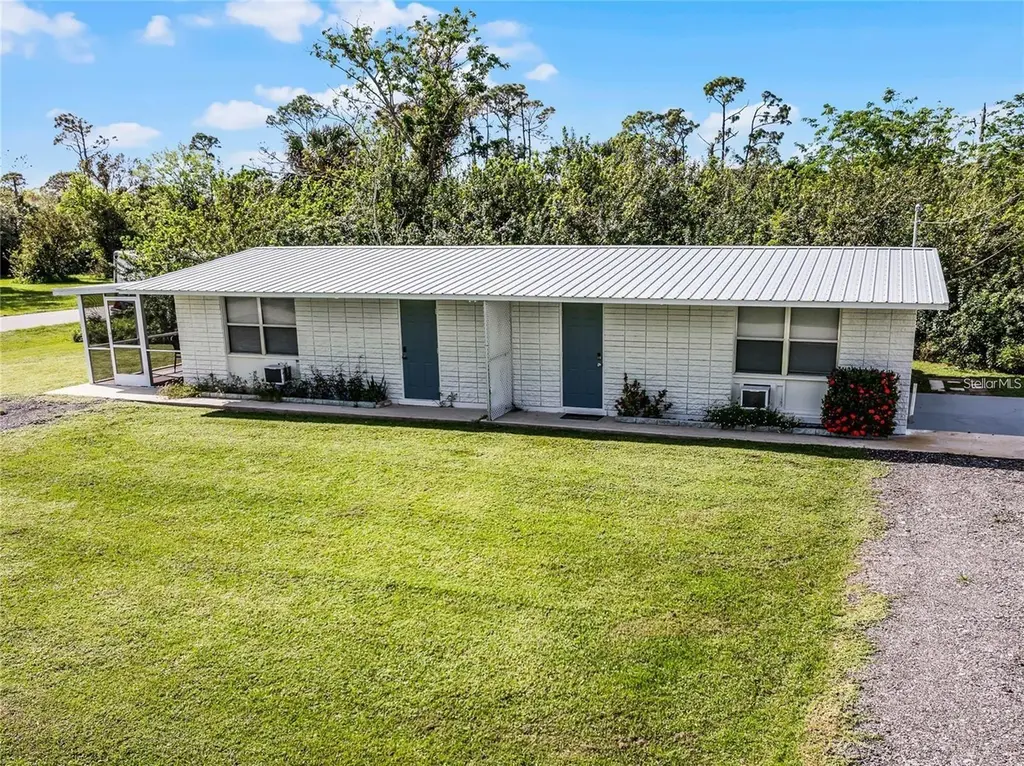
 Duplex
11403 & 11405 Alligator St · Punta Gorda, FL
Flood risk 1/10 · Minimal
- FEMA flood zone
- D
- Chance of flooding over 30 yrs
- 0.0%
- Est. flood insurance / yr
- $544 – $1,084
Fire risk 5/10 · Moderate
- Est. fire insurance / yr
- $947 – $1,759
Heat risk 10/10 · Severe
- Hot days now (above 108°F)
- 7 days/yr
- Hot days in 30 yrs
- 28 days/yr
Wind risk 10/10 · Severe
- Chance of severe wind over 30 yrs
- 99.0%
Air-quality risk 3/10 · Minor
- Unhealthy air days now
- 2 days/yr
- Unhealthy air days in 30 yrs
- 2 days/yr
Risk factors via First Street. Map © Google.
Why this score? — see what drove the B grade
The composite is a weighted blend of 9 inputs, each scored 0–100. Each bar is that input's sub-score; the figure is the points it added to the 100-point composite (weight × sub-score).
- Cash flow +30.0/30.0
- 1% rule +10.0/10.0
- DSCR +10.0/10.0
- ARV discount +7.5/15.0
- Schools +4.6/10.0
- Livability +3.8/5.0
- Rent growth +2.5/5.0
- Condition / age +2.5/5.0
- Appreciation +0.0/10.0
$199,900
🖨 Deal sheet 📄 Offer letter ✓ Due diligence
Multi-family units
County records classify this as Multi-Family (2-4 Unit). Listing-text estimate: 2 units. confirmed
Listing remarks
Under contract-accepting backup offers. Charming and fully furnished 2-bedroom, 1-bath duplex ideally located in Punta Gorda between Burnt Store Road and US-41/Tamiami Trail. Enjoy convenient access to shopping, dining, medical facilities, and I-75—making commutes to Fort Myers or Sarasota a breeze. This home blends classic Old Florida charm with modern conveniences, offering a warm and comfortable living space. The oversized yard provides ample room to relax, with no rear neighbors for added privacy. Tenant occupied—showings by appointment only with advance notice.
Key facts
- Oversized yard
- No rear neighbors
- Convenient access
Tags
Property features AI
Finance
- Other: Total buildings: 1; Total acreage: 0.18 acres (less than 1/4 acre); Living area reported: 1,224 (public records); Total building area reported: 1,678 (public records); Unit details: two 2-bedroom units; each unit heated area listed as 839 and pro forma listed as 1,200
- Financial info: Property operates as residential income with two units; Gross income reported: $28,800; Annual net income reported: $18,658; Gross lease terms; tenant pays electricity
- HOA & community: No association
Exterior
- Utilities: Well water; Septic tank; Electricity connected (private)
- Home design: Duplex (residential income property); One story
- Construction: Block and stucco construction; Metal roof; Slab foundation; Building completed
- Exterior features: Covered, enclosed and screened porch; Private mailbox; Corner lot; Paved lot and road
Interior
- Kitchen: Cooktop; Range; Microwave; Refrigerator
- Bedrooms: 4 bedrooms total; Two 2-bedroom units (each unit has 2 bedrooms)
- Flooring: Tile
- Bathrooms: Each unit has 1 bathroom (two units total)
- Heating & cooling: Ductless heating; Wall/window air conditioning units
- Interior features: Ceiling fans; Kitchen/family room combo
- Laundry & utility: No laundry room (None listed)
Neighborhood map
What this means for you Summary
Snapshot
- This is a 2 × 2-bed/1.0-bath units multifamily listed at $200k.
Deal economics
- At list price, monthly cash flow is $2k ($21k/yr) — positive. Per door: $863/mo.
- The deal already cash-flows at list — no discount required.
- Meets the 1% rule at list price ($4k rent vs $200k).
- Recommended offer: $197k (1.5% below list) — sets the bar for market timing.
- Cap rate 16.7% vs local median 2.8% in Punta Gorda — top-decile yield for the area; either an underpriced asset or a hidden risk that comps aren't pricing in. Stress-test before assuming the spread holds.
Location & tenants
- Location reads 76/100 on livability (#225 in FL, #3,567 nationally) — a middle-class / working-renter tenant base. Strengths: schools A+, crime A+, health & safety A+; Watch: cost of living D+, amenities D-, commute F.
- Charlotte (suburban): math 54% / reading 54% proficiency, ranked #22 of 73 in FL (top 30%) — acceptable for families but not a draw, mixed tenant base, ~2y average lease.
- Market conditions: 1481 active listings in the ZIP; 1 comparable units currently listed for rent nearby; solid renter incomes; 4,585 units permitted in Charlotte County in 2024 (703 in 5+ unit buildings).
- At $4,054/mo this rent would consume 63% of the median local household income ($77k/yr) (locally 226% of renters already pay >50% of income on rent) — very limited rent-growth headroom before tenants either downsize or default.
Forward outlook
- Local home prices are declining (-3.0%/yr); year-one equity from $1k of loan paydown is wiped out by about $6k of value loss. Plan a longer hold.
- Charlotte County population projected at +24% by 2050 — long-run rental-demand tailwind backs the buy-and-hold thesis.
- At projected returns (-3.0% appreciation + 3.0% rent growth), your $56k cash investment doubles in ~4 years — after that, you're playing with house money.
Negotiation context
- It's been on market 28 days — a 2% lower offer ($197k) is reasonable based on typical stale-listing flexibility.
- 7 sale attempts since 3y ago with the ask held roughly flat each time — persistent listings suggest the price (not the market) is what's stuck; bring a comps-based counter.
Risks & watch-outs
- Watch-outs: built in 1959 — expect roof / HVAC / electrical / plumbing capex.
- Climate carrying-cost: severe wind risk, 99% chance of damaging wind over 30y; moderate wildfire risk; extreme-heat days projected 7→28/yr by 2055 (HVAC capex compounding) — expect insurance premiums to compound above CPI over the hold.
Questions for the listing agent
- Can we see the unit-by-unit rent roll, current vacancy, and any below-market leases? What's the average tenancy length?
- What capital expenditures (roof, boiler, parking lot, exteriors) have been made in the last 5 years, and what's planned in the next 2?
- Built in 1959 — when were the roof, HVAC, electrical panel, plumbing, and water heater last replaced?
- Is there a deadline driving the sale (1031 exchange, divorce, estate, relocation)? That informs how much negotiation room exists.
- Schools are A-rated — typically a magnet for longer-tenancy family renters. What's the average tenant stay here, and is there a school-zone premium baked into asking?
- What's the average days-on-market for RENTAL listings here right now (not sales)? A rising rental-DOM trend means longer vacancies and softer asking-rent achievability than the comps imply.
- What's the recent tenant-quality profile in this submarket — average credit score on applications, eviction rate, late-payment / NSF rate, and stable-employment percentage? A property-management company in the area should have these aggregated.
- How much new apartment / multifamily construction is in the pipeline within 1–3 miles? Heavy new supply (>2% of stock underway) typically softens rents 12–24 months out; light construction supports rent growth.
Investment metrics
- 1% rule
- 2.03% ✓
- Cap rate
- 16.65%
- Cash-on-cash
- 36.99%
- DSCR
- 2.65
- GRM
- 4.1
CMA / ARV
No comps found within radius.
Projected returns pro-forma
-3.0% appreciation · 3.0% rent growth · sell at horizon
- IRR
- 32.9%
- Equity multiple
- 2.39×
- Total profit
- $77,623
- Equity at exit
- $29,806
- IRR
- 39.9%
- Equity multiple
- 4.74×
- Total profit
- $209,587
- Equity at exit
- $17,284
Cash invested: $55,972 (down + closing). Projections, not guarantees.
Landlord ↔ Tenant lean methodology
- Overall (STATE)
- 87 Strongly Landlord-Friendly
- State Florida
- 87 Strongly Landlord-Friendly · R+3
- County
- — inherits STATE
- City
- — inherits STATE
ZIP-level market 33955
- Home prices YoY
- -24.5%
- Active inventory
- 1481
- Price-to-rent
- 8.2×
Monthly cashflow live
- Estimated rent
- $4,054 medium interval (Pro) →
- Mortgage (P&I)
- −$1,048
- Tax from tax record
- −$346 /mo · $4,147/yr
- Insurance
- −$83
- HOA
- −$0
- Vacancy / Maint / Mgmt
- −$851
- Net cashflow
- $1,725
Break-even live
2-unit breakdown (identical units grouped — click to expand)
| Units | Beds | Baths | Est. rent |
|---|---|---|---|
| 2× units | 2 | 1 | $4,054 |
| #1 | 2 | 1 | $2,027 |
| #2 | 2 | 1 | $2,027 |
| Total (2 units) | $4,054 | ||
UW: 25.0% down · 7.5% · 30yr · 1.5% tax · 5.0% vac · 8.0% maint · 8.0% mgmt
Financing live
Cash to close
- Down payment
- $49,975
- Closing costs
- $5,997
- Reserves months
- —
- Total cash needed
- —
Loan-product check · same deal, 3 products live
Conventional
25% down · 7.5% · 30yr
- Down + closing
- —
- Monthly P&I
- —
- Monthly cashflow
- —
- DSCR
- —
- Eligible?
- —
Personal DTI + credit; lowest rate.
DSCR
20% down · 8.5% · 30yr
- Down + closing
- —
- Monthly P&I
- —
- Monthly cashflow
- —
- DSCR
- —
- Eligible?
- —
No personal income docs; deal must DSCR.
Hard money
10% down · 12.0% · 12mo
- Down + closing
- —
- Monthly P&I
- —
- Monthly cashflow
- —
- DSCR
- —
- Eligible?
- —
Short-term bridge; refi at stabilization.
Rent comps 1 comps
| Address | Beds | Baths | Sqft | Rent | $/sqft | DOM | Units | Dist |
|---|---|---|---|---|---|---|---|---|
| 7361 S Plum Tree Punta Gorda, FL | 3.0 | 2.0 | 1373 | $1,900 | $1.38 | 21d | 1 | 0.67mi |
Listing history 26 events
-
2026-06-05remarks 572-char remark
-
2026-06-05statusdays on market $199,900 Pending 28 DOM
-
2026-06-03days on market $199,900 Active 27 DOM
-
2026-06-02days on market $199,900 Active 26 DOM
-
2026-06-01days on market $199,900 Active 25 DOM
-
2026-05-31days on market $199,900 Active 24 DOM
-
2026-05-30days on market $199,900 Active 23 DOM
-
2026-05-07$199,900 Active
-
2025-05-04historical $1,200
-
2025-04-21$1,200
-
2025-04-21historical $1,200
-
2025-02-20price $1,200
-
2025-01-25$1,400
-
2025-01-25historical $1,400
-
2025-01-24$1,400
-
2025-01-09price $350,000
-
2024-12-17historical
-
2024-11-20$360,000 Active
-
2024-11-20$360,000 Active
-
2023-12-22soldstatus $325,000
-
2023-12-21status Pending
-
2023-12-19soldstatus $325,000 Closed
-
2023-12-19soldstatus $325,000 Closed
-
2023-11-14status Pending
-
2023-11-07$324,900 Active
-
2002-07-12soldstatus $30,000
ⓘ Source: listings_history table (triggers on properties + properties_extension) + one-shot
backfill from property_details.listing_events for pre-trigger history.
Tax reassessment forecast FL · Resets to sale price
- Current annual tax
- $4,147 · $346/mo
- Projected year-2 tax
- $4,147 · $346/mo
- Expected delta
- $0/yr ($0/mo · 0.0%)
ⓘ Screening estimate from a state-policy table — verify with the county assessor before closing.
Climate risk First Street
- Flood 1/10 Low FEMA zone D · 0% chance over 30 yrs
- Wildfire 5/10 Major
- Heat 10/10 Extreme 7 d/yr ≥108°F today · 28 d/yr by 30 yrs out
- Wind 10/10 Extreme 99% chance of damaging wind over 30 yrs
- Air quality 3/10 Moderate 2 unhealthy d/yr today · 2 by 30 yrs out
Nearby sold comps map
Loading sold comps map…
Walkable amenities ~0.75 mi
Loading nearby amenities…
Taxation est. · year 1
- Rental income
- $48,648
- − Mortgage interest
- −$11,198
- − Property taxes
- −$4,147
- − Insurance
- −$1,000
- − Repairs & maintenance
- −$3,892
- − Management
- −$3,892
- − Depreciation
- −$5,815
- Taxable income
- $18,705
- Est. tax owed @ 24.0%
- −$4,489
- After-tax cash flow
- $16,216/yr
For passive investors: Depreciation is non-cash, so a rental often shows a tax loss while cash-flowing — sheltering income. Rental losses are passive: they offset passive income freely, and up to $25,000/yr can offset ordinary (W-2) income if you actively participate and your MAGI is under $100k (phasing out to $0 by $150k); unused losses carry forward. On sale, claimed depreciation is recaptured at up to 25%, and gains may owe capital-gains tax (a 1031 exchange can defer both). Figures are a year-1 estimate at your 24.0% rate — not tax advice; consult a CPA.
Schools (NCES district)
- District
- Charlotte
- NCES district ID
- 1200240
- Math proficiency
- 54% ▼ -6.00%
- Reading proficiency
- 54% ▼ -1.00%
- Median HH income
- $44,864
- Composite
- 45.62/100
- National rank
- #2586
- State rank
- #22 of 73 in FL
Livability — Punta Gorda
- Score
- 76/100
- State rank
- #225
- US rank
- #3567
Category grades
Schools grade is shown separately in the Schools card above.
Census & demographics
- County
- Charlotte County · 196,994 people
- City population
- 68,831
- Metro
- Punta Gorda, FL
- Population (ZIP)
- 12,399
- Household income
- $76,943
- Rent vs Own
- Severe rent burden
- 226.0
Population outlook (Charlotte County) Hauer SSP2
- Today (2025)
- 198,646 people
- By 2030
- 210,507 · +6.0%
- By 2040
- 230,857 · +16.2%
- By 2050
- 247,148 · +24.4%
- By 2075
- 281,777 · +41.8%
- By 2100
- 293,609 · +47.8%
Race, ethnicity, and origin ACS 2023
- Neighborhood character
- Predominantly White (84%)
- Race & ethnicity
- White 84% Hispanic / Latino 10% Two or more races 9% Black 2%
- Hispanic origin (detail)
- Mexican 4% Puerto Rican 2% Cuban 4%
- Common ancestry
- Romanian 5% Italian 3% Serbian 3%
- Foreign-born
- 8% · Canada
- Languages at home
- 91% English-only · Spanish 5% Other Indo-European 1%
Political lean MEDSL · Charlotte
- 2024 margin
- Solid R (+34.0) · D 32.7% · R 66.7%
- 2008→2024 swing
- -26.7pp toward R · 2008: -7.2pp · 2024: -34.0pp
- All cycles
- 2024: R+34.0 2020: R+26.6 2016: R+27.8 2012: R+14.3 2008: R+7.2
Not yet ingested
- Civics
- —
Market trends
- HPI YoY
- ▼ -78.71%
- Current HPI
- 242.9043
- Rent YoY
- —
- Metro
- Punta Gorda, FL
- State GDP YoY
- ▲ 3.28%
- F500 in state
- 36
Industry mix (Fortune 500 HQ in FL)
| Industry | F500 HQs | Revenue |
|---|---|---|
| Industrial Technology | 2 | $29B |
|
||
| Insurance | 2 | $17B |
|
||
| Retail | 1 | $60B |
|
||
| Technology Distribution | 1 | $58B |
|
||
| Homebuilding | 1 | $35B |
|
||
| Technology Manufacturing | 1 | $35B |
|
||
Price history
+566.3% since first listed19 events — show timeline
- 2026-05-07 Listed $199,900 Stellar MLS as Distributed by MLS Grid
- 2025-05-04 Rental Removed $1,200 APPFOLIO
- 2025-04-21 Listed for Rent $1,200 APPFOLIO
- 2025-04-21 Rental Removed $1,200 APPFOLIO
- 2025-02-20 Price Changed $1,200 APPFOLIO
- 2025-01-25 Listed for Rent $1,400 APPFOLIO
- 2025-01-25 Rental Removed $1,400 STELLARMLS
- 2025-01-24 Listed for Rent $1,400 STELLARMLS
- 2025-01-09 Price Changed $350,000 Stellar MLS as Distributed by MLS Grid
- 2024-12-17 Listing Removed — Stellar MLS as Distributed by MLS Grid
- 2024-11-20 Listed $360,000 Stellar MLS as Distributed by MLS Grid
- 2024-11-20 Listed $360,000 Stellar MLS as Distributed by MLS Grid
- 2023-12-22 Sold (Public Records) $325,000 Public Records
- 2023-12-21 Pending — Stellar MLS as Distributed by MLS Grid
- 2023-12-19 Sold (MLS) $325,000 Stellar MLS as Distributed by MLS Grid
- 2023-12-19 Sold (MLS) $325,000 Stellar MLS as Distributed by MLS Grid
- 2023-11-14 Pending — Stellar MLS as Distributed by MLS Grid
- 2023-11-07 Listed $324,900 Stellar MLS as Distributed by MLS Grid
- 2002-07-12 Sold (Public Records) $30,000 Public Records
Property tax history
+12.7%/yrLatest (2025): $4,147 · -5.7% YoY. Source: county tax records.
Cash-flow waterfall
monthlySold comps — $/sqft
last 12 mo · ≤1 miLoading sold comps…