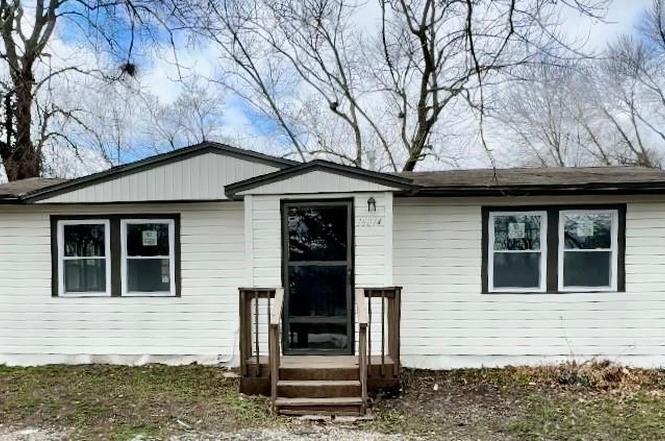
16014 Valentine Ave · Belton, MO
Flood risk 1/10 · Minimal
- FEMA flood zone
- X (unshaded)
- Chance of flooding over 30 yrs
- 0.0%
- Est. flood insurance / yr
- $473 – $860
Fire risk 3/10 · Minor
- Est. fire insurance / yr
- $1,054 – $1,958
Heat risk 4/10 · Minor
- Hot days now (above 107°F)
- 7 days/yr
- Hot days in 30 yrs
- 17 days/yr
Wind risk 2/10 · Minimal
- Chance of severe wind over 30 yrs
- —
Air-quality risk 2/10 · Minimal
- Unhealthy air days now
- 2 days/yr
- Unhealthy air days in 30 yrs
- 2 days/yr
Risk factors via First Street. Map © Google.
Why this score? — see what drove the D+ grade
The composite is a weighted blend of 9 inputs, each scored 0–100. Each bar is that input's sub-score; the figure is the points it added to the 100-point composite (weight × sub-score).
- Cash flow +14.7/30.0
- ARV discount +10.4/15.0
- DSCR +4.5/10.0
- Rent growth +3.8/5.0
- Livability +3.8/5.0
- 1% rule +3.2/10.0
- Schools +3.0/10.0
- Condition / age +2.5/5.0
- Appreciation +0.0/10.0
$165,000
🖨 Deal sheet (PDF) 📄 Offer letter ✓ Due diligence
Key facts
- Huge yard
- Vinyl windows
- Private oasis
Tags
Property features AI
Finance
- Financial info: Annual tax amount reported
Exterior
- Parking: Off-street parking
- Utilities: Public water; Public sewer
- Home design: Single-family residence; Residential property; One-story (ranch)
- Construction: Composition roof; Other construction materials; Property age: 51–75 years
- Exterior features: Lot approximately 14,985 square feet
Interior
- Bedrooms: 2 bedrooms
- Bathrooms: 1 full bathroom
- Heating & cooling: Natural gas heating; Window air conditioning units
- Interior features: Ranch floor plan; Crawl space basement
Neighborhood map
What this means for you Summary
Snapshot
- This is a 2-bed/1.0-bath single-family listed at $165k.
Deal economics
- At list price, monthly cash flow is $42 ($503/yr) — positive.
- The deal already cash-flows at list — no discount required.
- To meet the 1% rule (rent ≥ 1% of price), the offer needs to be $135k (18.0% below list).
- Recommended offer: $135k (18.0% below list) — sets the bar for 1% rule.
- Cap rate 6.6% vs local median 4.7% in Belton — top-decile yield for the area; either an underpriced asset or a hidden risk that comps aren't pricing in. Stress-test before assuming the spread holds.
Location & tenants
- Location reads 76/100 on livability (#52 in MO, #3,782 nationally) — a middle-class / working-renter tenant base. Strengths: cost of living A+, housing A+, health & safety A+; Watch: crime C-, commute F.
- Belton 124 (suburban): math 28% / reading 39% proficiency, ranked #216 of 324 in MO (top 67%) — families likely to look elsewhere, expect single-tenant / working-renter base with shorter leases.
- Zoned schools: Wilckens Steam Acad @Hillcrest (math 44% / reading 47%, grade D-, #405 of 1,115 statewide, top 37%, 474 students, 37% FRL); Belton Middle School (math 24% / reading 35%, grade F, #291 of 391 statewide, top 76%, 639 students, 46% FRL); Belton High (math 27% / reading 59%, grade F, #211 of 521 statewide, top 41%, 1,374 students, 42% FRL) — zoned schools at 42% FRL track the district average.
- Market conditions: Rents rising fast (+5.2%/yr); 205 active listings in the ZIP; 7 comparable units currently listed for rent nearby; rentals leasing fast (median 10d on market — plan ~1-2 weeks tenant-placement turnaround); 588 units permitted in Cass County in 2024 (0 in 5+ unit buildings).
Forward outlook
- Local home prices are declining (-3.0%/yr); year-one equity from $1k of loan paydown is wiped out by about $5k of value loss. Plan a longer hold.
- Cass County population projected to shrink 3% by 2050 — rents likely to lag national; underwrite the cash flow, not the appreciation.
Negotiation context
- It's been on market 67 days — a 6% lower offer ($155k) is reasonable based on typical stale-listing flexibility.
- 3 sale attempts since 5y ago with the ask held roughly flat each time — persistent listings suggest the price (not the market) is what's stuck; bring a comps-based counter.
Risks & watch-outs
- Watch-outs: built in 1952 — expect roof / HVAC / electrical / plumbing capex.
Questions for the listing agent
- It's been on market 67 days. Have you received any prior offers? Is the seller open to a 18% concession, seller financing, or rate buy-down credit?
- Built in 1952 — when were the roof, HVAC, electrical panel, plumbing, and water heater last replaced?
- Why hasn't it sold? Are there any deal-killer items the seller is aware of (foundation, flood, title, zoning, code violations)?
- Is there a deadline driving the sale (1031 exchange, divorce, estate, relocation)? That informs how much negotiation room exists.
- Schools are D-rated, which usually means shorter tenancies and higher turnover. Who's the typical renter profile here, and what's been the actual vacancy rate?
- The area grade is low — what's the realistic commute time and amenity access for the typical tenant pool here? Any planned neighborhood developments (good or bad) we should know about?
- What's the average days-on-market for RENTAL listings here right now (not sales)? A rising rental-DOM trend means longer vacancies and softer asking-rent achievability than the comps imply.
- What's the recent tenant-quality profile in this submarket — average credit score on applications, eviction rate, late-payment / NSF rate, and stable-employment percentage? A property-management company in the area should have these aggregated.
- How much new for-sale + rental construction is in the pipeline within 1–3 miles? Heavy new supply typically softens prices + rents 12–24 months out; constrained supply supports both.
Investment metrics
- 1% rule
- 0.82% ✗
- Cap rate
- 6.60%
- Cash-on-cash
- 1.09%
- DSCR
- 1.05
- GRM
- 10.2
CMA / ARV
- ARV (on-the-fly)
- $176,204
- Comps found
- 8
Show comp detail 8 sales within ~0.75 mi
| Address | Dist | Beds/Ba | Sqft | Sold | Price | $/sf | Match |
|---|---|---|---|---|---|---|---|
| 16014 Valentine Ave | 0.00mi | 2/1.0 | 858 (-1%) | 0mo | $165,000 | $192 | 98 |
| 7010 E 160th St | 0.17mi | 2/1.0 | 840 (-3%) | 9mo | $200,000 | $238 | 79 |
| 16000 Lawrence Ave | 0.20mi | 3/1.0 (+1) | 840 (-3%) | 3mo | $85,000 | $101 | 78 |
| 16110 Hight Ave | 0.45mi | 2/1.0 | 840 (-3%) | 10mo | $150,000 | $179 | 65 |
| 16102 Allen Ave | 0.41mi | 1/1.0 (-1) | 920 (+6%) | 21mo | $115,000 | $125 | 48 |
| 15707 Ann Ave | 0.49mi | 3/1.0 (+1) | 912 (+5%) | 23mo | $210,000 | $230 | 45 |
| 15707 Allen Ave | 0.57mi | 2/1.0 | 816 (-6%) | 23mo | $167,900 | $206 | 44 |
| 15513 Allen Ave | 0.68mi | 3/1.0 (+1) | 960 (+11%) | 12mo | $195,000 | $203 | 35 |
Match score weights: distance 35% · size 25% · config 20% · recency 20%. Top-matched comps best support the ARV.
Projected returns pro-forma
-3.0% appreciation · 5.17% rent growth · sell at horizon
- IRR
- -12.4%
- Equity multiple
- 0.54×
- Total profit
- $-21,098
- Equity at exit
- $24,602
- IRR
- -0.6%
- Equity multiple
- 0.95×
- Total profit
- $-2,181
- Equity at exit
- $14,266
Cash invested: $46,200 (down + closing). Projections, not guarantees.
Landlord ↔ Tenant lean methodology
- Overall (STATE)
- 81 Strongly Landlord-Friendly
- State Missouri
- 81 Strongly Landlord-Friendly · R+10
- County
- — inherits STATE
- City
- — inherits STATE
ZIP-level market 64012
- Rents YoY
- 5.2%
- Active inventory
- 205
- Price-to-rent
- 10.2×
Monthly cashflow live
- Estimated rent
- $1,354 high interval (Pro) →
- Mortgage (P&I)
- −$865
- Tax from tax record
- −$93 /mo · $1,121/yr
- Insurance
- −$69
- HOA
- −$0
- Vacancy / Maint / Mgmt
- −$284
- Net cashflow
- $42
Break-even live
Sensitivity live
| Price | -10% $135 | -5% $89 | +0% $42 | +5% $-5 | +10% $-51 |
|---|---|---|---|---|---|
| Rent | -10% $-65 | -5% $-12 | +0% $42 | +5% $95 | +10% $149 |
| Rate | -1.0pp $125 | -0.5pp $84 | base $42 | +0.5pp $-1 | +1.0pp $-44 |
UW: 25.0% down · 7.5% · 30yr · 1.5% tax · 5.0% vac · 8.0% maint · 8.0% mgmt
Financing live
Cash to close
- Down payment
- $41,250
- Closing costs
- $4,950
- Reserves months
- —
- Total cash needed
- —
Loan-product check · same deal, 3 products live
Conventional
25% down · 7.5% · 30yr
- Down + closing
- —
- Monthly P&I
- —
- Monthly cashflow
- —
- DSCR
- —
- Eligible?
- —
Personal DTI + credit; lowest rate.
DSCR
20% down · 8.5% · 30yr
- Down + closing
- —
- Monthly P&I
- —
- Monthly cashflow
- —
- DSCR
- —
- Eligible?
- —
No personal income docs; deal must DSCR.
Hard money
10% down · 12.0% · 12mo
- Down + closing
- —
- Monthly P&I
- —
- Monthly cashflow
- —
- DSCR
- —
- Eligible?
- —
Short-term bridge; refi at stabilization.
Rent comps 7 comps
| Address | Beds | Baths | Sqft | Rent | $/sqft | DOM | Units | Dist |
|---|---|---|---|---|---|---|---|---|
| 15319 Grand Summit Ext Grandview, MO | 1.0–2.0 | 1.0–2.0 | 818 | $1,150 | $1.41 | 45d | 1 | 0.90mi |
| 301 Towne Center Dr Belton, MO | 1.0–2.0 | 1.0–2.0 | 1069 | $1,799 | $1.68 | 3d | 9 | 1.02mi |
| 6407 E 163rd St Belton, MO | 1.0 | 1.0 | 782 | $1,492 | $1.91 | 3d | 4 | 1.03mi |
| 6205 E 152 Ter Unit B Grandview, MO | 2.0 | 1.0 | 550 | $850 | $1.55 | 9d | 1 | 1.21mi |
| 6007 E 152nd St Grandview, MO | 1.0 | 1.0 | 580 | $725 | $1.25 | 6d | 1 | 1.26mi |
| 6003 E 151st Ter Unit A Grandview, MO | 2.0 | 1.0 | 650 | $975 | $1.50 | 45d | 1 | 1.32mi |
| 8201 Spring Valley Rd Apt 13D Belton, MO | 2.0 | 1.0 | 750 | $850 | $1.13 | 25d | 1 | 1.37mi |
Listing history 7 events
-
2026-05-18status Pending
-
2026-03-12$165,000 Active
-
2025-11-15historical
-
2025-10-23$135,000 Active
-
2021-05-06historical
-
2021-03-04price $85,000
-
2021-03-04$850,000 Active
ⓘ Source: listings_history table (triggers on properties + properties_extension) + one-shot
backfill from property_details.listing_events for pre-trigger history.
Tax reassessment forecast MO · Resets to sale price
- Current annual tax
- $1,121 · $93/mo
- Projected year-2 tax
- $1,600 · $133/mo
- Expected delta
- +$480/yr (+$40/mo · 42.8%)
ⓘ Screening estimate from a state-policy table — verify with the county assessor before closing.
Climate risk First Street
- Flood 1/10 Low FEMA zone X (unshaded) · 0% chance over 30 yrs
- Wildfire 3/10 Moderate
- Heat 4/10 Moderate 7 d/yr ≥107°F today · 17 d/yr by 30 yrs out
- Wind 2/10 Low
- Air quality 2/10 Low 2 unhealthy d/yr today · 2 by 30 yrs out
Nearby sold comps map
Loading sold comps map…
Walkable amenities ~0.75 mi
Loading nearby amenities…
Taxation est. · year 1
- Rental income
- $16,243
- − Mortgage interest
- −$9,243
- − Property taxes
- −$1,121
- − Insurance
- −$825
- − Repairs & maintenance
- −$1,299
- − Management
- −$1,299
- − Depreciation
- −$4,800
- Taxable loss
- −$2,344
- Est. tax savings @ 24.0%
- +$563
- After-tax cash flow
- $1,066/yr
For passive investors: Depreciation is non-cash, so a rental often shows a tax loss while cash-flowing — sheltering income. Rental losses are passive: they offset passive income freely, and up to $25,000/yr can offset ordinary (W-2) income if you actively participate and your MAGI is under $100k (phasing out to $0 by $150k); unused losses carry forward. On sale, claimed depreciation is recaptured at up to 25%, and gains may owe capital-gains tax (a 1031 exchange can defer both). Figures are a year-1 estimate at your 24.0% rate — not tax advice; consult a CPA.
Schools (NCES district)
- District
- Belton 124
- NCES district ID
- 2904620
- Math proficiency
- 28% ▼ -9.00%
- Reading proficiency
- 39% ▼ -9.00%
- Median HH income
- $56,946
- Composite
- 29.73/100
- National rank
- #6446
- State rank
- #216 of 324 in MO
Livability — Belton
- Score
- 76/100
- State rank
- #52
- US rank
- #3782
Category grades
Schools grade is shown separately in the Schools card above.
Census & demographics
- Census place
- Belton, MO
- County
- Cass County · 65,358 people
- City population
- 29,304
- Metro
- Kansas City, MO-KS
- Population (ZIP)
- 29,304
- Household income
- $71,814
- Rent vs Own
- Severe rent burden
- 1081.0
Population outlook (Cass County) Hauer SSP2
- Today (2025)
- 105,292 people
- By 2030
- 106,109 · +0.8%
- By 2040
- 105,786 · +0.5%
- By 2050
- 102,062 · -3.1%
- By 2075
- 88,569 · -15.9%
- By 2100
- 68,293 · -35.1%
Race, ethnicity, and origin ACS 2023
- Neighborhood character
- Predominantly White (80%)
- Race & ethnicity
- White 80% Two or more races 7% Hispanic / Latino 7% Black 6% Asian 1%
- Hispanic origin (detail)
- Mexican 5%
- Common ancestry
- Italian 2% Lithuanian 2% Portuguese 2%
- Foreign-born
- 2% · Canada
- Languages at home
- 96% English-only · Spanish 2% German/W. Germanic 1% Other Asian/Pacific 1%
Political lean MEDSL · Cass
- 2024 margin
- Solid R (+32.1) · D 33.3% · R 65.4% · Other 1.3%
- 2008→2024 swing
- -12.5pp toward R · 2008: -19.6pp · 2024: -32.1pp
- All cycles
- 2024: R+32.1 2020: R+31.6 2016: R+35.9 2012: R+28.4 2008: R+19.6
Not yet ingested
- Civics
- —
Market trends
- HPI YoY
- ▼ -244.76%
- Current HPI
- 214.6157
- Rent YoY
- ▲ 5.17%
- Metro
- Kansas City, MO-KS
- State GDP YoY
- ▲ 1.84%
- F500 in state
- 20
Industry mix (Fortune 500 HQ in MO)
| Industry | F500 HQs | Revenue |
|---|---|---|
| Healthcare | 1 | $163B |
|
||
| Insurance | 1 | $21B |
|
||
| Industrial Technology | 1 | $17B |
|
||
| Retail | 1 | $16B |
|
||
| Industrial Distribution | 1 | $10B |
|
||
| Utilities | 1 | $9B |
|
||
Price history
-80.6% since first listed7 events — show timeline
- 2026-05-18 Pending — Heartland MLS as Distributed by MLS Grid
- 2026-03-12 Listed $165,000 Heartland MLS as Distributed by MLS Grid
- 2025-11-15 Listing Removed — Heartland MLS as Distributed by MLS Grid
- 2025-10-23 Listed $135,000 Heartland MLS as Distributed by MLS Grid
- 2021-05-06 Listing Removed — Heartland MLS as Distributed by MLS Grid
- 2021-03-04 Price Changed $85,000 Heartland MLS as Distributed by MLS Grid
- 2021-03-04 Listed $850,000 Heartland MLS as Distributed by MLS Grid
Property tax history
+5.3%/yrLatest (2025): $1,121 · +13.1% YoY. Source: county tax records.
Cash-flow waterfall
monthlySold comps — $/sqft
last 12 mo · ≤1 miLoading sold comps…