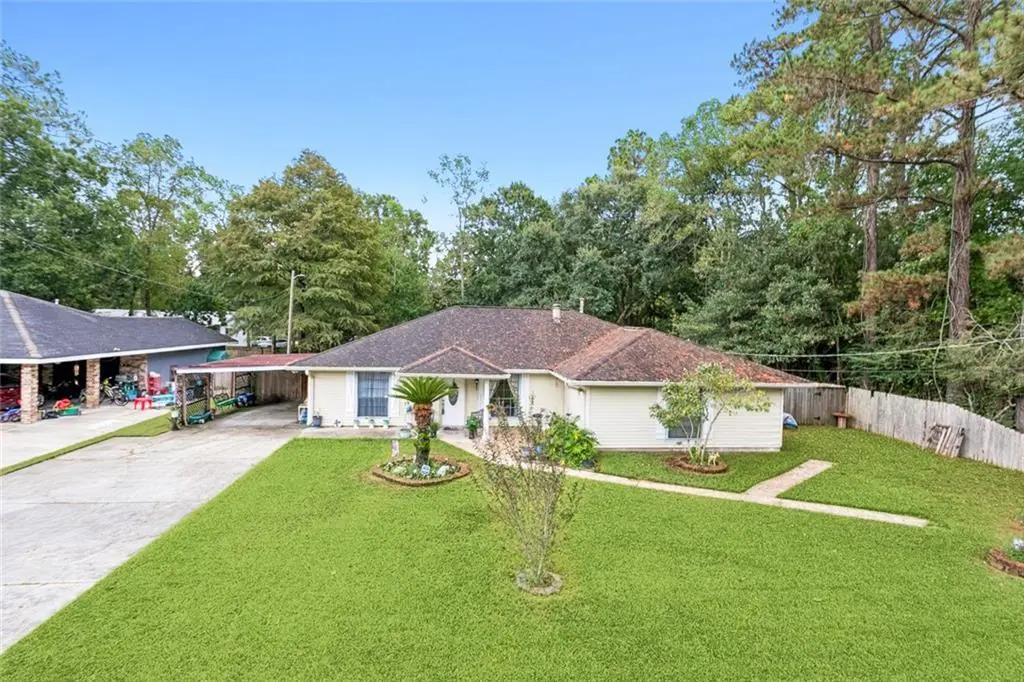
40764 Ranch Rd · Slidell, LA
Flood risk 7/10 · Major
- FEMA flood zone
- X
- Chance of flooding over 30 yrs
- 0.9%
- Est. flood insurance / yr
- $507 – $1,088
Fire risk 1/10 · Minimal
- Est. fire insurance / yr
- $1,269 – $2,357
Heat risk 10/10 · Severe
- Hot days now (above 107°F)
- 7 days/yr
- Hot days in 30 yrs
- 21 days/yr
Wind risk 9/10 · Severe
- Chance of severe wind over 30 yrs
- 99.0%
Air-quality risk 2/10 · Minimal
- Unhealthy air days now
- 1 days/yr
- Unhealthy air days in 30 yrs
- 2 days/yr
Risk factors via First Street. Map © Google.
Why this score? — see what drove the B- grade
The composite is a weighted blend of 9 inputs, each scored 0–100. Each bar is that input's sub-score; the figure is the points it added to the 100-point composite (weight × sub-score).
- Cash flow +26.1/30.0
- ARV discount +14.8/15.0
- DSCR +8.8/10.0
- 1% rule +5.7/10.0
- Schools +4.3/10.0
- Livability +3.5/5.0
- Rent growth +2.9/5.0
- Condition / age +2.5/5.0
- Appreciation +0.0/10.0
$245,000
🖨 Deal sheet 📄 Offer letter ✓ Due diligence
Listing remarks
Flood Zone C – flood insurance not mandated. Welcome to this inviting 4-bedroom, 2.5-bath home. Property located in Slidell with easy access to everyday shopping and dining options, and within the Northshore High School district. This spacious layout includes a functional kitchen with ample cabinetry and counter space. Additional features include large bedrooms, a laundry room, and a flexible bonus room suitable for an office, hobby area, or other uses. A single-car garage with half bath provides added convenience. Outside, enjoy a driveway, carport, covered patio, fenced yard, and separate deck space for relaxation or gatherings. Side cleared area may work for extra parking needs (RV
Key facts
- Functional kitchen
- Separate deck space
- Single car garage
Tags
Neighborhood map
What this means for you Summary
Snapshot
- This is a 4-bed/2.5-bath single-family listed at $245k.
Deal economics
- At list price, monthly cash flow is $551 ($7k/yr) — positive.
- The deal already cash-flows at list — no discount required.
- Meets the 1% rule at list price ($3k rent vs $245k).
- Recommended offer: $216k (12.0% below list) — sets the bar for market timing.
- Cap rate 9.3% vs local median 5.9% in Slidell — top-decile yield for the area; either an underpriced asset or a hidden risk that comps aren't pricing in. Stress-test before assuming the spread holds.
Location & tenants
- Location reads 70/100 on livability (#57 in LA) — a middle-class / working-renter tenant base. Strengths: cost of living A+, housing A+, health & safety A+; Watch: amenities F, commute F.
- St. Tammany Parish (suburban): math 43% / reading 55% proficiency, ranked #11 of 98 in LA (top 11%) — families likely to look elsewhere, expect single-tenant / working-renter base with shorter leases.
- Market conditions: Rents rising (+1.7%/yr); 589 active listings in the ZIP; 10 comparable units currently listed for rent nearby; rentals at typical pace (median 24d on market — plan ~3-4 weeks tenant-placement turnaround); 40% of comp listings sitting > 30 days — soft ceiling on asking rent; solid renter incomes; 1,064 units permitted in St. Tammany Parish in 2024 (0 in 5+ unit buildings).
- This rent runs 35% of the median local income ($89k/yr) — at the standard rent-burdened threshold; future hikes will face affordability resistance.
Forward outlook
- Local home prices are declining (-3.0%/yr); year-one equity from $2k of loan paydown is wiped out by about $7k of value loss. Plan a longer hold.
- St. Tammany County population projected at +27% by 2050 — long-run rental-demand tailwind backs the buy-and-hold thesis.
Negotiation context
- It's been on market 166 days — a 12% lower offer ($216k) is reasonable based on typical stale-listing flexibility.
- 8 sale attempts since 26y ago with the ask held roughly flat each time — persistent listings suggest the price (not the market) is what's stuck; bring a comps-based counter.
- Current owner paid $130k; list at $245k implies a 88% gain — meaningful room to come down on a strong offer.
Risks & watch-outs
- Watch-outs: flood insurance adds $66/mo.
- Climate carrying-cost: major flood risk; severe wind risk, 99% chance of damaging wind over 30y; extreme-heat days projected 7→21/yr by 2055 (HVAC capex compounding) — expect insurance premiums to compound above CPI over the hold.
Questions for the listing agent
- It's been on market 166 days. Have you received any prior offers? Is the seller open to a 12% concession, seller financing, or rate buy-down credit?
- What's the actual annual flood-insurance premium (NFIP or private), and is the property in a SFHA with mandatory coverage?
- Why hasn't it sold? Are there any deal-killer items the seller is aware of (foundation, flood, title, zoning, code violations)?
- Is there a deadline driving the sale (1031 exchange, divorce, estate, relocation)? That informs how much negotiation room exists.
- Schools are B-rated — typically a magnet for longer-tenancy family renters. What's the average tenant stay here, and is there a school-zone premium baked into asking?
- What's the average days-on-market for RENTAL listings here right now (not sales)? A rising rental-DOM trend means longer vacancies and softer asking-rent achievability than the comps imply.
- What's the recent tenant-quality profile in this submarket — average credit score on applications, eviction rate, late-payment / NSF rate, and stable-employment percentage? A property-management company in the area should have these aggregated.
- How much new for-sale + rental construction is in the pipeline within 1–3 miles? Heavy new supply typically softens prices + rents 12–24 months out; constrained supply supports both.
Investment metrics
- 1% rule
- 1.07% ✓
- Cap rate
- 9.32%
- Cash-on-cash
- 10.80%
- DSCR
- 1.48
- GRM
- 7.8
CMA / ARV
- ARV (median comp)
- $292,243
- List price
- $245,000
- Delta
- -16.17%
- Verdict
- UNDERPRICED
- Comps
- 20 within 1.0 mi
Show comp detail 12 sales within ~0.75 mi
| Address | Dist | Beds/Ba | Sqft | Sold | Price | $/sf | Match |
|---|---|---|---|---|---|---|---|
| 245 Cross Gates Blvd | 0.32mi | 3/2.5 (-1) | 2,284 (-3%) | 1mo | $345,000 | $151 | 74 |
| 102 Circlewood Ct | 0.47mi | 4/2.5 | 2,411 (+3%) | 1mo | $265,000 | $110 | 73 |
| 153 Silverwood Dr | 0.39mi | 4/2.5 | 2,411 (+3%) | 6mo | $333,000 | $138 | 72 |
| 206 Goldenwood Dr | 0.08mi | 4/2.0 | 2,050 (-13%) | 7mo | $200,990 | $98 | 67 |
| 105 Honeywood Dr | 0.54mi | 3/2.5 (-1) | 2,275 (-3%) | 0mo | $270,000 | $119 | 64 |
| 1205 Breckenridge Dr | 0.49mi | 4/2.5 | 2,560 (+9%) | 5mo | $210,000 | $82 | 58 |
| 511 Cross Gates Blvd | 0.72mi | 4/2.0 | 2,281 (-3%) | 4mo | $325,000 | $142 | 56 |
| 1112 Rebecca Reid Dr | 0.74mi | 4/2.5 | 2,411 (+3%) | 9mo | $320,000 | $133 | 54 |
| 995 Maple Creek Dr | 0.69mi | 4/2.0 | 2,196 (-7%) | 4mo | $280,000 | $128 | 51 |
| 632 Whitney Dr | 0.72mi | 4/2.5 | 2,183 (-7%) | 5mo | $384,000 | $176 | 50 |
| 651 Whitney Dr | 0.68mi | 4/2.0 | 2,194 (-7%) | 7mo | $314,500 | $143 | 49 |
| 1125 Lori Dr | 0.53mi | 4/2.5 | 2,665 (+13%) | 6mo | $312,000 | $117 | 48 |
Match score weights: distance 35% · size 25% · config 20% · recency 20%. Top-matched comps best support the ARV.
Projected returns pro-forma
-3.0% appreciation · 1.72% rent growth · sell at horizon
- IRR
- -3.1%
- Equity multiple
- 0.88×
- Total profit
- $-8,011
- Equity at exit
- $36,530
- IRR
- 5.1%
- Equity multiple
- 1.36×
- Total profit
- $24,599
- Equity at exit
- $21,183
Cash invested: $68,600 (down + closing). Projections, not guarantees.
Landlord ↔ Tenant lean methodology
- Overall (STATE)
- 90 Strongly Landlord-Friendly
- State Louisiana
- 90 Strongly Landlord-Friendly · R+12
- County
- — inherits STATE
- City
- — inherits STATE
ZIP-level market 70461
- Home prices YoY
- -33.0%
- Rents YoY
- 1.7%
- Active inventory
- 589
- Price-to-rent
- 7.8×
Monthly cashflow live
- Estimated rent
- $2,625 high interval (Pro) →
- Mortgage (P&I)
- −$1,285
- Tax from tax record
- −$69 /mo · $829/yr
- Insurance
- −$102
- Flood insurance flood zone
- −$66 /mo · $798/yr
- HOA
- −$0
- Vacancy / Maint / Mgmt
- −$551
- Net cashflow
- $551
Break-even live
UW: 25.0% down · 7.5% · 30yr · 1.5% tax · 5.0% vac · 8.0% maint · 8.0% mgmt
Financing live
Cash to close
- Down payment
- $61,250
- Closing costs
- $7,350
- Reserves months
- —
- Total cash needed
- —
Loan-product check · same deal, 3 products live
Conventional
25% down · 7.5% · 30yr
- Down + closing
- —
- Monthly P&I
- —
- Monthly cashflow
- —
- DSCR
- —
- Eligible?
- —
Personal DTI + credit; lowest rate.
DSCR
20% down · 8.5% · 30yr
- Down + closing
- —
- Monthly P&I
- —
- Monthly cashflow
- —
- DSCR
- —
- Eligible?
- —
No personal income docs; deal must DSCR.
Hard money
10% down · 12.0% · 12mo
- Down + closing
- —
- Monthly P&I
- —
- Monthly cashflow
- —
- DSCR
- —
- Eligible?
- —
Short-term bridge; refi at stabilization.
Rent comps 10 comps
| Address | Beds | Baths | Sqft | Rent | $/sqft | DOM | Units | Dist |
|---|---|---|---|---|---|---|---|---|
| 507 Cross Gates Blvd Slidell, LA | 3.0 | 2.0 | 2045 | $2,150 | $1.05 | 23d | 1 | 0.71mi |
| 1305 Spring Ridge Cir Slidell, LA | 4.0 | 3.0 | 2950 | $3,350 | $1.14 | 11d | 1 | 0.99mi |
| 403 Sandpiper Ct Slidell, LA | 4.0 | 2.0 | 2060 | $2,650 | $1.29 | 3d | 1 | 1.00mi |
| 555 Cross Gates Blvd Slidell, LA | 4.0 | 2.5 | 2300 | $2,425 | $1.05 | 43d | 1 | 1.04mi |
| 361 Autumn Lakes Rd Slidell, LA | 4.0 | 2.5 | 2250 | $3,000 | $1.33 | 11d | 1 | 1.16mi |
| 361 Autumn Lakes Rd Slidell, LA | 4.0 | 2.5 | 2250 | $3,500 | $1.56 | 43d | 1 | 1.16mi |
| 401 Starling Dr Slidell, LA | 4.0 | 2.5 | 2816 | $2,800 | $0.99 | 20d | 1 | 1.22mi |
| 3517 Meadow Lake Dr W Slidell, LA | 3.0 | 2.0 | 1931 | $2,200 | $1.14 | 43d | 1 | 1.25mi |
| 812 N Lake Verret Ct Slidell, LA | 3.0 | 2.0 | 1862 | $2,500 | $1.34 | 23d | 1 | 1.44mi |
| 221 Lake Tahoe Dr Slidell, LA | 3.0 | 2.0 | 1671 | $1,850 | $1.11 | 43d | 1 | 1.46mi |
Listing history 30 events
-
2026-06-18days on market $245,000 Active 166 DOM
-
2026-06-17days on market $245,000 Active 165 DOM
-
2026-06-16days on market $245,000 Active 164 DOM
-
2026-06-15days on market $245,000 Active 163 DOM
-
2026-06-13days on market $245,000 Active 161 DOM
-
2026-06-10days on market $245,000 Active 158 DOM
-
2026-06-09days on market $245,000 Active 157 DOM
-
2026-06-08days on market $245,000 Active 156 DOM
-
2026-06-07days on market $245,000 Active 155 DOM
-
2026-06-03days on market $245,000 Active 151 DOM
-
2026-06-02days on market $245,000 Active 150 DOM
-
2026-06-01days on market $245,000 Active 149 DOM
-
2026-05-31days on market $245,000 Active 148 DOM
-
2026-01-03price $245,000
-
2026-01-03price $245,000
-
2026-01-03$245,000 Active
-
2026-01-03$245,000 Active
-
2025-08-10price $255,000
-
2025-08-10price $255,000
-
2025-07-25$260,000 Active
-
2025-07-25$255,000 Active
-
2019-09-09soldstatus $130,000
-
2019-09-06soldstatus $130,000 Closed
-
2019-07-22status Pending
-
2019-06-24price $135,000
-
2019-04-02$135,000
-
2019-04-02$150,000 Active
-
2000-08-04soldstatus $83,000
-
2000-06-02$99,764
-
2000-06-02$99,764
ⓘ Source: listings_history table (triggers on properties + properties_extension) + one-shot
backfill from property_details.listing_events for pre-trigger history.
Tax reassessment forecast LA · Resets to sale price
- Current annual tax
- $829 · $69/mo
- Projected year-2 tax
- $1,348 · $112/mo
- Expected delta
- +$519/yr (+$43/mo · 62.6%)
ⓘ Screening estimate from a state-policy table — verify with the county assessor before closing.
Climate risk First Street
- Flood 7/10 Severe FEMA zone X · 90% chance over 30 yrs
- Wildfire 1/10 Low
- Heat 10/10 Extreme 7 d/yr ≥107°F today · 21 d/yr by 30 yrs out
- Wind 9/10 Extreme 99% chance of damaging wind over 30 yrs
- Air quality 2/10 Low 1 unhealthy d/yr today · 2 by 30 yrs out
Nearby sold comps map
Loading sold comps map…
Walkable amenities ~0.75 mi
Loading nearby amenities…
Taxation est. · year 1
- Rental income
- $31,495
- − Mortgage interest
- −$13,724
- − Property taxes
- −$829
- − Insurance
- −$2,022
- − Repairs & maintenance
- −$2,520
- − Management
- −$2,520
- − Depreciation
- −$7,127
- Taxable income
- $2,753
- Est. tax owed @ 24.0%
- −$661
- After-tax cash flow
- $5,951/yr
For passive investors: Depreciation is non-cash, so a rental often shows a tax loss while cash-flowing — sheltering income. Rental losses are passive: they offset passive income freely, and up to $25,000/yr can offset ordinary (W-2) income if you actively participate and your MAGI is under $100k (phasing out to $0 by $150k); unused losses carry forward. On sale, claimed depreciation is recaptured at up to 25%, and gains may owe capital-gains tax (a 1031 exchange can defer both). Figures are a year-1 estimate at your 24.0% rate — not tax advice; consult a CPA.
Schools (NCES district)
- District
- St. Tammany Parish
- NCES district ID
- 2201650
- Math proficiency
- 43% ▼ -32.00%
- Reading proficiency
- 55% ▼ -26.00%
- Median HH income
- $61,752
- Composite
- 43.04/100
- National rank
- #3098
- State rank
- #11 of 98 in LA
Livability — Slidell
- Score
- 70/100
- State rank
- #57
- US rank
- #7673
Category grades
Schools grade is shown separately in the Schools card above.
Census & demographics
- County
- Saint Tammany Parish · 228,296 people
- City population
- 95,511
- Metro
- New Orleans-Metairie, LA
- Population (ZIP)
- 34,808
- Household income
- $89,003
- Rent vs Own
- Severe rent burden
- 328.0
Population outlook (St. Tammany County) Hauer SSP2
- Today (2025)
- 286,725 people
- By 2030
- 304,175 · +6.1%
- By 2040
- 336,203 · +17.3%
- By 2050
- 364,590 · +27.2%
- By 2075
- 433,362 · +51.1%
- By 2100
- 470,333 · +64.0%
Race, ethnicity, and origin ACS 2023
- Neighborhood character
- Diverse neighborhood (Simpson 0.63)
- Race & ethnicity
- White 55% Black 24% Two or more races 14% Hispanic / Latino 11% Asian 3%
- Hispanic origin (detail)
- Common ancestry
- Lithuanian 9% Italian 1% Romanian 1%
- Foreign-born
- 8% · Canada, China, Vietnam
- Languages at home
- 89% English-only · Spanish 7% Chinese 1% Vietnamese 1%
Political lean MEDSL · St. Tammany
- 2024 margin
- Solid R (+43.8) · D 27.3% · R 71.1% · Other 1.6%
- 2008→2024 swing
- +9.6pp toward D · 2008: -53.4pp · 2024: -43.8pp
- All cycles
- 2024: R+43.8 2020: R+44.2 2016: R+50.8 2012: R+52.2 2008: R+53.4
Not yet ingested
- Civics
- —
Market trends
- HPI YoY
- ▼ -74.47%
- Current HPI
- 151.3353
- Rent YoY
- ▲ 1.72%
- Metro
- New Orleans-Metairie, LA
- State GDP YoY
- ▲ 3.29%
- F500 in state
- 10
Industry mix (Fortune 500 HQ in LA)
| Industry | F500 HQs | Revenue |
|---|---|---|
| Telecommunications | 2 | $23B |
|
||
| Utilities | 1 | $12B |
|
||
| Wholesale / Distribution | 1 | $5B |
|
||
| Advertising | 1 | $2B |
|
||
Price history
+145.6% since first listed17 events — show timeline
- 2026-01-03 Price Changed $245,000 AcadianaMLS
- 2026-01-03 Price Changed $245,000 GSREIN
- 2026-01-03 Listed $245,000 AcadianaMLS
- 2026-01-03 Listed $245,000 GSREIN
- 2025-08-10 Price Changed $255,000 AcadianaMLS
- 2025-08-10 Price Changed $255,000 GSREIN
- 2025-07-25 Listed $255,000 AcadianaMLS
- 2025-07-25 Listed $260,000 AcadianaMLS
- 2019-09-09 Sold (Public Records) $130,000 Public Records
- 2019-09-06 Sold (MLS) $130,000 GSREIN
- 2019-07-22 Pending — GSREIN
- 2019-06-24 Price Changed $135,000 GSREIN
- 2019-04-02 Listed $150,000 GSREIN
- 2019-04-02 Listed $135,000 AcadianaMLS
- 2000-08-04 Sold (MLS) $83,000 GSREIN
- 2000-06-02 Listed $99,764 AcadianaMLS
- 2000-06-02 Listed $99,764 GSREIN
Property tax history
-7.9%/yrLatest (2025): $829 · -3.8% YoY. Source: county tax records.
Cash-flow waterfall
monthlySold comps — $/sqft
last 12 mo · ≤1 miLoading sold comps…