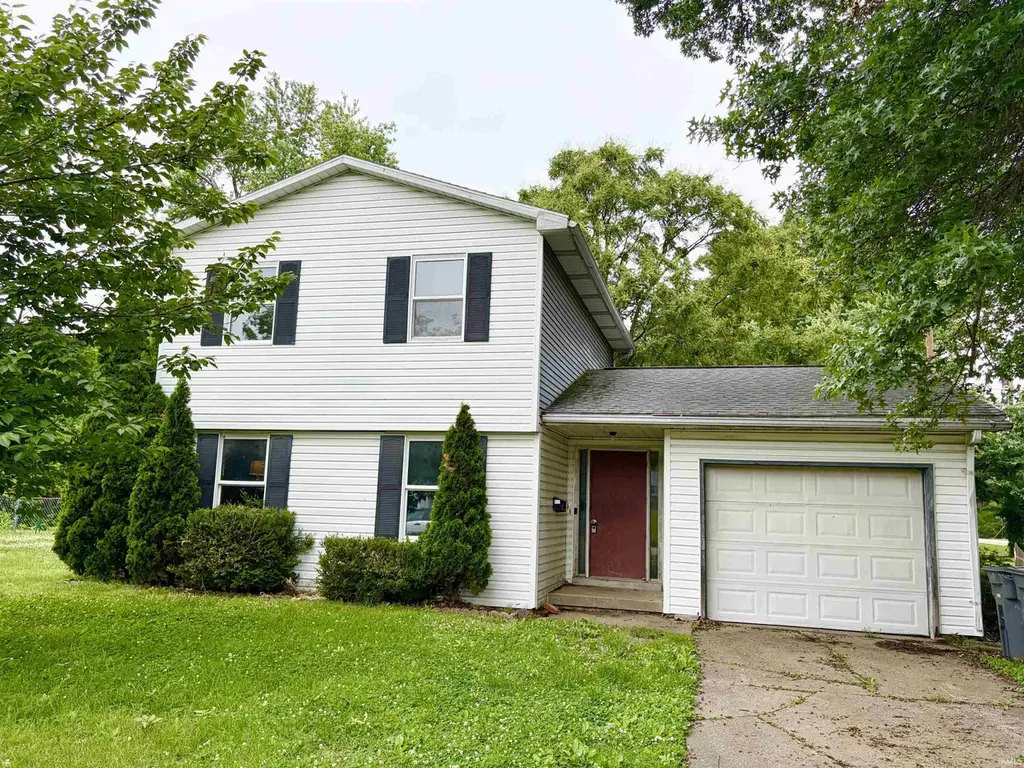
1924 Coker Ave · Evansville, IN
Flood risk 1/10 · Minimal
- FEMA flood zone
- X (shaded)
- Chance of flooding over 30 yrs
- 0.0%
- Est. flood insurance / yr
- $507 – $1,088
Fire risk 3/10 · Minor
- Est. fire insurance / yr
- $717 – $1,331
Heat risk 5/10 · Moderate
- Hot days now (above 107°F)
- 7 days/yr
- Hot days in 30 yrs
- 19 days/yr
Wind risk 2/10 · Minimal
- Chance of severe wind over 30 yrs
- 4.0%
Air-quality risk 3/10 · Minor
- Unhealthy air days now
- 3 days/yr
- Unhealthy air days in 30 yrs
- 4 days/yr
Risk factors via First Street. Map © Google.
Why this score? — see what drove the B+ grade
The composite is a weighted blend of 9 inputs, each scored 0–100. Each bar is that input's sub-score; the figure is the points it added to the 100-point composite (weight × sub-score).
- Cash flow +29.3/30.0
- ARV discount +15.0/15.0
- DSCR +10.0/10.0
- 1% rule +8.6/10.0
- Rent growth +4.5/5.0
- Schools +3.3/10.0
- Livability +3.2/5.0
- Condition / age +2.5/5.0
- Appreciation +0.0/10.0
$85,000
🖨 Deal sheet 📄 Offer letter ✓ Due diligence
Listing remarks
Fixer upper special!!! Take a look at this large corner lot that has 3 BDR, 1.5 baths. Roof is watertight and yes, the walls need repair, and the floor needs replaced, but it could be a great home! Primary bedroom has a 6x6 walk in closet and the other 2 BDR have double door closets. The family room is large, sized at 19.4 x 11.3. If you turn the corner, there is a half bath on the main level and then the kitchen. Kitchen cabinets are in great shape and there is a dining area off of the galley kitchen big enough to set a large table and chairs. Single car garage provides convenience. It has a fenced in backyard. Fix up this house and make it look like the rest on the block! Make your appoin
Key facts
- Fenced in backyard
- Walk in closet
- Corner lot
Tags
Property features AI
Finance
- Other: Annual tax amount listed (amount available in listing)
Exterior
- Parking: Attached garage (1 car) with concrete parking
- Utilities: Public water; Public sewer
- Home design: Residential single-family site-built home; 2 stories
- Construction: Aluminum and vinyl siding; Block foundation; Shingle roof; Built area above grade: 1,140 (value provided)
- Exterior features: Chain link fencing; Corner lot; Approximately 105 ft frontage
Interior
- Kitchen: Dishwasher; Microwave; Refrigerator
- Bedrooms: Bedrooms not specified
- Flooring: Carpet; Laminate
- Bathrooms: 1 full bathroom; 1 half bathroom; Main level bathroom present
- Heating & cooling: Central air conditioning; Forced air heating
- Interior features: Dishwasher, Microwave, Refrigerator; One fireplace; Crawl space basement; Total of 9 rooms
- Laundry & utility: Electric dryer hookup on the main level
Neighborhood map
What this means for you Summary
Snapshot
- This is a 3-bed/1.5-bath single-family listed at $85k.
Deal economics
- At list price, monthly cash flow is $300 ($4k/yr) — positive.
- The deal already cash-flows at list — no discount required.
- Meets the 1% rule at list price ($1k rent vs $85k).
- Cap rate 10.5% vs local median 4.6% in Evansville — top-decile yield for the area; either an underpriced asset or a hidden risk that comps aren't pricing in. Stress-test before assuming the spread holds.
Location & tenants
- Location reads 63/100 on livability (#416 in IN) — a middle-class / working-renter tenant base. Strengths: cost of living A+, housing A+, health & safety A+; Watch: crime F, commute F, employment D-.
- Evansville Vanderburgh School Corporation (urban): math 36% / reading 43% proficiency, ranked #153 of 301 in IN (top 51%) — families likely to look elsewhere, expect single-tenant / working-renter base with shorter leases.
- Zoned schools: Caze Elementary School (math 17% / reading 17%, grade F, #837 of 994 statewide, top 86%, 393 students, 79% FRL); Mcgary Middle School (math 8% / reading 15%, grade F, #311 of 330 statewide, top 94%, 351 students, 81% FRL); William Henry Harrison High School (math 29% / reading 54%, grade F, #211 of 369 statewide, top 58%, 1,158 students, 61% FRL) — zoned schools average 73% FRL vs 50% district-wide (23 pts higher); higher-poverty schools than district average — tighter screening recommended.
- Zoned-school proficiency averages 23% at this address vs 40% district-wide (-16 pts) — the specific schools serving this property underperform the Evansville Vanderburgh School Corporation average; the district grade overstates school quality for this exact location.
- Market conditions: Rents rising fast (+7.9%/yr); 188 active listings in the ZIP; 14 comparable units currently listed for rent nearby; rentals at typical pace (median 21d on market — plan ~3-4 weeks tenant-placement turnaround); 508 units permitted in Vanderburgh County in 2024 (32 in 5+ unit buildings).
Forward outlook
- Local home prices are declining (-3.0%/yr); year-one equity from $588 of loan paydown is wiped out by about $3k of value loss. Plan a longer hold.
- At projected returns (-3.0% appreciation + 7.9% rent growth), your $24k cash investment doubles in ~6 years — after that, you're playing with house money.
Negotiation context
- Only 5 days on market — expect competitive offers; lowballing is unlikely to land.
Risks & watch-outs
- Climate carrying-cost: extreme-heat days projected 7→19/yr by 2055 (HVAC capex compounding) — expect insurance premiums to compound above CPI over the hold.
Questions for the listing agent
- Built in 1976 — when were the roof, HVAC, electrical panel, plumbing, and water heater last replaced?
- Is there a deadline driving the sale (1031 exchange, divorce, estate, relocation)? That informs how much negotiation room exists.
- Schools are D-rated, which usually means shorter tenancies and higher turnover. Who's the typical renter profile here, and what's been the actual vacancy rate?
- Crime grade is F in this area — have there been break-ins, vandalism, or insurance claims at this property in the last 3 years? What carrier currently insures it and at what premium?
- What's the average days-on-market for RENTAL listings here right now (not sales)? A rising rental-DOM trend means longer vacancies and softer asking-rent achievability than the comps imply.
- What's the recent tenant-quality profile in this submarket — average credit score on applications, eviction rate, late-payment / NSF rate, and stable-employment percentage? A property-management company in the area should have these aggregated.
- How much new for-sale + rental construction is in the pipeline within 1–3 miles? Heavy new supply typically softens prices + rents 12–24 months out; constrained supply supports both.
Investment metrics
- 1% rule
- 1.36% ✓
- Cap rate
- 10.53%
- Cash-on-cash
- 15.12%
- DSCR
- 1.67
- GRM
- 6.1
CMA / ARV
- ARV (on-the-fly)
- $144,780
- Comps found
- 12
Show comp detail 12 sales within ~0.75 mi
| Address | Dist | Beds/Ba | Sqft | Sold | Price | $/sf | Match |
|---|---|---|---|---|---|---|---|
| 1924 Coker Ave | 0.00mi | 3/1.5 | 1,140 (0%) | 0mo | $86,000 | $75 | 100 |
| 2605 S Weinbach Ave | 0.09mi | 3/2.0 | 1,064 (-7%) | 3mo | $135,000 | $127 | 80 |
| 2013 Margybeth Ave | 0.35mi | 3/1.0 | 1,116 (-2%) | 1mo | $160,000 | $143 | 77 |
| 2013 Frisse Ave | 0.23mi | 3/2.0 | 1,074 (-6%) | 2mo | $139,500 | $130 | 75 |
| 2028 Culverson Ave | 0.11mi | 2/1.0 (-1) | 1,219 (+7%) | 1mo | $170,000 | $139 | 75 |
| 1732 Culverson Ave | 0.14mi | 3/1.0 | 1,025 (-10%) | 5mo | $150,000 | $146 | 70 |
| 3121 S Weinbach Ave | 0.26mi | 2/1.5 (-1) | 1,030 (-10%) | 1mo | $64,000 | $62 | 66 |
| 2300 Margybeth Ave | 0.55mi | 3/2.0 | 1,104 (-3%) | 2mo | $103,000 | $93 | 66 |
| 2468 Culverson Ave | 0.64mi | 3/2.0 | 1,189 (+4%) | 1mo | $100,000 | $84 | 60 |
| 2013 S Spring St | 0.47mi | 4/2.0 (+1) | 1,262 (+11%) | 0mo | $67,500 | $53 | 53 |
| 2222 Frisse Ave | 0.42mi | 3/1.0 | 972 (-15%) | 2mo | $119,900 | $123 | 52 |
| 2141 Sweetser Ave | 0.68mi | 2/1.0 (-1) | 990 (-13%) | 1mo | $150,000 | $152 | 38 |
Match score weights: distance 35% · size 25% · config 20% · recency 20%. Top-matched comps best support the ARV.
Projected returns pro-forma
-3.0% appreciation · 7.86% rent growth · sell at horizon
- IRR
- 11.3%
- Equity multiple
- 1.47×
- Total profit
- $11,292
- Equity at exit
- $12,674
- IRR
- 24.0%
- Equity multiple
- 3.58×
- Total profit
- $61,465
- Equity at exit
- $7,349
Cash invested: $23,800 (down + closing). Projections, not guarantees.
Landlord ↔ Tenant lean methodology
- Overall (STATE)
- 90 Strongly Landlord-Friendly
- State Indiana
- 90 Strongly Landlord-Friendly · R+11
- County
- — inherits STATE
- City
- — inherits STATE
ZIP-level market 47714
- Rents YoY
- 7.9%
- Active inventory
- 188
- Price-to-rent
- 6.1×
Monthly cashflow live
- Estimated rent
- $1,155 high interval (Pro) →
- Mortgage (P&I)
- −$446
- Tax from tax record
- −$132 /mo · $1,580/yr
- Insurance
- −$35
- HOA
- −$0
- Vacancy / Maint / Mgmt
- −$243
- Net cashflow
- $300
Break-even live
UW: 25.0% down · 7.5% · 30yr · 1.5% tax · 5.0% vac · 8.0% maint · 8.0% mgmt
Financing live
Cash to close
- Down payment
- $21,250
- Closing costs
- $2,550
- Reserves months
- —
- Total cash needed
- —
Loan-product check · same deal, 3 products live
Conventional
25% down · 7.5% · 30yr
- Down + closing
- —
- Monthly P&I
- —
- Monthly cashflow
- —
- DSCR
- —
- Eligible?
- —
Personal DTI + credit; lowest rate.
DSCR
20% down · 8.5% · 30yr
- Down + closing
- —
- Monthly P&I
- —
- Monthly cashflow
- —
- DSCR
- —
- Eligible?
- —
No personal income docs; deal must DSCR.
Hard money
10% down · 12.0% · 12mo
- Down + closing
- —
- Monthly P&I
- —
- Monthly cashflow
- —
- DSCR
- —
- Eligible?
- —
Short-term bridge; refi at stabilization.
Rent comps 14 comps
| Address | Beds | Baths | Sqft | Rent | $/sqft | DOM | Units | Dist |
|---|---|---|---|---|---|---|---|---|
| 2340 Sunburst Blvd Unit 2270-318 Evansville, IN | 2.0 | 1.0 | 815 | $900 | $1.10 | 21d | 1 | 0.34mi |
| 2340 Sunburst Blvd Unit 2200-202 Evansville, IN | 3.0 | 1.0 | 973 | $1,050 | $1.08 | 21d | 1 | 0.34mi |
| 1604 Marbo Ave Evansville, IN | 2.0 | 1.0 | 900 | $1,095 | $1.22 | 21d | 1 | 0.36mi |
| 2232 E Riverside Dr Evansville, IN | 2.0 | 1.0 | 810 | $1,200 | $1.48 | 13d | 1 | 0.39mi |
| 1952 Colts Ln Evansville, IN | 1.0–3.0 | 1.0 | 1146 | $1,275 | $1.11 | 21d | 8 | 0.48mi |
| 1909 Plantation Ct Evansville, IN | 2.0 | 1.0 | 780 | $700 | $0.90 | 21d | 2 | 0.52mi |
| 2001 S Taft Ave Evansville, IN | 3.0 | 2.0 | 1472 | $1,000 | $0.68 | 21d | 1 | 0.67mi |
| 1762 Spring Ct Evansville, IN | 2.0 | 1.0 | 975 | $1,450 | $1.49 | 21d | 1 | 0.68mi |
| 2818 S Villa Dr Evansville, IN | 3.0 | 1.0 | 1061 | $1,295 | $1.22 | 21d | 1 | 0.78mi |
| 1909 Taylor Ave Evansville, IN | 2.0 | 1.0 | 700 | $1,200 | $1.71 | 13d | 1 | 1.07mi |
| 1713 Hawthorne Ave Evansville, IN | 3.0 | 2.0 | 1204 | $1,395 | $1.16 | 21d | 1 | 1.11mi |
| 1505 Jackson Ave Evansville, IN | 2.0 | 1.0 | 780 | $995 | $1.28 | 21d | 1 | 1.16mi |
| 1500 S Harlan Ave Evansville, IN | 2.0 | 1.0 | 712 | $900 | $1.26 | 13d | 1 | 1.23mi |
| 2947 Ravenswood Dr Unit 2927 Evansville, IN | 2.0 | 1.0 | 1150 | $975 | $0.85 | 21d | 1 | 1.32mi |
Listing history 1 events
-
2026-05-21$85,000 Active
ⓘ Source: listings_history table (triggers on properties + properties_extension) + one-shot
backfill from property_details.listing_events for pre-trigger history.
Tax reassessment forecast IN · Partial reset (capped growth)
- Current annual tax
- $1,580 · $132/mo
- Projected year-2 tax
- $1,580 · $132/mo
- Expected delta
- $0/yr ($0/mo · 0.0%)
ⓘ Screening estimate from a state-policy table — verify with the county assessor before closing.
Climate risk First Street
- Flood 1/10 Low FEMA zone X (shaded) · 0% chance over 30 yrs
- Wildfire 3/10 Moderate
- Heat 5/10 Major 7 d/yr ≥107°F today · 19 d/yr by 30 yrs out
- Wind 2/10 Low 4% chance of damaging wind over 30 yrs
- Air quality 3/10 Moderate 3 unhealthy d/yr today · 4 by 30 yrs out
Nearby sold comps map
Loading sold comps map…
Walkable amenities ~0.75 mi
Loading nearby amenities…
Taxation est. · year 1
- Rental income
- $13,865
- − Mortgage interest
- −$4,761
- − Property taxes
- −$1,580
- − Insurance
- −$425
- − Repairs & maintenance
- −$1,109
- − Management
- −$1,109
- − Depreciation
- −$2,473
- Taxable income
- $2,408
- Est. tax owed @ 24.0%
- −$578
- After-tax cash flow
- $3,022/yr
For passive investors: Depreciation is non-cash, so a rental often shows a tax loss while cash-flowing — sheltering income. Rental losses are passive: they offset passive income freely, and up to $25,000/yr can offset ordinary (W-2) income if you actively participate and your MAGI is under $100k (phasing out to $0 by $150k); unused losses carry forward. On sale, claimed depreciation is recaptured at up to 25%, and gains may owe capital-gains tax (a 1031 exchange can defer both). Figures are a year-1 estimate at your 24.0% rate — not tax advice; consult a CPA.
Schools (NCES district)
- District
- Evansville Vanderburgh School Corporation
- NCES district ID
- 1803450
- Math proficiency
- 36% ▼ -7.00%
- Reading proficiency
- 43% ▼ -3.00%
- Median HH income
- $43,270
- Composite
- 33.41/100
- National rank
- #5471
- State rank
- #153 of 301 in IN
Livability — Evansville
- Score
- 63/100
- State rank
- #416
- US rank
- #15047
Category grades
Schools grade is shown separately in the Schools card above.
Census & demographics
- Census place
- Evansville, IN
- County
- Vanderburgh County · 146,793 people
- City population
- 146,793
- Metro
- Evansville, IN-KY
- Population (ZIP)
- 32,132
- Household income
- $55,910
- Rent vs Own
- Severe rent burden
- 1394.0
Population outlook (Vanderburgh County) Hauer SSP2
- Today (2025)
- 187,038 people
- By 2030
- 188,907 · +1.0%
- By 2040
- 190,272 · +1.7%
- By 2050
- 188,871 · +1.0%
- By 2075
- 180,751 · -3.4%
- By 2100
- 163,015 · -12.8%
Race, ethnicity, and origin ACS 2023
- Neighborhood character
- Predominantly White (71%)
- Race & ethnicity
- White 71% Black 17% Two or more races 6% Hispanic / Latino 6% Asian 1%
- Hispanic origin (detail)
- Mexican 3%
- Common ancestry
- Italian 3% Lithuanian 2% Slovak 1%
- Foreign-born
- 6% · Canada, China
- Languages at home
- 92% English-only · Spanish 4% Other Asian/Pacific 1% French/Haitian/Cajun 1%
Political lean MEDSL · Vanderburgh
- 2024 margin
- R (+12.7) · D 43.0% · R 55.6% · Other 1.4%
- 2008→2024 swing
- -15.1pp toward R · 2008: 2.5pp · 2024: -12.7pp
- All cycles
- 2024: R+12.7 2020: R+9.6 2016: R+16.9 2012: R+10.8 2008: D+2.5
Not yet ingested
- Civics
- —
Market trends
- HPI YoY
- ▼ -124.80%
- Current HPI
- 211.1755
- Rent YoY
- ▲ 7.86%
- Metro
- Evansville, IN-KY
- State GDP YoY
- ▲ 2.90%
- F500 in state
- 18
Industry mix (Fortune 500 HQ in IN)
| Industry | F500 HQs | Revenue |
|---|---|---|
| Industrial Machinery | 2 | $37B |
|
||
| Healthcare | 1 | $177B |
|
||
| Pharmaceuticals | 1 | $45B |
|
||
| Metals / Steel | 1 | $18B |
|
||
| Agriculture | 1 | $17B |
|
||
| Packaging | 1 | $12B |
|
||
Price history
1 event — show timeline
- 2026-05-21 Listed $85,000 IRMLS
Property tax history
+7.4%/yrLatest (2024): $1,580 · +1.5% YoY. Source: county tax records.
Cash-flow waterfall
monthlySold comps — $/sqft
last 12 mo · ≤1 miLoading sold comps…