5692 N Confederate Ln · Garden City, ID
Flood risk No data
- FEMA flood zone
- —
- Chance of flooding over 30 yrs
- —
- Est. flood insurance / yr
- —
Fire risk No data
- Est. fire insurance / yr
- —
Heat risk No data
- Hot days now (above threshold)
- —
- Hot days in 30 yrs
- —
Wind risk No data
- Chance of severe wind over 30 yrs
- —
Air-quality risk No data
- Unhealthy air days now
- —
- Unhealthy air days in 30 yrs
- —
Risk factors via First Street. Map © Google.
Why this score? — see what drove the C+ grade
The composite is a weighted blend of 9 inputs, each scored 0–100. Each bar is that input's sub-score; the figure is the points it added to the 100-point composite (weight × sub-score).
- Cash flow +28.8/30.0
- DSCR +10.0/10.0
- 1% rule +8.0/10.0
- Schools +4.2/10.0
- Livability +4.1/5.0
- Rent growth +3.7/5.0
- Condition / age +2.5/5.0
- ARV discount +0.3/15.0
- Appreciation +0.0/10.0
$169,000
🖨 Deal sheet (PDF) 📄 Offer letter ✓ Due diligence
Listing remarks
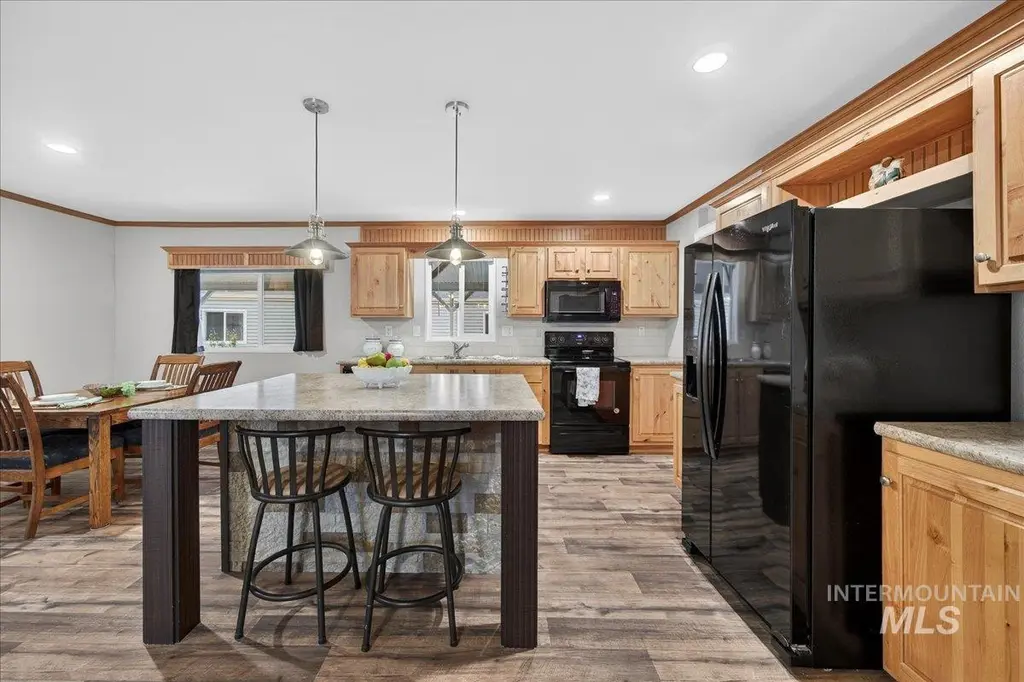
Step into effortless living in this beautifully maintained one-owner, 2019-built home located in Shenandoah Estates, an active 55+ community tucked along the Boise River. A spacious front patio with retractable cover creates the perfect spot to relax and enjoy the outdoors while inside, the open great room is warm and inviting, featuring beam accents, custom built-ins, and a recessed TV niche with integrated lighting. The open-concept kitchen sits at the heart of the home—ideal for everyday living or entertaining—complete with a central island, black appliances (refrigerator included), & a generous dining nook. The primary suite is a true retreat, offering dual vanities, a
Key facts
- Central island
- Front patio
- Open-concept kitchen
Tags
Property features AI
Finance
- Other: Rented lot (mobile/manufactured home subtype)
- HOA & community: Gated community; Community pool; Over-55 community
Exterior
- Parking: Carport with 2 covered spaces; RV access/parking; Finished driveway
- Security: Gated community
- Utilities: City water service; Sewer connected
- Home design: Mobile/manufactured home on a rented lot; Located in an over-55 community; Gated community; Built in 2019; Composition roof
- Construction: Built in 2019; Composition roof; Storage shed on property
- Exterior features: Partial metal fencing; Community pool; Private paved road frontage; Storage shed
Interior
- Kitchen: Dishwasher; Microwave; Freestanding oven/range; Refrigerator; Kitchen island; Pantry; Laminate countertops
- Bedrooms: 3 bedrooms all on the main level
- Flooring: Carpet; Laminate
- Bathrooms: 2 bathrooms
- Heating & cooling: Forced air heating (natural gas); Central air conditioning
- Interior features: Primary bedroom with private bath; Double vanity in bathroom; Great room; Walk-in closet(s); Pantry; Kitchen island; Laminate countertops
- Laundry & utility: Washer; Dryer; Utility room on the main level
Neighborhood map
What this means for you Summary
Snapshot
- This is a 3-bed/2.0-bath manufactured listed at $169k.
Deal economics
- At list price, monthly cash flow is $570 ($7k/yr) — positive.
- The deal already cash-flows at list — no discount required.
- Meets the 1% rule at list price ($2k rent vs $169k).
- Recommended offer: $164k (3.0% below list) — sets the bar for market timing.
- Cap rate 10.3% vs local median 2.5% in Garden City — top-decile yield for the area; either an underpriced asset or a hidden risk that comps aren't pricing in. Stress-test before assuming the spread holds.
Location & tenants
- Location reads 82/100 on livability (#11 in ID, #1,264 nationally) — a professional / high-income tenant draw. Strengths: commute A+, health & safety A+, housing A; Watch: crime F.
- Boise Independent District (urban): math 42% / reading 56% proficiency, ranked #36 of 92 in ID (top 39%) — families likely to look elsewhere, expect single-tenant / working-renter base with shorter leases.
- Zoned schools: Shadow Hills Elementary (math 33% / reading 46%, grade F, #234 of 357 statewide, top 69%, 445 students, 24% FRL); Riverglen Jr High School (math 33% / reading 56%, grade D, #52 of 109 statewide, top 51%, 540 students, 27% FRL); Capital Senior High School (math 34% / reading 57%, grade D-, #59 of 169 statewide, top 35%, 1,220 students, 28% FRL).
- Market conditions: Rents rising fast (+4.9%/yr); 448 active listings in the ZIP; 10 comparable units currently listed for rent nearby; rentals leasing fast (median 5d on market — plan ~1-2 weeks tenant-placement turnaround); solid renter incomes; 5,129 units permitted in Ada County in 2024 (414 in 5+ unit buildings).
- This rent runs 30% of the median local income ($88k/yr) — at the standard rent-burdened threshold; future hikes will face affordability resistance.
Forward outlook
- Local home prices are declining (-3.0%/yr); year-one equity from $1k of loan paydown is wiped out by about $5k of value loss. Plan a longer hold.
- Ada County population projected at +45% by 2050 — long-run rental-demand tailwind backs the buy-and-hold thesis.
- At projected returns (-3.0% appreciation + 4.9% rent growth), your $47k cash investment doubles in ~8 years — after that, you're playing with house money.
Negotiation context
- It's been on market 54 days — a 3% lower offer ($164k) is reasonable based on typical stale-listing flexibility.
- 4 sale attempts since 12y ago; this cycle's ask has dropped $20k (11%) from the opening price — seller is motivated, your offer sets the floor, not the list.
Questions for the listing agent
- It's been on market 54 days. Have you received any prior offers? Is the seller open to a 3% concession, seller financing, or rate buy-down credit?
- Is there a deadline driving the sale (1031 exchange, divorce, estate, relocation)? That informs how much negotiation room exists.
- Crime grade is F in this area — have there been break-ins, vandalism, or insurance claims at this property in the last 3 years? What carrier currently insures it and at what premium?
- What's the average days-on-market for RENTAL listings here right now (not sales)? A rising rental-DOM trend means longer vacancies and softer asking-rent achievability than the comps imply.
- What's the recent tenant-quality profile in this submarket — average credit score on applications, eviction rate, late-payment / NSF rate, and stable-employment percentage? A property-management company in the area should have these aggregated.
- How much new for-sale + rental construction is in the pipeline within 1–3 miles? Heavy new supply typically softens prices + rents 12–24 months out; constrained supply supports both.
Investment metrics
- 1% rule
- 1.30% ✓
- Cap rate
- 10.34%
- Cash-on-cash
- 14.46%
- DSCR
- 1.64
- GRM
- 6.4
CMA / ARV
- ARV (on-the-fly)
- $145,824
- Comps found
- 10
Show comp detail 10 sales within ~0.75 mi
| Address | Dist | Beds/Ba | Sqft | Sold | Price | $/sf | Match |
|---|---|---|---|---|---|---|---|
| 5580 N Confederate | 0.08mi | 2/2.0 (-1) | 1,584 (+1%) | 9mo | $181,000 | $114 | 82 |
| 8043 W Manassas Ln | 0.03mi | 3/2.0 | 1,512 (-4%) | 16mo | $219,900 | $145 | 80 |
| 8215 W Appomattox Ln | 0.12mi | 2/2.0 (-1) | 1,536 (-2%) | 9mo | $130,000 | $85 | 79 |
| 8001 N Roe | 0.42mi | 3/2.0 | 1,566 (-0%) | 3mo | $182,000 | $116 | 77 |
| 5609 Sudley Ln | 0.08mi | 3/2.0 | 1,440 (-8%) | 10mo | $135,000 | $94 | 75 |
| 5657 Sudley Ln | 0.05mi | 2/2.0 (-1) | 1,403 (-10%) | 7mo | $130,000 | $93 | 69 |
| 7098 W Royal Glen Ln | 0.55mi | 2/2.0 (-1) | 1,568 (0%) | 9mo | $129,000 | $82 | 62 |
| 8173 Appomattox Ln | 0.10mi | 2/2.0 (-1) | 1,344 (-14%) | 14mo | $97,500 | $73 | 54 |
| 5298 N North Glen Ln | 0.71mi | 3/2.0 | 1,416 (-10%) | 15mo | $95,000 | $67 | 38 |
| 6972 Royal Glen Ln | 0.61mi | 3/2.0 | 1,335 (-15%) | 13mo | $88,000 | $66 | 35 |
Match score weights: distance 35% · size 25% · config 20% · recency 20%. Top-matched comps best support the ARV.
Projected returns pro-forma
-3.0% appreciation · 4.87% rent growth · sell at horizon
- IRR
- 7.0%
- Equity multiple
- 1.28×
- Total profit
- $13,186
- Equity at exit
- $25,198
- IRR
- 17.9%
- Equity multiple
- 2.61×
- Total profit
- $76,366
- Equity at exit
- $14,612
Cash invested: $47,320 (down + closing). Projections, not guarantees.
Landlord ↔ Tenant lean methodology
- Overall (STATE)
- 91 Strongly Landlord-Friendly
- State Idaho
- 91 Strongly Landlord-Friendly · R+18
- County
- — inherits STATE
- City
- — inherits STATE
ZIP-level market 83714
- Home prices YoY
- -31.5%
- Rents YoY
- 4.9%
- Active inventory
- 448
- Price-to-rent
- 6.4×
Monthly cashflow live
- Estimated rent
- $2,200 high interval (Pro) →
- Mortgage (P&I)
- −$886
- Tax est. 1.5%
- −$211 /mo · $2,535/yr
- Insurance
- −$70
- HOA
- −$0
- Vacancy / Maint / Mgmt
- −$462
- Net cashflow
- $570
Break-even live
Sensitivity live
| Price | -10% $687 | -5% $629 | +0% $570 | +5% $512 | +10% $453 |
|---|---|---|---|---|---|
| Rent | -10% $396 | -5% $483 | +0% $570 | +5% $657 | +10% $744 |
| Rate | -1.0pp $655 | -0.5pp $613 | base $570 | +0.5pp $526 | +1.0pp $482 |
UW: 25.0% down · 7.5% · 30yr · 1.5% tax · 5.0% vac · 8.0% maint · 8.0% mgmt
Financing live
Cash to close
- Down payment
- $42,250
- Closing costs
- $5,070
- Reserves months
- —
- Total cash needed
- —
Loan-product check · same deal, 3 products live
Conventional
25% down · 7.5% · 30yr
- Down + closing
- —
- Monthly P&I
- —
- Monthly cashflow
- —
- DSCR
- —
- Eligible?
- —
Personal DTI + credit; lowest rate.
DSCR
20% down · 8.5% · 30yr
- Down + closing
- —
- Monthly P&I
- —
- Monthly cashflow
- —
- DSCR
- —
- Eligible?
- —
No personal income docs; deal must DSCR.
Hard money
10% down · 12.0% · 12mo
- Down + closing
- —
- Monthly P&I
- —
- Monthly cashflow
- —
- DSCR
- —
- Eligible?
- —
Short-term bridge; refi at stabilization.
Rent comps 10 comps
| Address | Beds | Baths | Sqft | Rent | $/sqft | DOM | Units | Dist |
|---|---|---|---|---|---|---|---|---|
| 6077 N Tarako Ave Boise, ID | 3.0 | 2.5 | 1583 | $2,172 | $1.37 | 4d | 2 | 0.24mi |
| 7570 W State St Boise, ID | 1.0–4.0 | 1.0–2.5 | 1236 | $2,183 | $1.77 | 4d | 21 | 0.30mi |
| 7456 W Limelight Ct Boise, ID | 3.0 | 2.0 | 1278 | $2,095 | $1.64 | 5d | 1 | 0.46mi |
| 7356 N Lucy Rose Ln Apt 104 Boise, ID | 3.0 | 3.0 | 1300 | $1,895 | $1.46 | 5d | 1 | 0.75mi |
| 6200 N River Pointe Ln Garden City, ID | 1.0–3.0 | 1.0–2.0 | 1000 | $3,157 | $3.16 | 4d | 8 | 0.77mi |
| 9557 W State St Garden City, ID | 3.0 | 2.0 | 1242 | $1,850 | $1.49 | 4d | 1 | 0.87mi |
| 7228 W Rygate Dr Boise, ID | 3.0 | 2.5 | 1395 | $2,345 | $1.68 | 25d | 1 | 0.90mi |
| 6473 W Parapet Dr Unit 1 Boise, ID | 4.0 | 2.5 | 1396 | $2,300 | $1.65 | 5d | 1 | 0.93mi |
| 5967 N Pierce Park Ln Boise, ID | 3.0 | 2.0 | 1302 | $1,795 | $1.38 | 25d | 1 | 0.95mi |
| 6474 W Lucky Ln Unit 12202 Boise, ID | 2.0 | 2.0 | 1100 | $1,500 | $1.36 | 25d | 1 | 1.08mi |
Listing history 20 events
-
2026-06-17status $169,000 Pending 54 DOM
-
2026-06-17days on market $169,000 Active 54 DOM
-
2026-06-16days on market $169,000 Active 53 DOM
-
2026-06-15days on market $169,000 Active 52 DOM
-
2026-06-13days on market $169,000 Active 50 DOM
-
2026-06-10days on market $169,000 Active 47 DOM
-
2026-06-09days on market $169,000 Active 46 DOM
-
2026-06-08days on market $169,000 Active 45 DOM
-
2026-06-07days on market $169,000 Active 44 DOM
-
2026-06-05days on market $169,000 Active 41 DOM
-
2026-06-03days on market $169,000 Active 40 DOM
-
2026-06-03days on market $169,000 Active 39 DOM
-
2026-06-01days on market $169,000 Active 38 DOM
-
2026-05-31days on market $169,000 Active 37 DOM
-
2026-05-14price $169,000
-
2026-04-24$189,000 Active
-
2026-04-10historical
-
2026-01-29$195,000 Active
-
2015-07-27$25,000
-
2014-10-31$38,500
ⓘ Source: listings_history table (triggers on properties + properties_extension) + one-shot
backfill from property_details.listing_events for pre-trigger history.
Nearby sold comps map
Loading sold comps map…
Walkable amenities ~0.75 mi
Loading nearby amenities…
Taxation est. · year 1
- Rental income
- $26,403
- − Mortgage interest
- −$9,467
- − Property taxes
- −$2,535
- − Insurance
- −$845
- − Repairs & maintenance
- −$2,112
- − Management
- −$2,112
- − Depreciation
- −$4,916
- Taxable income
- $4,416
- Est. tax owed @ 24.0%
- −$1,060
- After-tax cash flow
- $5,784/yr
For passive investors: Depreciation is non-cash, so a rental often shows a tax loss while cash-flowing — sheltering income. Rental losses are passive: they offset passive income freely, and up to $25,000/yr can offset ordinary (W-2) income if you actively participate and your MAGI is under $100k (phasing out to $0 by $150k); unused losses carry forward. On sale, claimed depreciation is recaptured at up to 25%, and gains may owe capital-gains tax (a 1031 exchange can defer both). Figures are a year-1 estimate at your 24.0% rate — not tax advice; consult a CPA.
Schools (NCES district)
- District
- Boise Independent District
- NCES district ID
- 1600360
- Math proficiency
- 42% ▼ -5.00%
- Reading proficiency
- 56% ▼ -1.00%
- Median HH income
- $49,135
- Composite
- 41.82/100
- National rank
- #3388
- State rank
- #36 of 92 in ID
Livability — Garden City
- Score
- 82/100
- State rank
- #11
- US rank
- #1264
Category grades
Schools grade is shown separately in the Schools card above.
Census & demographics
- Census place
- Garden City, ID
- County
- Ada County · 522,161 people
- Metro
- Boise City, ID
- Population (ZIP)
- 27,564
- Household income
- $87,651
- Rent vs Own
- Severe rent burden
- 557.0
Population outlook (Ada County) Hauer SSP2
- Today (2025)
- 535,818 people
- By 2030
- 585,751 · +9.3%
- By 2040
- 682,435 · +27.4%
- By 2050
- 775,818 · +44.8%
- By 2075
- 994,458 · +85.6%
- By 2100
- 1,148,884 · +114.4%
Race, ethnicity, and origin ACS 2023
- Neighborhood character
- Predominantly White (86%)
- Race & ethnicity
- White 86% Hispanic / Latino 9% Two or more races 7%
- Hispanic origin (detail)
- Mexican 7%
- Common ancestry
- Italian 4% Slovak 4% Portuguese 4%
- Foreign-born
- 5% · Canada
- Languages at home
- 92% English-only · Spanish 5% Russian/Polish/Slavic 2% Other Indo-European 1%
Political lean MEDSL · Ada
- 2024 margin
- R (+10.3) · D 43.4% · R 53.8% · Other 2.8%
- 2008→2024 swing
- -4.2pp toward R · 2008: -6.2pp · 2024: -10.3pp
- All cycles
- 2024: R+10.3 2020: R+3.9 2016: R+9.2 2012: R+11.3 2008: R+6.2
Not yet ingested
- Civics
- —
Market trends
- HPI YoY
- ▼ -155.87%
- Current HPI
- 339.0701
- Rent YoY
- ▲ 4.87%
- Metro
- Boise City, ID
- State GDP YoY
- ▲ 4.51%
- F500 in state
- 6
Industry mix (Fortune 500 HQ in ID)
| Industry | F500 HQs | Revenue |
|---|---|---|
| Retail | 1 | $79B |
|
||
| Technology | 1 | $25B |
|
||
| Food / Agriculture | 1 | $6B |
|
||
Price history
+339.0% since first listed6 events — show timeline
- 2026-05-14 Price Changed $169,000 IMLS
- 2026-04-24 Listed $189,000 IMLS
- 2026-04-10 Listing Removed — IMLS
- 2026-01-29 Listed $195,000 IMLS
- 2015-07-27 Listed $25,000 IMLS
- 2014-10-31 Listed $38,500 IMLS
Cash-flow waterfall
monthlySold comps — $/sqft
last 12 mo · ≤1 miLoading sold comps…