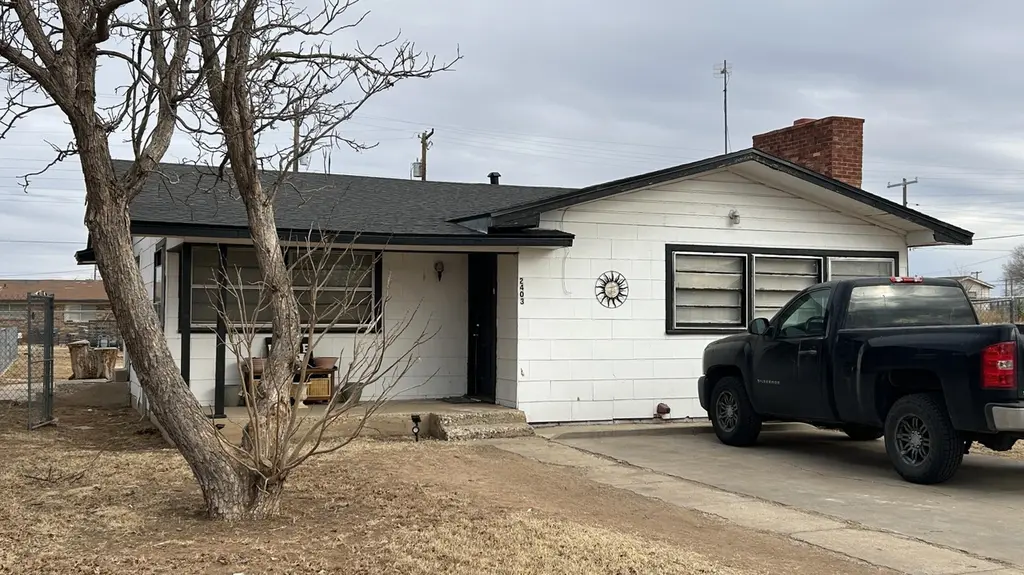
2403 Fir Ave · Lubbock, TX
Flood risk 1/10 · Minimal
- FEMA flood zone
- X (unshaded)
- Chance of flooding over 30 yrs
- 0.0%
- Est. flood insurance / yr
- $507 – $1,088
Fire risk 4/10 · Minor
- Est. fire insurance / yr
- $1,222 – $2,270
Heat risk 5/10 · Moderate
- Hot days now (above 100°F)
- 7 days/yr
- Hot days in 30 yrs
- 21 days/yr
Wind risk 2/10 · Minimal
- Chance of severe wind over 30 yrs
- —
Air-quality risk 2/10 · Minimal
- Unhealthy air days now
- 1 days/yr
- Unhealthy air days in 30 yrs
- 1 days/yr
Risk factors via First Street. Map © Google.
Why this score? — see what drove the A- grade
The composite is a weighted blend of 9 inputs, each scored 0–100. Each bar is that input's sub-score; the figure is the points it added to the 100-point composite (weight × sub-score).
- Cash flow +30.0/30.0
- ARV discount +15.0/15.0
- 1% rule +10.0/10.0
- DSCR +10.0/10.0
- Appreciation +6.6/10.0
- Livability +4.0/5.0
- Schools +3.1/10.0
- Rent growth +2.5/5.0
- Condition / age +2.5/5.0
$65,000
🖨 Deal sheet (PDF) 📄 Offer letter ✓ Due diligence
Listing remarks MLS
Discover this charming and updated 3-bedroom, 1-bath home located in a quiet, established neighborhood. Featuring a functional layout with comfortable living space, this property offers fresh interior touches, neutral colors, and great natural light throughout. The kitchen provides ample storage and flows easily into the living area—ideal for everyday living. Sitting on a generous lot, the backyard delivers plenty of room for outdoor activities, pets, or future additions. With convenient access to schools, parks, shopping, and major roadways, this home is a great option for both homeowners and investors.
Key facts
- 7,000 sq ft lot
- Built 1958
- Listed 131 days
Neighborhood map
What this means for you Summary
Snapshot
- This is a 3-bed/1.0-bath single-family listed at $65k.
Deal economics
- At list price, monthly cash flow is $408 ($5k/yr) — positive.
- The deal already cash-flows at list — no discount required.
- Meets the 1% rule at list price ($1k rent vs $65k).
- Recommended offer: $57k (12.0% below list) — sets the bar for market timing.
Location & tenants
- Location reads 80/100 on livability (#37 in TX, #1,749 nationally) — a professional / high-income tenant draw. Strengths: commute A+, cost of living A+, housing A+; Watch: employment C-, crime F.
- Lubbock ISD (urban): math 36% / reading 39% proficiency, ranked #481 of 826 in TX (top 58%) — families likely to look elsewhere, expect single-tenant / working-renter base with shorter leases; 60% free/reduced lunch — lower-income household profile, screen leases tightly.
- Zoned schools: Ervin El (math 17% / reading 17%, grade F, #3,836 of 4,322 statewide, top 91%, 405 students, 97% FRL, charter); Dunbar College Preparatory Academy (math 16% / reading 20%, grade F, #1,491 of 1,662 statewide, top 91%, 430 students, 97% FRL, charter); Estacado H S (math 26% / reading 29%, grade F, #1,183 of 1,632 statewide, top 73%, 897 students, 90% FRL) — zoned schools average 95% FRL vs 60% district-wide (35 pts higher); higher-poverty schools than district average — tighter screening recommended.
- Zoned-school proficiency averages 21% at this address vs 38% district-wide (-17 pts) — the specific schools serving this property underperform the Lubbock ISD average; the district grade overstates school quality for this exact location.
- Market conditions: 93 active listings in the ZIP; 37 comparable units currently listed for rent nearby; rentals at typical pace (median 23d on market — plan ~3-4 weeks tenant-placement turnaround); 49% of comp listings sitting > 30 days — soft ceiling on asking rent; 2,219 units permitted in Lubbock County in 2024 (252 in 5+ unit buildings).
Forward outlook
- In year one you build about $3k of equity ($449 loan paydown + $2k appreciation (3.2% local appreciation)).
- Lubbock County population projected at +39% by 2050 — long-run rental-demand tailwind backs the buy-and-hold thesis.
- At projected returns (3.2% appreciation + 3.0% rent growth), your $18k cash investment doubles in ~3 years — after that, you're playing with house money.
Negotiation context
- It's been on market 131 days — a 12% lower offer ($57k) is reasonable based on typical stale-listing flexibility.
- 3 sale attempts since 9y ago with the ask held roughly flat each time — persistent listings suggest the price (not the market) is what's stuck; bring a comps-based counter.
Risks & watch-outs
- Watch-outs: built in 1958 — expect roof / HVAC / electrical / plumbing capex.
- Climate carrying-cost: extreme-heat days projected 7→21/yr by 2055 (HVAC capex compounding) — expect insurance premiums to compound above CPI over the hold.
Questions for the listing agent
- It's been on market 131 days. Have you received any prior offers? Is the seller open to a 12% concession, seller financing, or rate buy-down credit?
- Built in 1958 — when were the roof, HVAC, electrical panel, plumbing, and water heater last replaced?
- Why hasn't it sold? Are there any deal-killer items the seller is aware of (foundation, flood, title, zoning, code violations)?
- Is there a deadline driving the sale (1031 exchange, divorce, estate, relocation)? That informs how much negotiation room exists.
- Schools are D-rated, which usually means shorter tenancies and higher turnover. Who's the typical renter profile here, and what's been the actual vacancy rate?
- Crime grade is F in this area — have there been break-ins, vandalism, or insurance claims at this property in the last 3 years? What carrier currently insures it and at what premium?
- What's the average days-on-market for RENTAL listings here right now (not sales)? A rising rental-DOM trend means longer vacancies and softer asking-rent achievability than the comps imply.
- What's the recent tenant-quality profile in this submarket — average credit score on applications, eviction rate, late-payment / NSF rate, and stable-employment percentage? A property-management company in the area should have these aggregated.
- How much new for-sale + rental construction is in the pipeline within 1–3 miles? Heavy new supply typically softens prices + rents 12–24 months out; constrained supply supports both.
Investment metrics
- 1% rule
- 1.71% ✓
- Cap rate
- 13.83%
- Cash-on-cash
- 26.92%
- DSCR
- 2.20
- GRM
- 4.9
CMA / ARV
- ARV (median comp)
- $87,749
- List price
- $65,000
- Delta
- -25.92%
- Verdict
- UNDERPRICED
- Comps
- 6 within 2.0 mi
Projected returns pro-forma
3.22% appreciation · 3.0% rent growth · sell at horizon
- IRR
- 33.3%
- Equity multiple
- 2.90×
- Total profit
- $34,635
- Equity at exit
- $30,048
- IRR
- 33.4%
- Equity multiple
- 5.72×
- Total profit
- $85,958
- Equity at exit
- $46,956
Cash invested: $18,200 (down + closing). Projections, not guarantees.
Landlord ↔ Tenant lean methodology
- Overall (STATE)
- 87 Strongly Landlord-Friendly
- State Texas
- 87 Strongly Landlord-Friendly · R+5
- County
- — inherits STATE
- City
- — inherits STATE
ZIP-level market 79404
- Home prices YoY
- 2.0%
- Active inventory
- 93
- Price-to-rent
- 4.9×
Monthly cashflow live
- Estimated rent
- $1,113 high interval (Pro) →
- Mortgage (P&I)
- −$341
- Tax from tax record
- −$103 /mo · $1,238/yr
- Insurance
- −$27
- HOA
- −$0
- Vacancy / Maint / Mgmt
- −$234
- Net cashflow
- $408
Break-even live
Sensitivity live
| Price | -10% $445 | -5% $427 | +0% $408 | +5% $390 | +10% $371 |
|---|---|---|---|---|---|
| Rent | -10% $320 | -5% $364 | +0% $408 | +5% $452 | +10% $496 |
| Rate | -1.0pp $441 | -0.5pp $425 | base $408 | +0.5pp $391 | +1.0pp $374 |
UW: 25.0% down · 7.5% · 30yr · 1.5% tax · 5.0% vac · 8.0% maint · 8.0% mgmt
Financing live
Cash to close
- Down payment
- $16,250
- Closing costs
- $1,950
- Reserves months
- —
- Total cash needed
- —
Loan-product check · same deal, 3 products live
Conventional
25% down · 7.5% · 30yr
- Down + closing
- —
- Monthly P&I
- —
- Monthly cashflow
- —
- DSCR
- —
- Eligible?
- —
Personal DTI + credit; lowest rate.
DSCR
20% down · 8.5% · 30yr
- Down + closing
- —
- Monthly P&I
- —
- Monthly cashflow
- —
- DSCR
- —
- Eligible?
- —
No personal income docs; deal must DSCR.
Hard money
10% down · 12.0% · 12mo
- Down + closing
- —
- Monthly P&I
- —
- Monthly cashflow
- —
- DSCR
- —
- Eligible?
- —
Short-term bridge; refi at stabilization.
Rent comps 37 comps
| Address | Beds | Baths | Sqft | Rent | $/sqft | DOM | Units | Dist |
|---|---|---|---|---|---|---|---|---|
| 2603 Elm Ave Lubbock, TX | 3.0 | 2.0 | 1214 | $1,175 | $0.97 | 45d | 1 | 0.17mi |
| 1516 E 27th St Unit B Lubbock, TX | 2.0 | 2.0 | 1025 | $1,195 | $1.17 | 45d | 1 | 0.69mi |
| 1704 E 29th St Lubbock, TX | 2.0 | 1.0 | 832 | $775 | $0.93 | 22d | 1 | 0.79mi |
| 505 E 37th St Lubbock, TX | 3.0 | 1.0 | 960 | $1,125 | $1.17 | 15d | 1 | 0.87mi |
| 209 36th St Unit A Lubbock, TX | 3.0 | 1.0 | 750 | $750 | $1.00 | 45d | 1 | 0.89mi |
| 211 36th St Unit B Lubbock, TX | 3.0 | 1.0 | 750 | $775 | $1.03 | 45d | 1 | 0.89mi |
| 330 37th St Unit 2 Lubbock, TX | 3.0 | 1.0 | 750 | $750 | $1.00 | 15d | 1 | 0.97mi |
| 332 37th St Unit 2 Lubbock, TX | 3.0 | 1.0 | 725 | $700 | $0.97 | 22d | 1 | 0.97mi |
| 3113 Teak Ave Lubbock, TX | 3.0 | 1.0 | 1088 | $695 | $0.64 | 22d | 1 | 0.98mi |
| 3113 Teak Ave Lubbock, TX | 3.0 | 1.0 | 1088 | $750 | $0.69 | 45d | 1 | 0.98mi |
| 1903 E 15th St Unit B Lubbock, TX | 2.0 | 2.0 | 950 | $1,075 | $1.13 | 15d | 1 | 1.01mi |
| 607 Main St Lubbock, TX | 2.0 | 1.5 | 1500 | $1,049 | $0.70 | 45d | 1 | 1.07mi |
| 2015 Avenue L Unit B Lubbock, TX | 3.0 | 2.0 | 980 | $960 | $0.98 | 15d | 1 | 1.08mi |
| 419 38th St Lubbock, TX | 3.0 | 1.0 | 1206 | $950 | $0.79 | 45d | 1 | 1.09mi |
| 1313 25th St Lubbock, TX | 2.0 | 1.0 | 780 | $875 | $1.12 | 45d | 1 | 1.16mi |
| 512 39th St Lubbock, TX | 2.0 | 1.0 | 876 | $849 | $0.97 | 15d | 1 | 1.16mi |
| 1516 E 8th St Lubbock, TX | 3.0 | 2.0 | 1172 | $1,050 | $0.90 | 22d | 1 | 1.23mi |
| 2206 E Main St Lubbock, TX | 3.0 | 2.0 | 1152 | $975 | $0.85 | 46d | 1 | 1.30mi |
| 1204 36th St Unit b Lubbock, TX | 3.0 | 2.0 | 872 | $835 | $0.96 | 15d | 1 | 1.30mi |
| 2117 E Broadway Unit 1 Lubbock, TX | 3.0 | 1.0 | 963 | $950 | $0.99 | 45d | 1 | 1.31mi |
| 1915 Avenue O Unit O Lubbock, TX | 2.0 | 1.0 | 732 | $750 | $1.02 | 45d | 1 | 1.31mi |
| 2123 E Broadway Unit 2 Lubbock, TX | 3.0 | 1.0 | 963 | $950 | $0.99 | 22d | 1 | 1.32mi |
| 3104 Avenue N Lubbock, TX | 2.0 | 1.0 | 750 | $785 | $1.05 | 22d | 1 | 1.32mi |
| 2211 E Main St Lubbock, TX | 3.0 | 2.0 | 1172 | $1,100 | $0.94 | 45d | 1 | 1.33mi |
| 2906 Beech Ave Lubbock, TX | 3.0 | 1.0 | 912 | $1,200 | $1.32 | 45d | 1 | 1.35mi |
| 1220 Broadway St Unit 1704 Lubbock, TX | 2.0 | 2.0 | 1098 | $999 | $0.91 | 45d | 1 | 1.35mi |
| 220 44th St Unit A Lubbock, TX | 3.0 | 2.0 | 980 | $910 | $0.93 | 15d | 1 | 1.35mi |
| 2226 E Main St Lubbock, TX | 3.0 | 2.0 | 1100 | $1,150 | $1.05 | 45d | 1 | 1.35mi |
| 1220 Broadway St Lubbock, TX | 1.0–2.0 | 1.0–2.0 | 932 | $1,500 | $1.61 | 15d | 7 | 1.35mi |
| 1601 21st St Unit a Lubbock, TX | 3.0 | 2.0 | 980 | $925 | $0.94 | 15d | 1 | 1.36mi |
| 519 42nd St Apt A Lubbock, TX | 3.0 | 1.0 | 1092 | $895 | $0.82 | 15d | 1 | 1.36mi |
| 824 Vanda Ave Lubbock, TX | 3.0 | 1.0 | 832 | $750 | $0.90 | 45d | 1 | 1.37mi |
| 1202 Main St Lubbock, TX | 3.0 | 1.0–2.0 | 919 | $1,653 | $1.80 | 15d | 13 | 1.39mi |
| 1609 27th St Lubbock, TX | 2.0 | 1.0 | 862 | $900 | $1.04 | 45d | 1 | 1.40mi |
| 1610 28th St Unit A Lubbock, TX | 2.0 | 2.0 | 1060 | $750 | $0.71 | 15d | 1 | 1.41mi |
| 808 Vanda Ave Lubbock, TX | 3.0 | 1.0 | 832 | $695 | $0.84 | 22d | 1 | 1.42mi |
| 2806 E 30th St Lubbock, TX | 3.0 | 1.0 | 912 | $900 | $0.99 | 45d | 1 | 1.43mi |
Listing history 24 events
-
2026-06-22days on market $65,000 Active 131 DOM
-
2026-06-18days on market $65,000 Active 128 DOM
-
2026-06-17days on market $65,000 Active 127 DOM
-
2026-06-16days on market $65,000 Active 126 DOM
-
2026-06-15days on market $65,000 Active 125 DOM
-
2026-06-14days on market $65,000 Active 123 DOM
-
2026-06-13days on market $65,000 Active 122 DOM
-
2026-06-10days on market $65,000 Active 120 DOM
-
2026-06-09days on market $65,000 Active 119 DOM
-
2026-06-08days on market $65,000 Active 118 DOM
-
2026-06-07days on market $65,000 Active 117 DOM
-
2026-06-05days on market $65,000 Active 114 DOM
-
2026-06-03days on market $65,000 Active 113 DOM
-
2026-06-02days on market $65,000 Active 112 DOM
-
2026-06-01days on market $65,000 Active 111 DOM
-
2026-05-31days on market $65,000 Active 110 DOM
-
2026-05-30days on market $65,000 Active 109 DOM
-
2026-02-10$65,000 Active 617-char remark
Show marketing remark (617 chars)
Discover this charming and updated 3-bedroom, 1-bath home located in a quiet, established neighborhood. Featuring a functional layout with comfortable living space, this property offers fresh interior touches, neutral colors, and great natural light throughout. The kitchen provides ample storage and flows easily into the living area—ideal for everyday living. Sitting on a generous lot, the backyard delivers plenty of room for outdoor activities, pets, or future additions. With convenient access to schools, parks, shopping, and major roadways, this home is a great option for both homeowners and investors.
-
2024-01-11historical $700
-
2023-12-20price $700
-
2023-11-10$800
-
2017-12-08soldstatus 254-char remark
Show marketing remark (254 chars)
Please call Charley for appointment to Show 24 hours advance. Current renter pays $565 monthly. At this price you can have a 12 CAP rate. Minor upgrade to house could raise rent to $650.00 Elementary and Jr high near by. Can be sold as a 3 house package.
-
2017-10-09$45,500 254-char remark
Show marketing remark (254 chars)
Please call Charley for appointment to Show 24 hours advance. Current renter pays $565 monthly. At this price you can have a 12 CAP rate. Minor upgrade to house could raise rent to $650.00 Elementary and Jr high near by. Can be sold as a 3 house package.
-
2009-03-13soldstatus
ⓘ Source: listings_history table (triggers on properties + properties_extension) + one-shot
backfill from property_details.listing_events for pre-trigger history.
Tax reassessment forecast TX · Resets to sale price
- Current annual tax
- $1,238 · $103/mo
- Projected year-2 tax
- $1,238 · $103/mo
- Expected delta
- $0/yr ($0/mo · 0.0%)
ⓘ Screening estimate from a state-policy table — verify with the county assessor before closing.
Climate risk First Street
- Flood 1/10 Low FEMA zone X (unshaded) · 0% chance over 30 yrs
- Wildfire 4/10 Moderate
- Heat 5/10 Major 7 d/yr ≥100°F today · 21 d/yr by 30 yrs out
- Wind 2/10 Low
- Air quality 2/10 Low 1 unhealthy d/yr today · 1 by 30 yrs out
Nearby sold comps map
Loading sold comps map…
Walkable amenities ~0.75 mi
Loading nearby amenities…
Taxation est. · year 1
- Rental income
- $13,358
- − Mortgage interest
- −$3,641
- − Property taxes
- −$1,238
- − Insurance
- −$325
- − Repairs & maintenance
- −$1,069
- − Management
- −$1,069
- − Depreciation
- −$1,891
- Taxable income
- $4,126
- Est. tax owed @ 24.0%
- −$990
- After-tax cash flow
- $3,909/yr
For passive investors: Depreciation is non-cash, so a rental often shows a tax loss while cash-flowing — sheltering income. Rental losses are passive: they offset passive income freely, and up to $25,000/yr can offset ordinary (W-2) income if you actively participate and your MAGI is under $100k (phasing out to $0 by $150k); unused losses carry forward. On sale, claimed depreciation is recaptured at up to 25%, and gains may owe capital-gains tax (a 1031 exchange can defer both). Figures are a year-1 estimate at your 24.0% rate — not tax advice; consult a CPA.
Schools (NCES district)
- District
- Lubbock ISD
- NCES district ID
- 4828500
- Math proficiency
- 36% ▼ -8.00%
- Reading proficiency
- 39% ▼ -1.00%
- Median HH income
- $39,820
- Composite
- 31.44/100
- National rank
- #5984
- State rank
- #481 of 826 in TX
Livability — Lubbock
- Score
- 80/100
- State rank
- #37
- US rank
- #1749
Category grades
Schools grade is shown separately in the Schools card above.
Census & demographics
- Census place
- Lubbock, TX
- County
- Lubbock County · 293,542 people
- City population
- 283,030
- Metro
- Lubbock, TX
- Population (ZIP)
- 8,529
- Household income
- $51,630
- Rent vs Own
- Severe rent burden
- 366.0
Population outlook (Lubbock County) Hauer SSP2
- Today (2025)
- 345,960 people
- By 2030
- 371,449 · +7.4%
- By 2040
- 424,539 · +22.7%
- By 2050
- 481,150 · +39.1%
- By 2075
- 633,467 · +83.1%
- By 2100
- 746,853 · +115.9%
Race, ethnicity, and origin ACS 2023
- Neighborhood character
- Diverse neighborhood (Simpson 0.60)
- Race & ethnicity
- Hispanic / Latino 55% Black 22% White 20% Two or more races 17% Native American 2%
- Hispanic origin (detail)
- Mexican 46%
- Common ancestry
- Romanian 1% Lithuanian 0%
- Foreign-born
- 5% · Canada
- Languages at home
- 64% English-only · Spanish 36%
Political lean MEDSL · Lubbock
- 2024 margin
- Solid R (+39.5) · D 29.7% · R 69.2% · Other 1.0%
- 2008→2024 swing
- -2.8pp toward R · 2008: -36.7pp · 2024: -39.5pp
- All cycles
- 2024: R+39.5 2020: R+32.2 2016: R+38.4 2012: R+40.9 2008: R+36.7
Not yet ingested
- Civics
- —
Market trends
- HPI YoY
- ▲ 3.22%
- Current HPI
- 163.854
- Rent YoY
- —
- Metro
- Lubbock, TX
- State GDP YoY
- ▲ 3.95%
- F500 in state
- 110
Industry mix (Fortune 500 HQ in TX)
| Industry | F500 HQs | Revenue |
|---|---|---|
| Energy | 16 | $1,198B |
|
||
| Technology | 5 | $198B |
|
||
| Engineering / Construction | 4 | $72B |
|
||
| Energy Services | 3 | $60B |
|
||
| Utilities | 3 | $41B |
|
||
| Healthcare | 2 | $330B |
|
||
Price history
+42.9% since first listed7 events — show timeline
- 2026-02-10 Listed $65,000 LARMLS
- 2024-01-11 Rental Removed $700 LARMLS
- 2023-12-20 Price Changed $700 LARMLS
- 2023-11-10 Listed for Rent $800 LARMLS
- 2017-12-08 Sold (MLS) — LARMLS
- 2017-10-09 Listed $45,500 LARMLS
- 2009-03-13 Sold (Public Records) — Public Records
Property tax history
+7.2%/yrLatest (2025): $1,238 · +16.9% YoY. Source: county tax records.
Cash-flow waterfall
monthlySold comps — $/sqft
last 12 mo · ≤1 miLoading sold comps…