 6-Plex
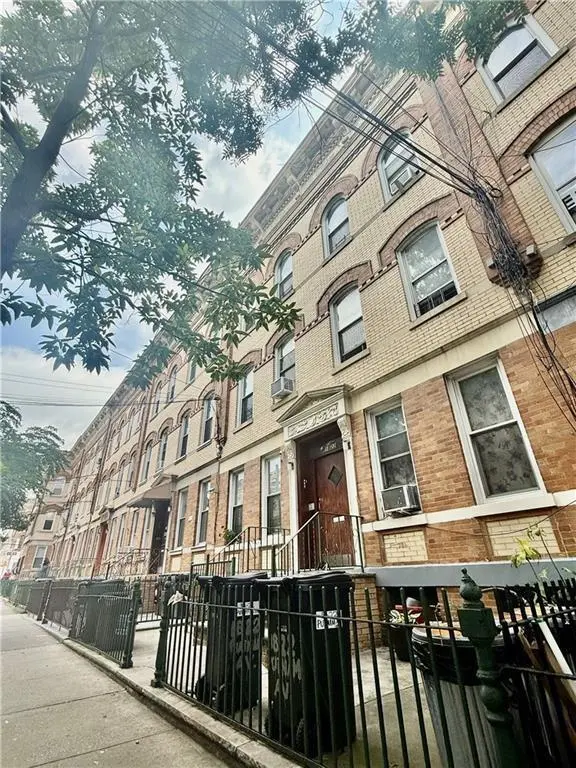
1822 Putnam Ave · New York, NY
Flood risk 1/10 · Minimal
- FEMA flood zone
- X (unshaded)
- Chance of flooding over 30 yrs
- 0.0%
- Est. flood insurance / yr
- $507 – $1,088
Fire risk 1/10 · Minimal
- Est. fire insurance / yr
- $691 – $1,283
Heat risk 6/10 · Moderate
- Hot days now (above 99°F)
- 7 days/yr
- Hot days in 30 yrs
- 14 days/yr
Wind risk 6/10 · Moderate
- Chance of severe wind over 30 yrs
- 40.0%
Air-quality risk 5/10 · Moderate
- Unhealthy air days now
- 6 days/yr
- Unhealthy air days in 30 yrs
- 8 days/yr
Risk factors via First Street. Map © Google.
Why this score? — see what drove the B- grade
The composite is a weighted blend of 9 inputs, each scored 0–100. Each bar is that input's sub-score; the figure is the points it added to the 100-point composite (weight × sub-score).
- Cash flow +27.2/30.0
- DSCR +9.4/10.0
- ARV discount +7.5/15.0
- 1% rule +7.4/10.0
- Schools +5.0/10.0
- Livability +3.8/5.0
- Rent growth +3.7/5.0
- Condition / age +2.5/5.0
- Appreciation +0.0/10.0
$1,250,000
🖨 Deal sheet 📄 Offer letter ✓ Due diligence
Multi-family units
County records classify this as Multi-Family (5+ Unit). Listing-text estimate: 6 units. confirmed
5+ unit building — per-unit beds/baths from public records are typically unavailable; the breakdown below (if shown) is an estimate from the listing text.
Listing remarks
Six family solid brick building for sale in Ridgewood, Queens. Every unit features three bedroom and one full bathroom. It's well kept building and generates 4.4% cap rate. The basement has front and rear entrance, interior staircase leads to the spacious basement. Minutes away to business district on Myrtle Avenue. You would start collecting incomes at the same day when you close the deal.
Key facts
- 2,717 sq ft lot
- Built 1931
- Listed 49 days
Property features AI
Finance
- Other: Residential property with six rental units
- Financial info: Financing options may include bank mortgage, cash, or exchange considered; Reported utility expense: $700 (unit/period not specified)
Exterior
- Parking: No designated parking
- Utilities: Electric: 110V; Gas hot water and heating
- Home design: Attached building; Three stories
- Construction: Brick exterior; Flat roof; Poured concrete foundation; Building footprint approximately 68 x 27 feet
- Exterior features: Back yard
Interior
- Kitchen: Each unit includes an oven/range
- Bedrooms: Six 3-bedroom units (two units per floor across three floors)
- Flooring: No flooring information provided
- Bathrooms: Six full bathrooms (distributed as two per floor)
- Heating & cooling: Steam/radiator heat; Hot water heated by gas
- Interior features: Stove; Finished full basement
- Laundry & utility: No central AC units reported
Neighborhood map
What this means for you Summary
Snapshot
- This is a 6 × 3-bed/1.0-bath units multifamily listed at $1.25M.
Deal economics
- At list price, monthly cash flow is $4k ($43k/yr) — positive. Per door: $593/mo.
- The deal already cash-flows at list — no discount required.
- Meets the 1% rule at list price ($15k rent vs $1.25M).
- Recommended offer: $1.21M (3.0% below list) — sets the bar for market timing.
- Cap rate 9.7% vs local median 2.6% in New York — top-decile yield for the area; either an underpriced asset or a hidden risk that comps aren't pricing in. Stress-test before assuming the spread holds.
Location & tenants
- Location reads 75/100 on livability (#268 in NY, #4,188 nationally) — a middle-class / working-renter tenant base. Strengths: amenities A+, commute A+, health & safety A; Watch: crime F, cost of living F.
- Market conditions: Rents rising fast (+5.0%/yr); 212 active listings in the ZIP; solid renter incomes; 5,302 units permitted in Queens County in 2024 (4,918 in 5+ unit buildings).
- At $15,471/mo this rent would consume 209% of the median local household income ($89k/yr) (locally 5525% of renters already pay >50% of income on rent) — very limited rent-growth headroom before tenants either downsize or default.
Forward outlook
- Local home prices are declining (-3.0%/yr); year-one equity from $9k of loan paydown is wiped out by about $38k of value loss. Plan a longer hold.
- Queens County population projected at +16% by 2050 — long-run rental-demand tailwind backs the buy-and-hold thesis.
- At projected returns (-3.0% appreciation + 5.0% rent growth), your $350k cash investment doubles in ~8 years — after that, you're playing with house money.
Negotiation context
- It's been on market 49 days — a 3% lower offer ($1.21M) is reasonable based on typical stale-listing flexibility.
Risks & watch-outs
- Watch-outs: built in 1931 — expect roof / HVAC / electrical / plumbing capex.
- Climate carrying-cost: major wind risk, 40% chance of damaging wind over 30y; extreme-heat days projected 7→14/yr by 2055 (HVAC capex compounding) — expect insurance premiums to compound above CPI over the hold.
Questions for the listing agent
- It's been on market 49 days. Have you received any prior offers? Is the seller open to a 3% concession, seller financing, or rate buy-down credit?
- Can we see the unit-by-unit rent roll, current vacancy, and any below-market leases? What's the average tenancy length?
- What capital expenditures (roof, boiler, parking lot, exteriors) have been made in the last 5 years, and what's planned in the next 2?
- Built in 1931 — when were the roof, HVAC, electrical panel, plumbing, and water heater last replaced?
- Is there a deadline driving the sale (1031 exchange, divorce, estate, relocation)? That informs how much negotiation room exists.
- Schools are B-rated — typically a magnet for longer-tenancy family renters. What's the average tenant stay here, and is there a school-zone premium baked into asking?
- Crime grade is F in this area — have there been break-ins, vandalism, or insurance claims at this property in the last 3 years? What carrier currently insures it and at what premium?
- What's the average days-on-market for RENTAL listings here right now (not sales)? A rising rental-DOM trend means longer vacancies and softer asking-rent achievability than the comps imply.
- What's the recent tenant-quality profile in this submarket — average credit score on applications, eviction rate, late-payment / NSF rate, and stable-employment percentage? A property-management company in the area should have these aggregated.
- How much new apartment / multifamily construction is in the pipeline within 1–3 miles? Heavy new supply (>2% of stock underway) typically softens rents 12–24 months out; light construction supports rent growth.
Investment metrics
- 1% rule
- 1.24% ✓
- Cap rate
- 9.71%
- Cash-on-cash
- 12.21%
- DSCR
- 1.54
- GRM
- 6.7
CMA / ARV
No comps found within radius.
Projected returns pro-forma
-3.0% appreciation · 4.97% rent growth · sell at horizon
- IRR
- 4.0%
- Equity multiple
- 1.16×
- Total profit
- $55,706
- Equity at exit
- $186,379
- IRR
- 15.3%
- Equity multiple
- 2.36×
- Total profit
- $475,064
- Equity at exit
- $108,077
Cash invested: $350,000 (down + closing). Projections, not guarantees.
Landlord ↔ Tenant lean methodology
- Overall (CITY)
- 0 Strongly Tenant-Friendly
- State New York
- 15 Strongly Tenant-Friendly · D+10
- County
- — inherits STATE
- City New York
- 0 Strongly Tenant-Friendly · D+34
ZIP-level market 11385
- Rents YoY
- 5.0%
- Active inventory
- 212
- Price-to-rent
- 40.4×
Monthly cashflow live
- Estimated rent
- $15,471 high interval (Pro) →
- Mortgage (P&I)
- −$6,555
- Tax from tax record
- −$1,586 /mo · $19,032/yr
- Insurance
- −$521
- HOA
- −$0
- Vacancy / Maint / Mgmt
- −$3,249
- Net cashflow
- $3,560
Break-even live
6-unit breakdown (identical units grouped — click to expand)
| Units | Beds | Baths | Est. rent |
|---|---|---|---|
| 6× units | 3 | 1 | $15,468 |
| #1 | 3 | 1 | $2,578 |
| #2 | 3 | 1 | $2,578 |
| #3 | 3 | 1 | $2,578 |
| #4 | 3 | 1 | $2,578 |
| #5 | 3 | 1 | $2,578 |
| #6 | 3 | 1 | $2,578 |
| Total (6 units) | $15,471 | ||
UW: 25.0% down · 7.5% · 30yr · 1.5% tax · 5.0% vac · 8.0% maint · 8.0% mgmt
Financing live
Cash to close
- Down payment
- $312,500
- Closing costs
- $37,500
- Reserves months
- —
- Total cash needed
- —
Loan-product check · same deal, 3 products live
Conventional
25% down · 7.5% · 30yr
- Down + closing
- —
- Monthly P&I
- —
- Monthly cashflow
- —
- DSCR
- —
- Eligible?
- —
Personal DTI + credit; lowest rate.
DSCR
20% down · 8.5% · 30yr
- Down + closing
- —
- Monthly P&I
- —
- Monthly cashflow
- —
- DSCR
- —
- Eligible?
- —
No personal income docs; deal must DSCR.
Hard money
10% down · 12.0% · 12mo
- Down + closing
- —
- Monthly P&I
- —
- Monthly cashflow
- —
- DSCR
- —
- Eligible?
- —
Short-term bridge; refi at stabilization.
Listing history 14 events
-
2026-06-18days on market $1,250,000 Active 49 DOM
-
2026-06-17days on market $1,250,000 Active 48 DOM
-
2026-06-16days on market $1,250,000 Active 47 DOM
-
2026-06-15days on market $1,250,000 Active 46 DOM
-
2026-06-13days on market $1,250,000 Active 44 DOM
-
2026-06-10days on market $1,250,000 Active 40 DOM
-
2026-06-08days on market $1,250,000 Active 39 DOM
-
2026-06-08days on market $1,250,000 Active 38 DOM
-
2026-06-04days on market $1,250,000 Active 35 DOM
-
2026-06-03days on market $1,250,000 Active 34 DOM
-
2026-06-01days on market $1,250,000 Active 32 DOM
-
2026-05-31days on market $1,250,000 Active 31 DOM
-
2026-04-30$1,250,000 Active
-
2025-12-29price $1,290,000
ⓘ Source: listings_history table (triggers on properties + properties_extension) + one-shot
backfill from property_details.listing_events for pre-trigger history.
Tax reassessment forecast NY · Partial reset (capped growth)
- Current annual tax
- $19,032 · $1,586/mo
- Projected year-2 tax
- $20,079 · $1,673/mo
- Expected delta
- +$1,046/yr (+$87/mo · 5.5%)
ⓘ Screening estimate from a state-policy table — verify with the county assessor before closing.
Climate risk First Street
- Flood 1/10 Low FEMA zone X (unshaded) · 0% chance over 30 yrs
- Wildfire 1/10 Low
- Heat 6/10 Major 7 d/yr ≥99°F today · 14 d/yr by 30 yrs out
- Wind 6/10 Major 40% chance of damaging wind over 30 yrs
- Air quality 5/10 Major 6 unhealthy d/yr today · 8 by 30 yrs out
Nearby sold comps map
Loading sold comps map…
Walkable amenities ~0.75 mi
Loading nearby amenities…
Taxation est. · year 1
- Rental income
- $185,652
- − Mortgage interest
- −$70,019
- − Property taxes
- −$19,032
- − Insurance
- −$6,250
- − Repairs & maintenance
- −$14,852
- − Management
- −$14,852
- − Depreciation
- −$36,364
- Taxable income
- $24,282
- Est. tax owed @ 24.0%
- −$5,828
- After-tax cash flow
- $36,893/yr
For passive investors: Depreciation is non-cash, so a rental often shows a tax loss while cash-flowing — sheltering income. Rental losses are passive: they offset passive income freely, and up to $25,000/yr can offset ordinary (W-2) income if you actively participate and your MAGI is under $100k (phasing out to $0 by $150k); unused losses carry forward. On sale, claimed depreciation is recaptured at up to 25%, and gains may owe capital-gains tax (a 1031 exchange can defer both). Figures are a year-1 estimate at your 24.0% rate — not tax advice; consult a CPA.
Schools (NCES district)
No district data.
Livability — New York
- Score
- 75/100
- State rank
- #268
- US rank
- #4188
Category grades
Schools grade is shown separately in the Schools card above.
Census & demographics
- Census place
- New York, NY
- County
- Queens County · 1,914,869 people
- City population
- 7,731,280
- Metro
- New York-Newark-Jersey City, NY-NJ-PA
- Population (ZIP)
- 101,704
- Household income
- $88,838
- Rent vs Own
- Severe rent burden
- 5525.0
Population outlook (Queens County) Hauer SSP2
- Today (2025)
- 2,546,320 people
- By 2030
- 2,643,059 · +3.8%
- By 2040
- 2,815,563 · +10.6%
- By 2050
- 2,944,423 · +15.6%
- By 2075
- 3,123,338 · +22.7%
- By 2100
- 3,098,688 · +21.7%
Race, ethnicity, and origin ACS 2023
- Neighborhood character
- Diverse neighborhood (Simpson 0.61)
- Race & ethnicity
- Hispanic / Latino 45% White 43% Two or more races 17% Asian 7% Black 3%
- Hispanic origin (detail)
- Mexican 4% Puerto Rican 12% Dominican 8%
- Common ancestry
- Romanian 7% Scandinavian 1% Subsaharan African 1%
- Foreign-born
- 39% · Canada, Jamaica, China
- Languages at home
- 42% English-only · Spanish 34% Russian/Polish/Slavic 9% Other Indo-European 8%
Political lean MEDSL · Queens
- 2024 margin
- Strong D (+24.6) · D 62.3% · R 37.7%
- 2008→2024 swing
- -26.2pp toward R · 2008: 50.8pp · 2024: 24.6pp
- All cycles
- 2024: D+24.6 2020: D+45.2 2016: D+53.4 2012: D+58.5 2008: D+50.8
Not yet ingested
- Civics
- —
Market trends
- HPI YoY
- ▼ -213.55%
- Current HPI
- 300.9364
- Rent YoY
- ▲ 4.97%
- Metro
- New York-Newark-Jersey City, NY-NJ-PA
- State GDP YoY
- ▲ 2.60%
- F500 in state
- 92
Industry mix (Fortune 500 HQ in NY)
| Industry | F500 HQs | Revenue |
|---|---|---|
| Financial Services | 10 | $950B |
|
||
| Consumer Goods | 9 | $162B |
|
||
| Insurance | 4 | $225B |
|
||
| Telecommunications | 2 | $144B |
|
||
| Pharmaceuticals | 2 | $112B |
|
||
| Media / Entertainment | 2 | $69B |
|
||
Price history
-3.1% since first listed2 events — show timeline
- 2026-04-30 Listed $1,250,000 BNYMLS
- 2025-12-29 Price Changed $1,290,000 BNYMLS
Property tax history
+6.3%/yrLatest (2024): $19,032 · +19.4% YoY. Source: county tax records.
Cash-flow waterfall
monthlySold comps — $/sqft
last 12 mo · ≤1 miLoading sold comps…