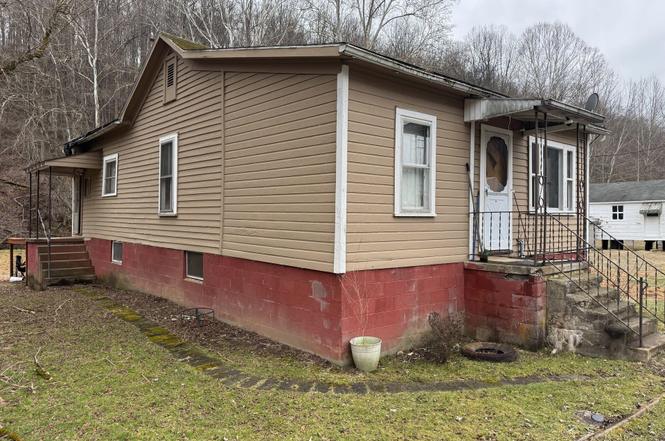
100 Parrish Cir · Wallace, WV
Flood risk 10/10 · Severe
- FEMA flood zone
- AE
- Chance of flooding over 30 yrs
- 0.99%
- Est. flood insurance / yr
- $1,737 – $8,500
Fire risk 3/10 · Minor
- Est. fire insurance / yr
- $787 – $1,461
Heat risk 4/10 · Minor
- Hot days now (above 97°F)
- 7 days/yr
- Hot days in 30 yrs
- 19 days/yr
Wind risk 1/10 · Minimal
- Chance of severe wind over 30 yrs
- 0.0%
Air-quality risk 2/10 · Minimal
- Unhealthy air days now
- 0 days/yr
- Unhealthy air days in 30 yrs
- 1 days/yr
Risk factors via First Street. Map © Google.
Why this score? — see what drove the B grade
The composite is a weighted blend of 9 inputs, each scored 0–100. Each bar is that input's sub-score; the figure is the points it added to the 100-point composite (weight × sub-score).
- Cash flow +30.0/30.0
- 1% rule +10.0/10.0
- DSCR +10.0/10.0
- ARV discount +7.5/15.0
- Appreciation +6.6/10.0
- Schools +3.0/10.0
- Livability +2.8/5.0
- Rent growth +2.5/5.0
- Condition / age +1.0/5.0
$27,500
🖨 Deal sheet (PDF) 📄 Offer letter ✓ Due diligence
Listing remarks
Historic Wallace home on Parrish Circle. 1,008 sq ft, 0.29 acres. Built 1900, charming character details. Cozy 3-bedroom layout , 2 large garages/outbuildings, borders creek
Key facts
- Borders creek
- 2 garage spots
- Built 1900
Tags
Property features AI
Exterior
- Parking: 2-car garage
- Home design: Residential property
- Construction: Block foundation
- Exterior features: Shingle roof
Interior
- Bedrooms: Total of 5 rooms (bedroom count not specified)
- Flooring: Laminate flooring; Vinyl flooring
- Bathrooms: 1 full bathroom
- Heating & cooling: No heating specified; No cooling specified
- Interior features: Laminate counters
Neighborhood map
What this means for you Summary
Snapshot
- This is a 2-bed/1.0-bath single-family listed at $28k. Condition is rated poor.
Deal economics
- At list price, monthly cash flow is $122 ($1k/yr) — positive.
- The deal already cash-flows at list — no discount required.
- Meets the 1% rule at list price ($935 rent vs $28k).
- Recommended offer: $25k (9.0% below list) — sets the bar for market timing.
Location & tenants
- Location reads 55/100 on livability (#278 in WV) — a working-class tenant base; expect higher turnover. Strengths: employment A+, cost of living A+, crime A; Watch: health & safety C-, schools F, amenities F.
- Harrison County Schools (town): math 29% / reading 43% proficiency, ranked #12 of 55 in WV (top 22%) — families likely to look elsewhere, expect single-tenant / working-renter base with shorter leases.
- Market conditions: 4 active listings in the ZIP; 84 units permitted in Harrison County in 2024 (5 in 5+ unit buildings).
Forward outlook
- In year one you build about $1k of equity ($190 loan paydown + $892 appreciation (3.2% local appreciation)).
- Harrison County population projected at -11% by 2050 — secular population decline; favor cash flow + early exit over multi-decade hold.
- At projected returns (3.2% appreciation + 3.0% rent growth), your $8k cash investment doubles in ~3 years — after that, you're playing with house money.
Negotiation context
- It's been on market 106 days — a 9% lower offer ($25k) is reasonable based on typical stale-listing flexibility.
Risks & watch-outs
- Watch-outs: flood insurance adds $427/mo; built in 1900 — expect roof / HVAC / electrical / plumbing capex.
- Climate carrying-cost: in FEMA flood zone AE (mandatory federal flood insurance) — expect insurance premiums to compound above CPI over the hold.
Questions for the listing agent
- It's been on market 106 days. Have you received any prior offers? Is the seller open to a 9% concession, seller financing, or rate buy-down credit?
- Have any recent inspections been done? Can we get a copy of the seller's disclosures and any deferred-maintenance estimates?
- Built in 1900 — when were the roof, HVAC, electrical panel, plumbing, and water heater last replaced?
- What's the actual annual flood-insurance premium (NFIP or private), and is the property in a SFHA with mandatory coverage?
- Why hasn't it sold? Are there any deal-killer items the seller is aware of (foundation, flood, title, zoning, code violations)?
- Is there a deadline driving the sale (1031 exchange, divorce, estate, relocation)? That informs how much negotiation room exists.
- Schools are F-rated, which usually means shorter tenancies and higher turnover. Who's the typical renter profile here, and what's been the actual vacancy rate?
- What's the average days-on-market for RENTAL listings here right now (not sales)? A rising rental-DOM trend means longer vacancies and softer asking-rent achievability than the comps imply.
- What's the recent tenant-quality profile in this submarket — average credit score on applications, eviction rate, late-payment / NSF rate, and stable-employment percentage? A property-management company in the area should have these aggregated.
- How much new for-sale + rental construction is in the pipeline within 1–3 miles? Heavy new supply typically softens prices + rents 12–24 months out; constrained supply supports both.
Investment metrics
- 1% rule
- 3.40% ✓
- Cap rate
- 30.22%
- Cash-on-cash
- 85.44%
- DSCR
- 4.80
- GRM
- 2.5
CMA / ARV
No comps found within radius.
Projected returns pro-forma
3.24% appreciation · 3.0% rent growth · sell at horizon
- IRR
- 26.3%
- Equity multiple
- 2.52×
- Total profit
- $11,699
- Equity at exit
- $12,745
- IRR
- 27.1%
- Equity multiple
- 4.99×
- Total profit
- $30,727
- Equity at exit
- $19,941
Cash invested: $7,700 (down + closing). Projections, not guarantees.
Landlord ↔ Tenant lean methodology
- Overall (STATE)
- 83 Strongly Landlord-Friendly
- State West Virginia
- 83 Strongly Landlord-Friendly · R+22
- County
- — inherits STATE
- City
- — inherits STATE
ZIP-level market 26448
- Home prices YoY
- 2.5%
- Active inventory
- 4
- Price-to-rent
- 2.5×
Monthly cashflow live
- Estimated rent
- $935 medium interval (Pro) →
- Mortgage (P&I)
- −$144
- Tax est. 1.5%
- −$34 /mo · $412/yr
- Insurance
- −$11
- Flood insurance flood zone
- −$427 /mo · $5,118/yr
- HOA
- −$0
- Vacancy / Maint / Mgmt
- −$196
- Net cashflow
- $122
Break-even live
Sensitivity live
| Price | -10% $141 | -5% $131 | +0% $122 | +5% $112 | +10% $103 |
|---|---|---|---|---|---|
| Rent | -10% $48 | -5% $85 | +0% $122 | +5% $159 | +10% $196 |
| Rate | -1.0pp $136 | -0.5pp $129 | base $122 | +0.5pp $115 | +1.0pp $107 |
UW: 25.0% down · 7.5% · 30yr · 1.5% tax · 5.0% vac · 8.0% maint · 8.0% mgmt
Financing live
Cash to close
- Down payment
- $6,875
- Closing costs
- $825
- Reserves months
- —
- Total cash needed
- —
Loan-product check · same deal, 3 products live
Conventional
25% down · 7.5% · 30yr
- Down + closing
- —
- Monthly P&I
- —
- Monthly cashflow
- —
- DSCR
- —
- Eligible?
- —
Personal DTI + credit; lowest rate.
DSCR
20% down · 8.5% · 30yr
- Down + closing
- —
- Monthly P&I
- —
- Monthly cashflow
- —
- DSCR
- —
- Eligible?
- —
No personal income docs; deal must DSCR.
Hard money
10% down · 12.0% · 12mo
- Down + closing
- —
- Monthly P&I
- —
- Monthly cashflow
- —
- DSCR
- —
- Eligible?
- —
Short-term bridge; refi at stabilization.
Listing history 20 events
-
2026-06-21days on market $27,500 Active 106 DOM
-
2026-06-19days on market $27,500 Active 104 DOM
-
2026-06-18days on market $27,500 Active 103 DOM
-
2026-06-17days on market $27,500 Active 102 DOM
-
2026-06-16days on market $27,500 Active 101 DOM
-
2026-06-15days on market $27,500 Active 100 DOM
-
2026-06-14days on market $27,500 Active 98 DOM
-
2026-06-12days on market $27,500 Active 97 DOM
-
2026-06-09days on market $27,500 Active 94 DOM
-
2026-06-08days on market $27,500 Active 93 DOM
-
2026-06-07days on market $27,500 Active 92 DOM
-
2026-06-05days on market $27,500 Active 89 DOM
-
2026-06-03days on market $27,500 Active 88 DOM
-
2026-06-02days on market $27,500 Active 87 DOM
-
2026-06-01days on market $27,500 Active 86 DOM
-
2026-05-31days on market $27,500 Active 85 DOM
-
2026-05-30days on market $27,500 Active 84 DOM
-
2026-04-30price $27,500
-
2026-03-22price $28,900
-
2026-03-07$29,900 Active
ⓘ Source: listings_history table (triggers on properties + properties_extension) + one-shot
backfill from property_details.listing_events for pre-trigger history.
Climate risk First Street
- Flood 10/10 Extreme FEMA zone AE · 99% chance over 30 yrs
- Wildfire 3/10 Moderate
- Heat 4/10 Moderate 7 d/yr ≥97°F today · 19 d/yr by 30 yrs out
- Wind 1/10 Low 0% chance of damaging wind over 30 yrs
- Air quality 2/10 Low 0 unhealthy d/yr today · 1 by 30 yrs out
Nearby sold comps map
Loading sold comps map…
Walkable amenities ~0.75 mi
Loading nearby amenities…
Taxation est. · year 1
- Rental income
- $11,215
- − Mortgage interest
- −$1,540
- − Property taxes
- −$412
- − Insurance
- −$5,256
- − Repairs & maintenance
- −$897
- − Management
- −$897
- − Depreciation
- −$800
- Taxable income
- $1,412
- Est. tax owed @ 24.0%
- −$339
- After-tax cash flow
- $1,122/yr
For passive investors: Depreciation is non-cash, so a rental often shows a tax loss while cash-flowing — sheltering income. Rental losses are passive: they offset passive income freely, and up to $25,000/yr can offset ordinary (W-2) income if you actively participate and your MAGI is under $100k (phasing out to $0 by $150k); unused losses carry forward. On sale, claimed depreciation is recaptured at up to 25%, and gains may owe capital-gains tax (a 1031 exchange can defer both). Figures are a year-1 estimate at your 24.0% rate — not tax advice; consult a CPA.
Condition & rehab AI · 13 photos
This home requires extensive repairs and updates to improve its condition and increase its value. The roof, siding, and exterior walls are in poor condition and need immediate attention. The kitchen and bathroom also require updates to modernize the space and increase its value.
Repairs flagged
- Major roof — visible rust and deterioration
- Major siding — peeling siding
- Major exterior walls — exposed brick
- Major kitchen cabinets — dated and worn
- Major bathroom fixtures — dated and worn
- Major flooring — worn carpet
- Major interior walls — dated paint, peeling
- Major electrical system — exposed wiring
Value-add opportunities
- Resale new roof — new roof would significantly improve the home's curb appeal and value
- Resale exterior siding and paint — new siding and paint would improve the home's curb appeal and value
- Resale kitchen cabinets and countertops — new cabinets and countertops would modernize the kitchen and increase its value
- Resale bathroom fixtures — new fixtures would modernize the bathroom and increase its value
- Resale flooring — new flooring would improve the home's appearance and increase its value
- Resale interior walls and paint — new paint and possibly new walls would modernize the interior and increase its value
- Resale electrical system — new electrical system would improve the home's safety and increase its value
- Both landscaping — new landscaping would improve the home's curb appeal and increase its value
Renovation cost estimate screening
| Repair item | Severity | Est. cost |
|---|---|---|
| roof · visible rust and deterioration | Major | $15,000–50,000 |
| siding · peeling siding | Major | $15,000–50,000 |
| exterior walls · exposed brick | Major | $15,000–50,000 |
| kitchen cabinets · dated and worn | Major | $15,000–50,000 |
| bathroom fixtures · dated and worn | Major | $15,000–50,000 |
| flooring · worn carpet | Major | $15,000–50,000 |
| interior walls · dated paint, peeling | Major | $15,000–50,000 |
| electrical system · exposed wiring | Major | $15,000–50,000 |
| Total estimated repair cost · 8 items | $120,000–400,000 |
Value-add ROI direction
- Resale new roof — new roof would significantly improve the home's curb appeal and value ↑
- Resale exterior siding and paint — new siding and paint would improve the home's curb appeal and value ↑
- Resale kitchen cabinets and countertops — new cabinets and countertops would modernize the kitchen and increase its value ↑
- Resale bathroom fixtures — new fixtures would modernize the bathroom and increase its value ↑
- Resale flooring — new flooring would improve the home's appearance and increase its value ↑
- Resale interior walls and paint — new paint and possibly new walls would modernize the interior and increase its value ↑
- Resale electrical system — new electrical system would improve the home's safety and increase its value ↑
- Both landscaping — new landscaping would improve the home's curb appeal and increase its value ↑
ⓘ Cost ranges are severity-bucket heuristics (US national rule-of-thumb). Get contractor quotes + a written scope before underwriting a rehab budget.
Schools (NCES district)
- District
- Harrison County Schools
- NCES district ID
- 5400510
- Math proficiency
- 29% ▼ -10.00%
- Reading proficiency
- 43% ▼ -3.00%
- Median HH income
- $43,269
- Composite
- 30.48/100
- National rank
- #6222
- State rank
- #12 of 55 in WV
Livability — Wallace
- Score
- 55/100
- State rank
- #278
- US rank
- #23279
Category grades
Schools grade is shown separately in the Schools card above.
Census & demographics
- Census place
- Wallace, WV
- City population
- 1,181
- Population (ZIP)
- 1,181
Population outlook (Harrison County) Hauer SSP2
- Today (2025)
- 67,273 people
- By 2030
- 65,963 · -1.9%
- By 2040
- 63,033 · -6.3%
- By 2050
- 59,999 · -10.8%
- By 2075
- 52,524 · -21.9%
- By 2100
- 42,654 · -36.6%
Race, ethnicity, and origin ACS 2023
- Neighborhood character
- Predominantly White (92%)
- Race & ethnicity
- White 92% Two or more races 7% Hispanic / Latino 3%
- Common ancestry
- Iranian 17% Romanian 9% Lithuanian 1%
- Foreign-born
- 0% · Canada
- Languages at home
- 98% English-only · Spanish 2%
Political lean MEDSL · Harrison
- 2024 margin
- Solid R (+41.0) · D 28.5% · R 69.4% · Other 2.1%
- 2008→2024 swing
- -27.6pp toward R · 2008: -13.3pp · 2024: -41.0pp
- All cycles
- 2024: R+41.0 2020: R+37.6 2016: R+39.5 2012: R+23.5 2008: R+13.3
Not yet ingested
- Civics
- —
Market trends
- HPI YoY
- ▲ 3.24%
- Current HPI
- 130.7467
- Rent YoY
- —
- Metro
- —
- State GDP YoY
- —
- F500 in state
- 0
Price history
-8.0% since first listed3 events — show timeline
- 2026-04-30 Price Changed $27,500 GVBOR
- 2026-03-22 Price Changed $28,900 GVBOR
- 2026-03-07 Listed $29,900 GVBOR
Cash-flow waterfall
monthlySold comps — $/sqft
last 12 mo · ≤1 miLoading sold comps…