190 Forest Glen Dr · Conashaugh Lakes, PA
Flood risk 1/10 · Minimal
- FEMA flood zone
- X (unshaded)
- Chance of flooding over 30 yrs
- 0.0%
- Est. flood insurance / yr
- $507 – $1,088
Fire risk 5/10 · Moderate
- Est. fire insurance / yr
- $511 – $949
Heat risk 2/10 · Minimal
- Hot days now (above 91°F)
- 7 days/yr
- Hot days in 30 yrs
- 15 days/yr
Wind risk 3/10 · Minor
- Chance of severe wind over 30 yrs
- 6.0%
Air-quality risk 2/10 · Minimal
- Unhealthy air days now
- 1 days/yr
- Unhealthy air days in 30 yrs
- 2 days/yr
Risk factors via First Street. Map © Google.
Why this score? — see what drove the C+ grade
The composite is a weighted blend of 9 inputs, each scored 0–100. Each bar is that input's sub-score; the figure is the points it added to the 100-point composite (weight × sub-score).
- Cash flow +30.0/30.0
- 1% rule +10.0/10.0
- DSCR +10.0/10.0
- Schools +4.7/10.0
- Condition / age +4.0/5.0
- Livability +3.5/5.0
- Rent growth +2.5/5.0
- ARV discount +0.0/15.0
- Appreciation +0.0/10.0
$59,900
🖨 Deal sheet 📄 Offer letter ✓ Due diligence
Listing remarks
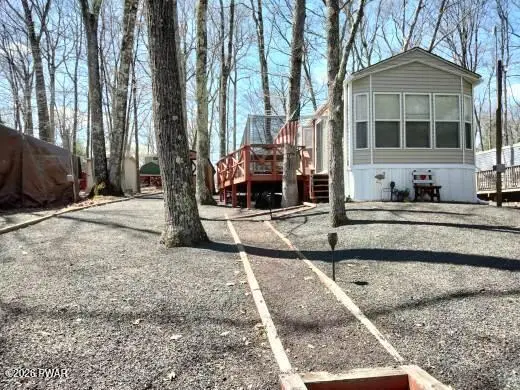
291 FOREST GLEN DR (911 190 FOREST GLEN DR) 1 bedroom park model with a very large soft top screen room, tent platform and shed. The park model has central AC and upgraded flooring. The park model is very well kept and like new. The property has ample parking and is fully graveled with red stone. This property is also considered a two bedroom due to thelong living room that has space for a folding divider allowing for a two sleeper sofas and partitioning of the living room at night. $59,900.00.
Key facts
- Upgraded flooring
- Ample parking
- 4,792 sq ft lot
Tags
Property features AI
Finance
- Financial info: Annual tax amount: $240.91
- HOA & community: Homeowners association present; Annual association fee of $2,800 (about $233.33 per month)
Exterior
- Home design: Residential property marketed as Vacation RV/Trailer
- Construction: Approximately 400 above-grade finished area
- Exterior features: Campsite located in the Lake Adventure subdivision; Directions: From the front gate take the first left onto Forest Glen Dr; proceed through the first stop sign on Forest Glen and find the campsite the 6th campsite after the stop sign on the left
Interior
- Bedrooms: Not specified
- Bathrooms: 1 full bathroom
- Interior features: Total of 4 rooms
Neighborhood map
What this means for you Summary
Snapshot
- This is a 2-bed/1.0-bath single-family listed at $60k. Condition is rated good.
Deal economics
- At list price, monthly cash flow is $633 ($8k/yr) — positive.
- The deal already cash-flows at list — no discount required.
- Meets the 1% rule at list price ($2k rent vs $60k).
- Recommended offer: $59k (1.5% below list) — sets the bar for market timing.
- Cap rate 19.0% vs local median 5.3% in Conashaugh Lakes — top-decile yield for the area; either an underpriced asset or a hidden risk that comps aren't pricing in. Stress-test before assuming the spread holds.
Location & tenants
- Location reads 70/100 on livability (#786 in PA) — a middle-class / working-renter tenant base. Strengths: crime A+, employment A+, housing A+; Watch: health & safety D, amenities F, commute F.
- Delaware Valley SD (rural): math 41% / reading 66% proficiency, ranked #121 of 539 in PA (top 22%) — acceptable for families but not a draw, mixed tenant base, ~2y average lease.
- Market conditions: 290 active listings in the ZIP; solid renter incomes; 213 units permitted in Pike County in 2024 (0 in 5+ unit buildings).
Forward outlook
- Local home prices are declining (-3.0%/yr); year-one equity from $414 of loan paydown is wiped out by about $2k of value loss. Plan a longer hold.
- Pike County population projected at -25% by 2050 — secular population decline; favor cash flow + early exit over multi-decade hold.
- At projected returns (-3.0% appreciation + 3.0% rent growth), your $17k cash investment doubles in ~3 years — after that, you're playing with house money.
Negotiation context
- It's been on market 27 days — a 2% lower offer ($59k) is reasonable based on typical stale-listing flexibility.
Risks & watch-outs
- Climate carrying-cost: moderate wildfire risk — expect insurance premiums to compound above CPI over the hold.
Questions for the listing agent
- What does the HOA fee cover, when was the last increase, and are there any pending special assessments or reserve-fund shortfalls?
- Is there a deadline driving the sale (1031 exchange, divorce, estate, relocation)? That informs how much negotiation room exists.
- What's the average days-on-market for RENTAL listings here right now (not sales)? A rising rental-DOM trend means longer vacancies and softer asking-rent achievability than the comps imply.
- What's the recent tenant-quality profile in this submarket — average credit score on applications, eviction rate, late-payment / NSF rate, and stable-employment percentage? A property-management company in the area should have these aggregated.
- How much new for-sale + rental construction is in the pipeline within 1–3 miles? Heavy new supply typically softens prices + rents 12–24 months out; constrained supply supports both.
Investment metrics
- 1% rule
- 2.70% ✓
- Cap rate
- 18.98%
- Cash-on-cash
- 45.29%
- DSCR
- 3.02
- GRM
- 3.1
CMA / ARV
- ARV (on-the-fly)
- $40,000
- Comps found
- 12
Show comp detail 12 sales within ~0.75 mi
| Address | Dist | Beds/Ba | Sqft | Sold | Price | $/sf | Match |
|---|---|---|---|---|---|---|---|
| 120 Crescent Dr | 0.07mi | 2/1.0 | 392 (-2%) | 8mo | $37,000 | $94 | 87 |
| 154 Village Dr W | 0.20mi | 2/1.0 | 400 (0%) | 10mo | $40,000 | $100 | 82 |
| 120 Forest Glen Dr | 0.31mi | 3/1.0 (+1) | 400 (0%) | 0mo | $40,000 | $100 | 80 |
| 114 Glenwood Landing Lndg | 0.35mi | 2/1.0 | 407 (+2%) | 3mo | $36,457 | $90 | 79 |
| 140 Blue Aspen Dr | 0.07mi | 2/1.0 | 350 (-12%) | 9mo | $24,000 | $69 | 68 |
| 102 Lake Dr N #1772 | 0.47mi | 2/1.0 | 385 (-4%) | 8mo | $91,500 | $238 | 65 |
| 126 Deer Run | 0.66mi | 2/1.0 | 400 (0%) | 10mo | $109,000 | $273 | 61 |
| 131 Bobcat Dr | 0.67mi | 1/1.0 (-1) | 399 (-0%) | 4mo | $84,000 | $211 | 60 |
| 104 Glenwood Lndg | 0.38mi | 1/1.0 (-1) | 340 (-15%) | 0mo | $11,000 | $32 | 52 |
| 216 Village Dr W | 0.46mi | 2/1.0 | 345 (-14%) | 6mo | $62,000 | $180 | 50 |
| 121 Birchy Brook Dr | 0.67mi | 2/1.0 | 340 (-15%) | 3mo | $36,000 | $106 | 42 |
| 109 Bobcat Dr | 0.58mi | 1/1.0 (-1) | 450 (+12%) | 11mo | $38,500 | $86 | 38 |
Match score weights: distance 35% · size 25% · config 20% · recency 20%. Top-matched comps best support the ARV.
Projected returns pro-forma
-3.0% appreciation · 3.0% rent growth · sell at horizon
- IRR
- 42.5%
- Equity multiple
- 2.84×
- Total profit
- $30,781
- Equity at exit
- $8,931
- IRR
- 48.7%
- Equity multiple
- 5.73×
- Total profit
- $79,402
- Equity at exit
- $5,179
Cash invested: $16,772 (down + closing). Projections, not guarantees.
Landlord ↔ Tenant lean methodology
- Overall (STATE)
- 62 Landlord-Friendly
- State Pennsylvania
- 62 Landlord-Friendly · EVEN
- County
- — inherits STATE
- City
- — inherits STATE
ZIP-level market 18337
- Home prices YoY
- -22.0%
- Active inventory
- 290
- Price-to-rent
- 3.1×
Monthly cashflow live
- Estimated rent
- $1,620 medium interval (Pro) →
- Mortgage (P&I)
- −$314
- Tax est. 1.5%
- −$75 /mo · $898/yr
- Insurance
- −$25
- HOA
- −$233
- Vacancy / Maint / Mgmt
- −$340
- Net cashflow
- $633
Break-even live
UW: 25.0% down · 7.5% · 30yr · 1.5% tax · 5.0% vac · 8.0% maint · 8.0% mgmt
Financing live
Cash to close
- Down payment
- $14,975
- Closing costs
- $1,797
- Reserves months
- —
- Total cash needed
- —
Loan-product check · same deal, 3 products live
Conventional
25% down · 7.5% · 30yr
- Down + closing
- —
- Monthly P&I
- —
- Monthly cashflow
- —
- DSCR
- —
- Eligible?
- —
Personal DTI + credit; lowest rate.
DSCR
20% down · 8.5% · 30yr
- Down + closing
- —
- Monthly P&I
- —
- Monthly cashflow
- —
- DSCR
- —
- Eligible?
- —
No personal income docs; deal must DSCR.
Hard money
10% down · 12.0% · 12mo
- Down + closing
- —
- Monthly P&I
- —
- Monthly cashflow
- —
- DSCR
- —
- Eligible?
- —
Short-term bridge; refi at stabilization.
HOA detail
- Monthly dues
- $233 · $2,796/yr
Listing history 15 events
-
2026-06-18days on market $59,900 Active 27 DOM
-
2026-06-17days on market $59,900 Active 26 DOM
-
2026-06-16days on market $59,900 Active 25 DOM
-
2026-06-15days on market $59,900 Active 24 DOM
-
2026-06-13days on market $59,900 Active 22 DOM
-
2026-06-13days on market $59,900 Active 21 DOM
-
2026-06-09days on market $59,900 Active 18 DOM
-
2026-06-08days on market $59,900 Active 17 DOM
-
2026-06-07days on market $59,900 Active 16 DOM
-
2026-06-04days on market $59,900 Active 13 DOM
-
2026-06-03days on market $59,900 Active 12 DOM
-
2026-06-02days on market $59,900 Active 11 DOM
-
2026-06-01days on market $59,900 Active 10 DOM
-
2026-05-31days on market $59,900 Active 9 DOM
-
2026-05-22$59,900 Active
ⓘ Source: listings_history table (triggers on properties + properties_extension) + one-shot
backfill from property_details.listing_events for pre-trigger history.
Climate risk First Street
- Flood 1/10 Low FEMA zone X (unshaded) · 0% chance over 30 yrs
- Wildfire 5/10 Major
- Heat 2/10 Low 7 d/yr ≥91°F today · 15 d/yr by 30 yrs out
- Wind 3/10 Moderate 6% chance of damaging wind over 30 yrs
- Air quality 2/10 Low 1 unhealthy d/yr today · 2 by 30 yrs out
Nearby sold comps map
Loading sold comps map…
Walkable amenities ~0.75 mi
Loading nearby amenities…
Taxation est. · year 1
- Rental income
- $19,443
- − Mortgage interest
- −$3,355
- − Property taxes
- −$898
- − Insurance
- −$300
- − Repairs & maintenance
- −$1,555
- − Management
- −$1,555
- − HOA
- −$2,796
- − Depreciation
- −$1,743
- Taxable income
- $7,240
- Est. tax owed @ 24.0%
- −$1,738
- After-tax cash flow
- $5,859/yr
For passive investors: Depreciation is non-cash, so a rental often shows a tax loss while cash-flowing — sheltering income. Rental losses are passive: they offset passive income freely, and up to $25,000/yr can offset ordinary (W-2) income if you actively participate and your MAGI is under $100k (phasing out to $0 by $150k); unused losses carry forward. On sale, claimed depreciation is recaptured at up to 25%, and gains may owe capital-gains tax (a 1031 exchange can defer both). Figures are a year-1 estimate at your 24.0% rate — not tax advice; consult a CPA.
Condition & rehab AI · 17 photos
This park model is in good condition with cosmetic updates needed to enhance its curb appeal and value. Fresh paint and new siding would significantly improve its appearance.
Repairs flagged
- Minor Exterior siding — Weathered appearance
- Minor Interior walls/paint — Faded paint
Value-add opportunities
- Resale Paint interior walls — Fresh paint enhances curb appeal and interior aesthetics.
- Resale Replace exterior siding — New siding improves curb appeal and durability.
- Both Landscaping — Landscaping enhances curb appeal and adds value for both resale and rental
Renovation cost estimate screening
| Repair item | Severity | Est. cost |
|---|---|---|
| Exterior siding · Weathered appearance | Minor | $500–3,000 |
| Interior walls/paint · Faded paint | Minor | $500–3,000 |
| Total estimated repair cost · 2 items | $1,000–6,000 |
Value-add ROI direction
- Resale Paint interior walls — Fresh paint enhances curb appeal and interior aesthetics. ↑
- Resale Replace exterior siding — New siding improves curb appeal and durability. ↑
- Both Landscaping — Landscaping enhances curb appeal and adds value for both resale and rental ↑
ⓘ Cost ranges are severity-bucket heuristics (US national rule-of-thumb). Get contractor quotes + a written scope before underwriting a rehab budget.
Schools (NCES district)
- District
- Delaware Valley SD
- NCES district ID
- 4207530
- Math proficiency
- 41% ▼ -12.00%
- Reading proficiency
- 66% ▼ -9.00%
- Median HH income
- $64,202
- Composite
- 46.95/100
- National rank
- #2359
- State rank
- #121 of 539 in PA
Livability — Conashaugh Lakes
- Score
- 70/100
- State rank
- #786
- US rank
- #7924
Category grades
Schools grade is shown separately in the Schools card above.
Census & demographics
- County
- Pike County · 15,799 people
- Metro
- New York-Newark-Jersey City, NY-NJ-PA
- Population (ZIP)
- 15,799
- Household income
- $93,149
- Rent vs Own
- Severe rent burden
- 275.0
Population outlook (Pike County) Hauer SSP2
- Today (2025)
- 53,548 people
- By 2030
- 51,622 · -3.6%
- By 2040
- 46,490 · -13.2%
- By 2050
- 40,372 · -24.6%
- By 2075
- 31,951 · -40.3%
- By 2100
- 26,821 · -49.9%
Race, ethnicity, and origin ACS 2023
- Neighborhood character
- Predominantly White (82%)
- Race & ethnicity
- White 82% Hispanic / Latino 10% Two or more races 7% Black 4% Asian 2%
- Hispanic origin (detail)
- Mexican 1% Puerto Rican 4% Cuban 1%
- Common ancestry
- Romanian 6% Iranian 2% Portuguese 2%
- Foreign-born
- 6% · Canada, China, South Korea
- Languages at home
- 89% English-only · Spanish 6% Russian/Polish/Slavic 2% German/W. Germanic 1%
Political lean MEDSL · Pike
- 2024 margin
- Strong R (+24.1) · D 37.6% · R 61.6%
- 2008→2024 swing
- -19.8pp toward R · 2008: -4.2pp · 2024: -24.1pp
- All cycles
- 2024: R+24.1 2020: R+19.0 2016: R+26.0 2012: R+11.0 2008: R+4.2
Not yet ingested
- Civics
- —
Market trends
- HPI YoY
- ▼ -54.81%
- Current HPI
- 194.0604
- Rent YoY
- —
- Metro
- New York-Newark-Jersey City, NY-NJ-PA
- State GDP YoY
- ▲ 1.68%
- F500 in state
- 34
Industry mix (Fortune 500 HQ in PA)
| Industry | F500 HQs | Revenue |
|---|---|---|
| Healthcare | 2 | $309B |
|
||
| Insurance | 2 | $27B |
|
||
| Telecommunications / Media | 1 | $124B |
|
||
| Industrial Distribution | 1 | $22B |
|
||
| Financial Services | 1 | $20B |
|
||
| Chemicals / Materials | 1 | $18B |
|
||
Price history
1 event — show timeline
- 2026-05-22 Listed $59,900 PWMLS
Cash-flow waterfall
monthlySold comps — $/sqft
last 12 mo · ≤1 miLoading sold comps…