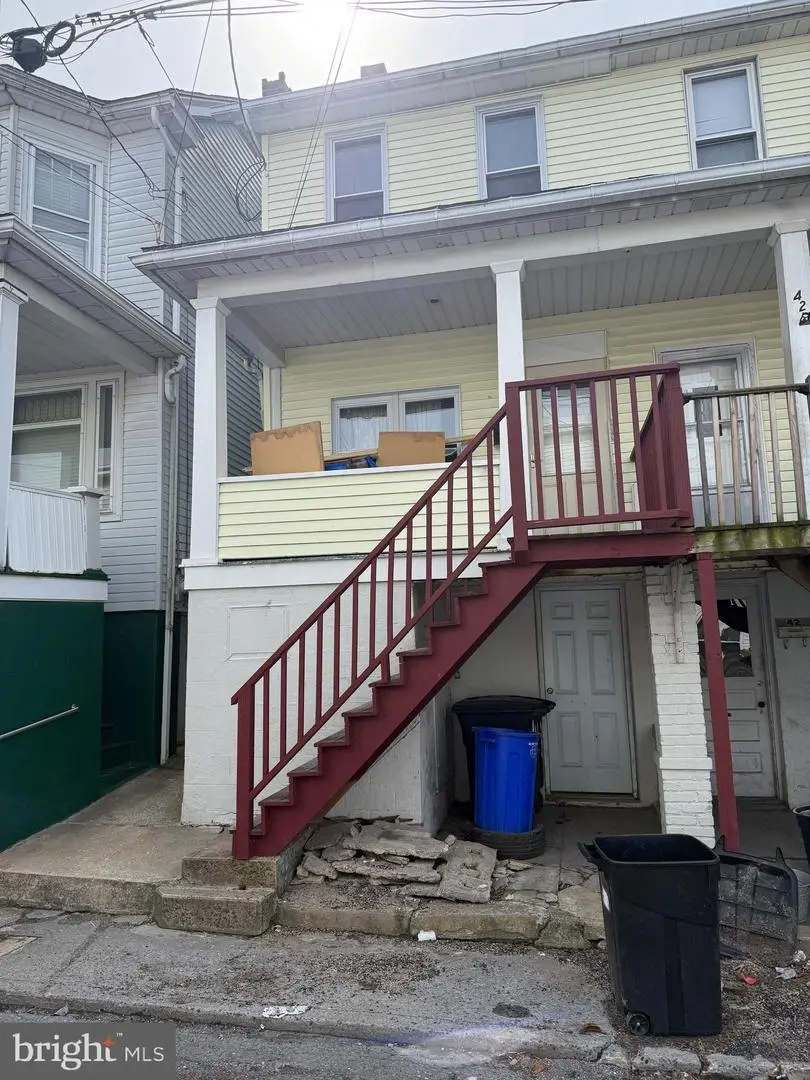
44 E Water St · Lansford, PA
Flood risk 3/10 · Minor
- FEMA flood zone
- X (unshaded)
- Chance of flooding over 30 yrs
- 0.2%
- Est. flood insurance / yr
- $507 – $1,088
Fire risk 3/10 · Minor
- Est. fire insurance / yr
- $511 – $949
Heat risk 3/10 · Minor
- Hot days now (above 94°F)
- 7 days/yr
- Hot days in 30 yrs
- 15 days/yr
Wind risk 4/10 · Minor
- Chance of severe wind over 30 yrs
- 8.0%
Air-quality risk 2/10 · Minimal
- Unhealthy air days now
- 1 days/yr
- Unhealthy air days in 30 yrs
- 3 days/yr
Risk factors via First Street. Map © Google.
Why this score? — see what drove the A grade
The composite is a weighted blend of 9 inputs, each scored 0–100. Each bar is that input's sub-score; the figure is the points it added to the 100-point composite (weight × sub-score).
- Cash flow +30.0/30.0
- ARV discount +15.0/15.0
- 1% rule +10.0/10.0
- DSCR +10.0/10.0
- Appreciation +9.6/10.0
- Livability +3.6/5.0
- Rent growth +2.5/5.0
- Condition / age +2.5/5.0
- Schools +2.0/10.0
$60,000
🖨 Deal sheet 📄 Offer letter ✓ Due diligence
Listing remarks MLS
Do not miss the chance to finish the renovation of this affordable twin in Lansford. There has been a partial renovation of the kitchen and bath and is just waiting the finishing touches. A new electric service has been installed. The home is a three bedroom and one bath. The basement is walkout to street level. Schedule today!!
Key facts
- New electric service
- Walkout basement
- Built 1927
Tags
Neighborhood map
What this means for you Summary
Snapshot
- This is a 3-bed/1.0-bath townhouse listed at $60k.
Deal economics
- At list price, monthly cash flow is $448 ($5k/yr) — positive.
- The deal already cash-flows at list — no discount required.
- Meets the 1% rule at list price ($1k rent vs $60k).
- Recommended offer: $56k (6.0% below list) — sets the bar for market timing.
- Cap rate 15.2% vs local median 9.5% in Lansford — top-decile yield for the area; either an underpriced asset or a hidden risk that comps aren't pricing in. Stress-test before assuming the spread holds.
Location & tenants
- Location reads 72/100 on livability (#605 in PA) — a middle-class / working-renter tenant base. Strengths: cost of living A+, health & safety A+, crime A-; Watch: amenities D, schools F, commute F.
- Panther Valley SD (rural): math 14% / reading 35% proficiency, ranked #477 of 539 in PA (top 88%) — low school quality limits family demand, transient renter base, plan for 1-2y turnover.
- Market conditions: 34 active listings in the ZIP; 17 comparable units currently listed for rent nearby; rentals at typical pace (median 19d on market — plan ~3-4 weeks tenant-placement turnaround); lower-income renter base — watch delinquency; 180 units permitted in Carbon County in 2024 (10 in 5+ unit buildings).
- This rent runs 31% of the median local income ($45k/yr) — at the standard rent-burdened threshold; future hikes will face affordability resistance.
Forward outlook
- In year one you build about $6k of equity ($415 loan paydown + $5k appreciation (9.1% local appreciation)).
- Carbon County population projected at -18% by 2050 — secular population decline; favor cash flow + early exit over multi-decade hold.
- At projected returns (9.1% appreciation + 3.0% rent growth), your $17k cash investment doubles in ~2 years — after that, you're playing with house money.
- By year 6, paydown + projected appreciation supports a ~$34k cash-out refi (75% LTV) — recoverable capital for the next deal without selling this one.
Negotiation context
- It's been on market 90 days — a 6% lower offer ($56k) is reasonable based on typical stale-listing flexibility.
- 14 sale attempts since 23y ago with the ask held roughly flat each time — persistent listings suggest the price (not the market) is what's stuck; bring a comps-based counter.
- Current owner paid $35k; list at $60k implies a 71% gain — meaningful room to come down on a strong offer.
Risks & watch-outs
- Watch-outs: built in 1927 — expect roof / HVAC / electrical / plumbing capex.
Questions for the listing agent
- It's been on market 90 days. Have you received any prior offers? Is the seller open to a 6% concession, seller financing, or rate buy-down credit?
- Built in 1927 — when were the roof, HVAC, electrical panel, plumbing, and water heater last replaced?
- Why hasn't it sold? Are there any deal-killer items the seller is aware of (foundation, flood, title, zoning, code violations)?
- Is there a deadline driving the sale (1031 exchange, divorce, estate, relocation)? That informs how much negotiation room exists.
- Schools are F-rated, which usually means shorter tenancies and higher turnover. Who's the typical renter profile here, and what's been the actual vacancy rate?
- What's the average days-on-market for RENTAL listings here right now (not sales)? A rising rental-DOM trend means longer vacancies and softer asking-rent achievability than the comps imply.
- What's the recent tenant-quality profile in this submarket — average credit score on applications, eviction rate, late-payment / NSF rate, and stable-employment percentage? A property-management company in the area should have these aggregated.
- How much new for-sale + rental construction is in the pipeline within 1–3 miles? Heavy new supply typically softens prices + rents 12–24 months out; constrained supply supports both.
Investment metrics
- 1% rule
- 1.91% ✓
- Cap rate
- 15.25%
- Cash-on-cash
- 31.98%
- DSCR
- 2.42
- GRM
- 4.4
CMA / ARV
- ARV (median comp)
- $94,106
- List price
- $60,000
- Delta
- -36.24%
- Verdict
- UNDERPRICED
- Comps
- 20 within 1.0 mi
Show comp detail 12 sales within ~0.75 mi
| Address | Dist | Beds/Ba | Sqft | Sold | Price | $/sf | Match |
|---|---|---|---|---|---|---|---|
| 260 E Abbott St | 0.21mi | 3/1.0 | 1,253 (+2%) | 4mo | $62,000 | $49 | 83 |
| 217 E Ridge St | 0.24mi | 3/1.0 | 1,170 (-5%) | 2mo | $145,000 | $124 | 79 |
| 120 W Abbott St | 0.21mi | 3/1.0 | 1,287 (+5%) | 7mo | $120,000 | $93 | 76 |
| 31 Powell St | 0.32mi | 3/1.0 | 1,170 (-5%) | 5mo | $120,000 | $103 | 73 |
| 45 Jones St | 0.43mi | 3/1.5 | 1,296 (+6%) | 1mo | $62,000 | $48 | 67 |
| 359 W Patterson St | 0.55mi | 3/1.0 | 1,193 (-3%) | 7mo | $70,000 | $59 | 64 |
| 253 E Abbott | 0.22mi | 3/2.0 | 1,370 (+12%) | 4mo | $165,000 | $120 | 64 |
| 306 W Kline Ave | 0.40mi | 4/1.5 (+1) | 1,312 (+7%) | 4mo | $115,000 | $88 | 59 |
| 34 W Walter St | 0.75mi | 3/1.0 | 1,244 (+1%) | 7mo | $59,900 | $48 | 57 |
| 109 S Chestnut St | 0.72mi | 3/1.0 | 1,200 (-2%) | 8mo | $80,000 | $67 | 56 |
| 126 W White St | 0.50mi | 3/1.0 | 1,344 (+9%) | 6mo | $115,000 | $86 | 56 |
| 138 E Fell St | 0.67mi | 3/1.0 | 1,312 (+7%) | 6mo | $125,000 | $95 | 52 |
Match score weights: distance 35% · size 25% · config 20% · recency 20%. Top-matched comps best support the ARV.
Projected returns pro-forma
9.12% appreciation · 3.0% rent growth · sell at horizon
- IRR
- 47.4%
- Equity multiple
- 4.43×
- Total profit
- $57,646
- Equity at exit
- $50,233
- IRR
- 41.8%
- Equity multiple
- 9.73×
- Total profit
- $146,662
- Equity at exit
- $104,506
Cash invested: $16,800 (down + closing). Projections, not guarantees.
Landlord ↔ Tenant lean methodology
- Overall (STATE)
- 62 Landlord-Friendly
- State Pennsylvania
- 62 Landlord-Friendly · EVEN
- County
- — inherits STATE
- City
- — inherits STATE
ZIP-level market 18232
- Home prices YoY
- 3.6%
- Active inventory
- 34
- Price-to-rent
- 4.4×
Monthly cashflow live
- Estimated rent
- $1,149 high interval (Pro) →
- Mortgage (P&I)
- −$315
- Tax from tax record
- −$120 /mo · $1,441/yr
- Insurance
- −$25
- HOA
- −$0
- Vacancy / Maint / Mgmt
- −$241
- Net cashflow
- $448
Break-even live
UW: 25.0% down · 7.5% · 30yr · 1.5% tax · 5.0% vac · 8.0% maint · 8.0% mgmt
Financing live
Cash to close
- Down payment
- $15,000
- Closing costs
- $1,800
- Reserves months
- —
- Total cash needed
- —
Loan-product check · same deal, 3 products live
Conventional
25% down · 7.5% · 30yr
- Down + closing
- —
- Monthly P&I
- —
- Monthly cashflow
- —
- DSCR
- —
- Eligible?
- —
Personal DTI + credit; lowest rate.
DSCR
20% down · 8.5% · 30yr
- Down + closing
- —
- Monthly P&I
- —
- Monthly cashflow
- —
- DSCR
- —
- Eligible?
- —
No personal income docs; deal must DSCR.
Hard money
10% down · 12.0% · 12mo
- Down + closing
- —
- Monthly P&I
- —
- Monthly cashflow
- —
- DSCR
- —
- Eligible?
- —
Short-term bridge; refi at stabilization.
Rent comps 17 comps
| Address | Beds | Baths | Sqft | Rent | $/sqft | DOM | Units | Dist |
|---|---|---|---|---|---|---|---|---|
| 201 E Kline Ave Apt 3 Lansford, PA | 2.0 | 1.0 | 850 | $800 | $0.94 | 2d | 1 | 0.11mi |
| 4 Spring Garden St Apt 2 Lansford, PA | 2.0 | 1.0 | 850 | $875 | $1.03 | 14d | 1 | 0.16mi |
| 233 E Ridge St Lansford, PA | 2.0 | 1.0 | 850 | $900 | $1.06 | 14d | 1 | 0.24mi |
| 323 E Bertsch St Unit A-1 Lansford, PA | 2.0 | 1.0 | 1250 | $1,450 | $1.16 | 43d | 1 | 0.29mi |
| 149 W Ridge St Unit 2b Lansford, PA | 2.0 | 1.0 | 875 | $1,325 | $1.51 | 23d | 1 | 0.33mi |
| 149 W Ridge St Unit 1A Lansford, PA | 2.0 | 1.0 | 930 | $1,350 | $1.45 | 23d | 1 | 0.33mi |
| 546 E Kline Ave Lansford, PA | 3.0 | 1.0 | 1000 | $900 | $0.90 | 2d | 1 | 0.49mi |
| 10 Leisenring St Lansford, PA | 3.0 | 1.0 | 1422 | $1,100 | $0.77 | 43d | 1 | 0.51mi |
| 214 N Oak St Unit 2 Summit Hill, PA | 3.0 | 1.0 | 940 | $1,250 | $1.33 | 19d | 1 | 0.63mi |
| 214 N Oak St Unit 2 Summit Hill, PA | 3.0 | 1.0 | 940 | $1,250 | $1.33 | 43d | 1 | 0.63mi |
| 214 N Oak St Unit 2 Summit Hill, PA | 3.0 | 1.0 | 940 | $1,200 | $1.28 | 2d | 1 | 0.63mi |
| 214 N Oak St Summit Hill, PA | 3.0 | 1.0 | 940 | $1,250 | $1.33 | 2d | 1 | 0.63mi |
| 242 E Holland St Summit Hill, PA | 2.0 | 1.0 | 806 | $1,100 | $1.36 | 2d | 1 | 0.87mi |
| 215 E High St Coaldale, PA | 3.0 | 1.0 | 1000 | $1,000 | $1.00 | 21d | 1 | 1.17mi |
| 151 E High St Coaldale, PA | 3.0 | 1.0 | 1312 | $1,200 | $0.91 | 43d | 1 | 1.21mi |
| 126 E High St Coaldale, PA | 4.0 | 1.5 | 1000 | $1,200 | $1.20 | 14d | 1 | 1.25mi |
| 7 E Phillips St Coaldale, PA | 2.0 | 1.0 | 950 | $1,050 | $1.11 | 23d | 1 | 1.39mi |
Listing history 47 events
-
2026-06-18days on market $60,000 Active 90 DOM
-
2026-06-17days on market $60,000 Active 89 DOM
-
2026-06-16days on market $60,000 Active 88 DOM
-
2026-06-15days on market $60,000 Active 87 DOM
-
2026-06-14days on market $60,000 Active 85 DOM
-
2026-06-13days on market $60,000 Active 84 DOM
-
2026-06-10days on market $60,000 Active 82 DOM
-
2026-06-09days on market $60,000 Active 81 DOM
-
2026-06-08days on market $60,000 Active 80 DOM
-
2026-06-07days on market $60,000 Active 79 DOM
-
2026-06-05days on market $60,000 Active 76 DOM
-
2026-06-03days on market $60,000 Active 75 DOM
-
2026-06-02days on market $60,000 Active 74 DOM
-
2026-06-01days on market $60,000 Active 73 DOM
-
2026-05-31days on market $60,000 Active 72 DOM
-
2026-05-31days on market $60,000 Active 71 DOM
-
2026-03-20$60,000 Active 330-char remark
Show marketing remark (330 chars)
Do not miss the chance to finish the renovation of this affordable twin in Lansford. There has been a partial renovation of the kitchen and bath and is just waiting the finishing touches. A new electric service has been installed. The home is a three bedroom and one bath. The basement is walkout to street level. Schedule today!!
-
2025-11-15historical
-
2023-09-21soldstatus $35,000
-
2023-09-20soldstatus $35,000 Closed
-
2023-09-20soldstatus $35,000 Sold
-
2023-09-08status Pending
-
2023-09-08status Pending
-
2023-09-06price $38,000
-
2023-09-06price $38,000
-
2023-05-31status Active
-
2023-05-31status Active
-
2023-05-23status Pending
-
2023-05-23status Pending
-
2023-05-04$42,000 Active
-
2023-05-04$42,000 Active
-
2022-04-18historical
-
2022-03-28soldstatus $25,000
-
2021-11-16$34,900
-
2019-04-01$9,500
-
2013-03-19$22,900
-
2013-03-19historical
-
2006-02-27soldstatus $20,000
-
2006-02-27soldstatus $20,000
-
2006-02-27soldstatus $20,000
-
2005-11-08$29,900
-
2005-10-05$29,900
-
2004-08-11$27,900
-
2004-08-11$27,900
-
2004-02-06soldstatus $22,000
-
2003-09-29$27,000
ⓘ Source: listings_history table (triggers on properties + properties_extension) + one-shot
backfill from property_details.listing_events for pre-trigger history.
Tax reassessment forecast PA · Partial reset (capped growth)
- Current annual tax
- $1,441 · $120/mo
- Projected year-2 tax
- $1,441 · $120/mo
- Expected delta
- $0/yr ($0/mo · 0.0%)
ⓘ Screening estimate from a state-policy table — verify with the county assessor before closing.
Climate risk First Street
- Flood 3/10 Moderate FEMA zone X (unshaded) · 20% chance over 30 yrs
- Wildfire 3/10 Moderate
- Heat 3/10 Moderate 7 d/yr ≥94°F today · 15 d/yr by 30 yrs out
- Wind 4/10 Moderate 8% chance of damaging wind over 30 yrs
- Air quality 2/10 Low 1 unhealthy d/yr today · 3 by 30 yrs out
Nearby sold comps map
Loading sold comps map…
Walkable amenities ~0.75 mi
Loading nearby amenities…
Taxation est. · year 1
- Rental income
- $13,784
- − Mortgage interest
- −$3,361
- − Property taxes
- −$1,441
- − Insurance
- −$300
- − Repairs & maintenance
- −$1,103
- − Management
- −$1,103
- − Depreciation
- −$1,745
- Taxable income
- $4,731
- Est. tax owed @ 24.0%
- −$1,135
- After-tax cash flow
- $4,237/yr
For passive investors: Depreciation is non-cash, so a rental often shows a tax loss while cash-flowing — sheltering income. Rental losses are passive: they offset passive income freely, and up to $25,000/yr can offset ordinary (W-2) income if you actively participate and your MAGI is under $100k (phasing out to $0 by $150k); unused losses carry forward. On sale, claimed depreciation is recaptured at up to 25%, and gains may owe capital-gains tax (a 1031 exchange can defer both). Figures are a year-1 estimate at your 24.0% rate — not tax advice; consult a CPA.
Schools (NCES district)
- District
- Panther Valley SD
- NCES district ID
- 4218450
- Math proficiency
- 14% ▼ -7.00%
- Reading proficiency
- 35% ▼ -14.00%
- Median HH income
- $36,914
- Composite
- 20.31/100
- National rank
- #8613
- State rank
- #477 of 539 in PA
Livability — Lansford
- Score
- 72/100
- State rank
- #605
- US rank
- #5834
Category grades
Schools grade is shown separately in the Schools card above.
Census & demographics
- Census place
- Lansford, PA
- County
- Carbon County · 13,404 people
- City population
- 4,156
- Metro
- Allentown-Bethlehem-Easton, PA-NJ
- Population (ZIP)
- 4,156
- Household income
- $44,713
- Rent vs Own
- Severe rent burden
- 123.0
Population outlook (Carbon County) Hauer SSP2
- Today (2025)
- 61,643 people
- By 2030
- 59,840 · -2.9%
- By 2040
- 55,413 · -10.1%
- By 2050
- 50,843 · -17.5%
- By 2075
- 43,326 · -29.7%
- By 2100
- 37,126 · -39.8%
Race, ethnicity, and origin ACS 2023
- Neighborhood character
- Diverse neighborhood (Simpson 0.55)
- Race & ethnicity
- White 64% Hispanic / Latino 17% Black 11% Two or more races 11% Native American 4%
- Hispanic origin (detail)
- Puerto Rican 5%
- Common ancestry
- Romanian 4% Polish 2% Iranian 2%
- Foreign-born
- 7% · Canada, Jamaica, South Korea
- Languages at home
- 89% English-only · Spanish 10%
Political lean MEDSL · Carbon
- 2024 margin
- Solid R (+34.8) · D 32.2% · R 67.0%
- 2008→2024 swing
- -36.7pp toward R · 2008: 1.9pp · 2024: -34.8pp
- All cycles
- 2024: R+34.8 2020: R+32.0 2016: R+34.1 2012: R+6.9 2008: D+1.9
Not yet ingested
- Civics
- —
Market trends
- HPI YoY
- ▲ 9.12%
- Current HPI
- 262.3396
- Rent YoY
- —
- Metro
- Allentown-Bethlehem-Easton, PA-NJ
- State GDP YoY
- ▲ 1.68%
- F500 in state
- 34
Industry mix (Fortune 500 HQ in PA)
| Industry | F500 HQs | Revenue |
|---|---|---|
| Healthcare | 2 | $309B |
|
||
| Insurance | 2 | $27B |
|
||
| Telecommunications / Media | 1 | $124B |
|
||
| Industrial Distribution | 1 | $22B |
|
||
| Financial Services | 1 | $20B |
|
||
| Chemicals / Materials | 1 | $18B |
|
||
Price history
+122.2% since first listed31 events — show timeline
- 2026-03-20 Listed $60,000 BRIGHT MLS
- 2026-03-20 Listed $60,000 GLVRMLS
- 2025-11-15 Listing Removed — GLVRMLS
- 2023-09-21 Sold (Public Records) $35,000 Public Records
- 2023-09-20 Sold (MLS) $35,000 GLVRMLS
- 2023-09-20 Sold (MLS) $35,000 BRIGHT MLS
- 2023-09-08 Pending — GLVRMLS
- 2023-09-08 Pending — BRIGHT MLS
- 2023-09-06 Price Changed $38,000 GLVRMLS
- 2023-09-06 Price Changed $38,000 BRIGHT MLS
- 2023-05-31 Relisted — BRIGHT MLS
- 2023-05-31 Relisted — GLVRMLS
- 2023-05-23 Pending — BRIGHT MLS
- 2023-05-23 Pending — GLVRMLS
- 2023-05-04 Listed $42,000 GLVRMLS
- 2023-05-04 Listed $42,000 BRIGHT MLS
- 2022-04-18 Listing Removed — GLVRMLS
- 2022-03-28 Sold (Public Records) $25,000 Public Records
- 2021-11-16 Listed $34,900 LCAR
- 2019-04-01 Listed $9,500 GLVRMLS
- 2013-03-19 Listing Removed — BRIGHT MLS
- 2013-03-19 Listed $22,900 BRIGHT MLS
- 2006-02-27 Sold (Public Records) $20,000 Public Records
- 2006-02-27 Sold (MLS) $20,000 PMAR
- 2006-02-27 Sold (MLS) $20,000 GLVRMLS
- 2005-11-08 Listed $29,900 PMAR
- 2005-10-05 Listed $29,900 GLVRMLS
- 2004-08-11 Listed $27,900 PMAR
- 2004-08-11 Listed $27,900 GLVRMLS
- 2004-02-06 Sold (MLS) $22,000 GLVRMLS
- 2003-09-29 Listed $27,000 GLVRMLS
Property tax history
+1.5%/yrLatest (2026): $1,441 · +2.4% YoY. Source: county tax records.
Cash-flow waterfall
monthlySold comps — $/sqft
last 12 mo · ≤1 miLoading sold comps…