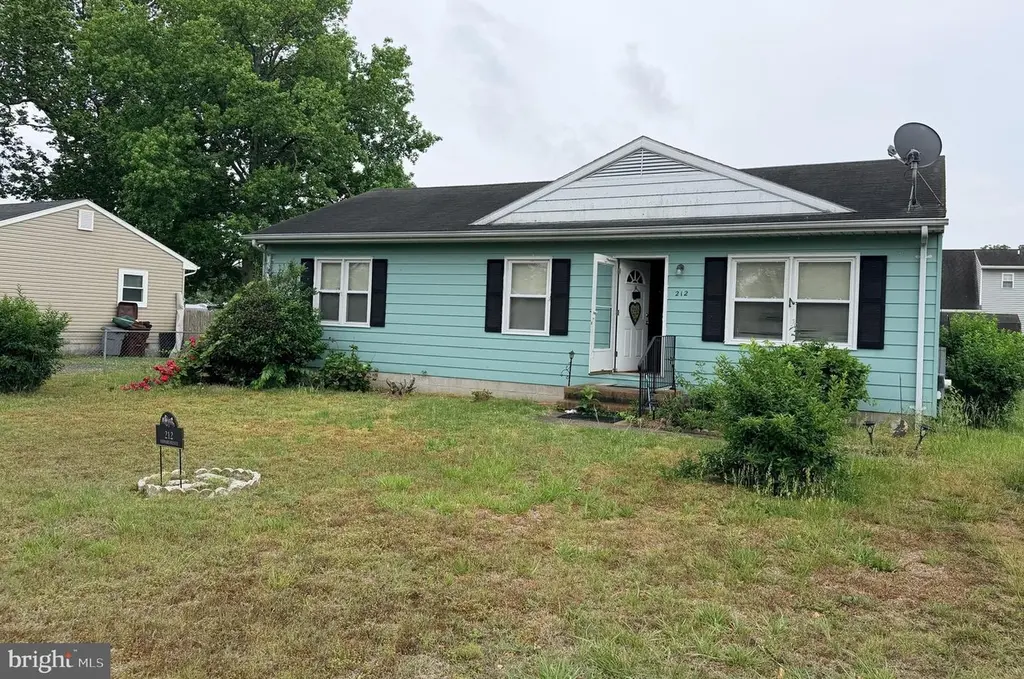
212 Hayward Ave · Fruitland, MD
Flood risk 1/10 · Minimal
- FEMA flood zone
- X (unshaded)
- Chance of flooding over 30 yrs
- 0.0%
- Est. flood insurance / yr
- $507 – $1,088
Fire risk 4/10 · Minor
- Est. fire insurance / yr
- $755 – $1,403
Heat risk 9/10 · Severe
- Hot days now (above 105°F)
- 7 days/yr
- Hot days in 30 yrs
- 17 days/yr
Wind risk 7/10 · Major
- Chance of severe wind over 30 yrs
- 78.0%
Air-quality risk 2/10 · Minimal
- Unhealthy air days now
- 2 days/yr
- Unhealthy air days in 30 yrs
- 2 days/yr
Risk factors via First Street. Map © Google.
Why this score? — see what drove the B+ grade
The composite is a weighted blend of 9 inputs, each scored 0–100. Each bar is that input's sub-score; the figure is the points it added to the 100-point composite (weight × sub-score).
- Cash flow +30.0/30.0
- ARV discount +15.0/15.0
- 1% rule +10.0/10.0
- DSCR +10.0/10.0
- Livability +3.5/5.0
- Rent growth +2.5/5.0
- Condition / age +2.5/5.0
- Schools +1.9/10.0
- Appreciation +0.0/10.0
$89,999
🖨 Deal sheet 📄 Offer letter ✓ Due diligence
Listing remarks
INVESTOR SPECIAL! Incredible opportunity to restore and add massive value to this 3-bedroom, 1-bathroom detached rancher situated on a premium 0.25-acre lot. Priced significantly below market value, this property is a blank canvas perfect for contractors, flippers, or savvy investors looking for their next profitable project. Enjoy the simplicity of single-level living on a generous piece of land with excellent equity potential. Property is being sold strictly AS-IS, WHERE-IS. The sale conveys with all contents remaining in the home; debris removal will be the sole responsibility of the buyer.
Key facts
- 0.23 acre lot
- Built 1981
- Listed 3 days
Property features AI
Exterior
- Parking: Driveway
- Utilities: Public water; Public sewer; Electric service
- Home design: Detached property; Above-grade finished living area approximately 1,056
- Construction: Aluminum siding; Block foundation; Above-grade and below-grade structures noted
- Exterior features: Located outside city limits in Fruitland; Not in a federal flood zone
Interior
- Bedrooms: Three bedrooms on the main level
- Bathrooms: One full bathroom on the main level
- Heating & cooling: Baseboard electric heating; Electric hot water
- Interior features: Home has two or more access exits; No basement
Neighborhood map
What this means for you Summary
Snapshot
- This is a 3-bed/1.0-bath single-family listed at $90k.
Deal economics
- At list price, monthly cash flow is $737 ($9k/yr) — positive.
- The deal already cash-flows at list — no discount required.
- Meets the 1% rule at list price ($2k rent vs $90k).
- Cap rate 16.1% vs local median 3.6% in Fruitland — top-decile yield for the area; either an underpriced asset or a hidden risk that comps aren't pricing in. Stress-test before assuming the spread holds.
Location & tenants
- Location reads 70/100 on livability (#179 in MD) — a middle-class / working-renter tenant base. Strengths: cost of living A, housing A, health & safety A; Watch: schools D, amenities F, commute F.
- Wicomico County Public Schools (urban): math 16% / reading 26% proficiency, ranked #19 of 24 in MD (top 79%) — low school quality limits family demand, transient renter base, plan for 1-2y turnover.
- Market conditions: 42 active listings in the ZIP; 6 comparable units currently listed for rent nearby; rentals lingering (median 44d on market — plan ~5-8 weeks vacancy on turnover, expect pricing pressure); 67% of comp listings sitting > 30 days — soft ceiling on asking rent; 278 units permitted in Wicomico County in 2024 (44 in 5+ unit buildings).
- This rent runs 31% of the median local income ($65k/yr) — at the standard rent-burdened threshold; future hikes will face affordability resistance.
Forward outlook
- Local home prices are declining (-3.0%/yr); year-one equity from $622 of loan paydown is wiped out by about $3k of value loss. Plan a longer hold.
- Wicomico County population projected at +14% by 2050 — modest demand growth; plan on rents tracking national, not racing it.
- At projected returns (-3.0% appreciation + 3.0% rent growth), your $25k cash investment doubles in ~4 years — after that, you're playing with house money.
Negotiation context
- Only 3 days on market — expect competitive offers; lowballing is unlikely to land.
Risks & watch-outs
- Climate carrying-cost: major wind risk, 78% chance of damaging wind over 30y; extreme-heat days projected 7→17/yr by 2055 (HVAC capex compounding) — expect insurance premiums to compound above CPI over the hold.
Questions for the listing agent
- Is there a deadline driving the sale (1031 exchange, divorce, estate, relocation)? That informs how much negotiation room exists.
- Schools are D-rated, which usually means shorter tenancies and higher turnover. Who's the typical renter profile here, and what's been the actual vacancy rate?
- What's the average days-on-market for RENTAL listings here right now (not sales)? A rising rental-DOM trend means longer vacancies and softer asking-rent achievability than the comps imply.
- What's the recent tenant-quality profile in this submarket — average credit score on applications, eviction rate, late-payment / NSF rate, and stable-employment percentage? A property-management company in the area should have these aggregated.
- How much new for-sale + rental construction is in the pipeline within 1–3 miles? Heavy new supply typically softens prices + rents 12–24 months out; constrained supply supports both.
Investment metrics
- 1% rule
- 1.86% ✓
- Cap rate
- 16.12%
- Cash-on-cash
- 35.09%
- DSCR
- 2.56
- GRM
- 4.5
CMA / ARV
- ARV (on-the-fly)
- $124,608
- Comps found
- 12
Show comp detail 12 sales within ~0.75 mi
| Address | Dist | Beds/Ba | Sqft | Sold | Price | $/sf | Match |
|---|---|---|---|---|---|---|---|
| 212 Hayward Ave | 0.00mi | 3/1.0 | 1,056 (0%) | 0mo | $112,500 | $107 | 100 |
| 209 W Main St | 0.09mi | 3/1.5 | 1,092 (+3%) | 6mo | $220,000 | $201 | 83 |
| 104 Oaklee Dr | 0.35mi | 3/1.5 | 1,092 (+3%) | 0mo | $245,000 | $224 | 75 |
| 115 Walden Dr | 0.25mi | 3/1.0 | 1,008 (-4%) | 8mo | $160,000 | $159 | 74 |
| 104 S Camden Ave | 0.18mi | 3/1.0 | 1,180 (+12%) | 9mo | $210,990 | $179 | 64 |
| 120 Ridgefield Ln | 0.41mi | 3/1.0 | 1,120 (+6%) | 8mo | $201,500 | $180 | 64 |
| 214 N Dulany Ave | 0.44mi | 2/1.0 (-1) | 978 (-7%) | 7mo | $115,000 | $118 | 56 |
| 243 Sand Castle Blvd | 0.61mi | 2/2.0 (-1) | 1,008 (-4%) | 9mo | $80,000 | $79 | 47 |
| 409 Tiffany Dr | 0.66mi | 3/2.0 | 984 (-7%) | 9mo | $70,000 | $71 | 46 |
| 229 Sand Castle Blvd | 0.67mi | 3/2.0 | 938 (-11%) | 5mo | $44,900 | $48 | 42 |
| 410 Tiffany Dr | 0.66mi | 3/2.0 | 938 (-11%) | 9mo | $55,000 | $59 | 39 |
| 220 Sand Castle Blvd | 0.73mi | 2/2.0 (-1) | 929 (-12%) | 3mo | $40,000 | $43 | 35 |
Match score weights: distance 35% · size 25% · config 20% · recency 20%. Top-matched comps best support the ARV.
Projected returns pro-forma
-3.0% appreciation · 3.0% rent growth · sell at horizon
- IRR
- 30.6%
- Equity multiple
- 2.28×
- Total profit
- $32,345
- Equity at exit
- $13,419
- IRR
- 37.9%
- Equity multiple
- 4.52×
- Total profit
- $88,603
- Equity at exit
- $7,781
Cash invested: $25,200 (down + closing). Projections, not guarantees.
Landlord ↔ Tenant lean methodology
- Overall (STATE)
- 27 Tenant-Leaning
- State Maryland
- 27 Tenant-Leaning · D+14
- County
- — inherits STATE
- City
- — inherits STATE
ZIP-level market 21826
- Home prices YoY
- -7.6%
- Active inventory
- 42
- Price-to-rent
- 4.5×
Monthly cashflow live
- Estimated rent
- $1,674 high interval (Pro) →
- Mortgage (P&I)
- −$472
- Tax from tax record
- −$76 /mo · $914/yr
- Insurance
- −$37
- HOA
- −$0
- Vacancy / Maint / Mgmt
- −$352
- Net cashflow
- $737
Break-even live
UW: 25.0% down · 7.5% · 30yr · 1.5% tax · 5.0% vac · 8.0% maint · 8.0% mgmt
Financing live
Cash to close
- Down payment
- $22,500
- Closing costs
- $2,700
- Reserves months
- —
- Total cash needed
- —
Loan-product check · same deal, 3 products live
Conventional
25% down · 7.5% · 30yr
- Down + closing
- —
- Monthly P&I
- —
- Monthly cashflow
- —
- DSCR
- —
- Eligible?
- —
Personal DTI + credit; lowest rate.
DSCR
20% down · 8.5% · 30yr
- Down + closing
- —
- Monthly P&I
- —
- Monthly cashflow
- —
- DSCR
- —
- Eligible?
- —
No personal income docs; deal must DSCR.
Hard money
10% down · 12.0% · 12mo
- Down + closing
- —
- Monthly P&I
- —
- Monthly cashflow
- —
- DSCR
- —
- Eligible?
- —
Short-term bridge; refi at stabilization.
Rent comps 6 comps
| Address | Beds | Baths | Sqft | Rent | $/sqft | DOM | Units | Dist |
|---|---|---|---|---|---|---|---|---|
| 103 W Main St Fruitland, MD | 2.0 | 1.0 | 1200 | $1,100 | $0.92 | 21d | 1 | 0.28mi |
| 508 Hayward Ave Fruitland, MD | 2.0 | 1.0 | 992 | $1,450 | $1.46 | 43d | 1 | 0.36mi |
| 413A Ogle Ave Fruitland, MD | 3.0 | 1.0 | 864 | $1,700 | $1.97 | 21d | 1 | 0.38mi |
| 801 W Main St Fruitland, MD | 4.0 | 1.0 | 1232 | $1,700 | $1.38 | 43d | 1 | 0.67mi |
| 255 Canal Park Dr Apt C Salisbury, MD | 4.0 | 2.0 | 1250 | $1,600 | $1.28 | 43d | 1 | 0.94mi |
| 732 Wye Oak Dr Fruitland, MD | 3.0 | 2.5 | 1396 | $2,300 | $1.65 | 43d | 1 | 0.97mi |
Listing history 2 events
-
2026-05-30statusdays on market $89,999 Pending 3 DOM
-
2026-05-26$89,999 Active
ⓘ Source: listings_history table (triggers on properties + properties_extension) + one-shot
backfill from property_details.listing_events for pre-trigger history.
Tax reassessment forecast MD · Partial reset (capped growth)
- Current annual tax
- $914 · $76/mo
- Projected year-2 tax
- $948 · $79/mo
- Expected delta
- +$33/yr (+$3/mo · 3.6%)
ⓘ Screening estimate from a state-policy table — verify with the county assessor before closing.
Climate risk First Street
- Flood 1/10 Low FEMA zone X (unshaded) · 0% chance over 30 yrs
- Wildfire 4/10 Moderate
- Heat 9/10 Extreme 7 d/yr ≥105°F today · 17 d/yr by 30 yrs out
- Wind 7/10 Severe 78% chance of damaging wind over 30 yrs
- Air quality 2/10 Low 2 unhealthy d/yr today · 2 by 30 yrs out
Nearby sold comps map
Loading sold comps map…
Walkable amenities ~0.75 mi
Loading nearby amenities…
Taxation est. · year 1
- Rental income
- $20,088
- − Mortgage interest
- −$5,041
- − Property taxes
- −$914
- − Insurance
- −$450
- − Repairs & maintenance
- −$1,607
- − Management
- −$1,607
- − Depreciation
- −$2,618
- Taxable income
- $7,850
- Est. tax owed @ 24.0%
- −$1,884
- After-tax cash flow
- $6,957/yr
For passive investors: Depreciation is non-cash, so a rental often shows a tax loss while cash-flowing — sheltering income. Rental losses are passive: they offset passive income freely, and up to $25,000/yr can offset ordinary (W-2) income if you actively participate and your MAGI is under $100k (phasing out to $0 by $150k); unused losses carry forward. On sale, claimed depreciation is recaptured at up to 25%, and gains may owe capital-gains tax (a 1031 exchange can defer both). Figures are a year-1 estimate at your 24.0% rate — not tax advice; consult a CPA.
Schools (NCES district)
- District
- Wicomico County Public Schools
- NCES district ID
- 2400690
- Math proficiency
- 16% ▼ -18.00%
- Reading proficiency
- 26% ▼ -13.00%
- Median HH income
- $51,745
- Composite
- 18.87/100
- National rank
- #8860
- State rank
- #19 of 24 in MD
Livability — Fruitland
- Score
- 70/100
- State rank
- #179
- US rank
- #7980
Category grades
Schools grade is shown separately in the Schools card above.
Census & demographics
- Census place
- Fruitland, MD
- County
- Wicomico County · 75,969 people
- City population
- 5,451
- Metro
- Salisbury, MD-DE
- Population (ZIP)
- 5,451
- Household income
- $64,946
- Rent vs Own
- Severe rent burden
- 294.0
Population outlook (Wicomico County) Hauer SSP2
- Today (2025)
- 108,548 people
- By 2030
- 111,783 · +3.0%
- By 2040
- 118,139 · +8.8%
- By 2050
- 123,641 · +13.9%
- By 2075
- 139,784 · +28.8%
- By 2100
- 145,334 · +33.9%
Race, ethnicity, and origin ACS 2023
- Neighborhood character
- Diverse neighborhood (Simpson 0.65)
- Race & ethnicity
- White 51% Black 27% Hispanic / Latino 14% Two or more races 11% Asian 3%
- Hispanic origin (detail)
- Puerto Rican 2% Dominican 3%
- Common ancestry
- Hispanic 2% Romanian 2% Lithuanian 2%
- Foreign-born
- 10% · Canada, China, South Korea
- Languages at home
- 77% English-only · Spanish 14% Other Asian/Pacific 4% Korean 1%
Political lean MEDSL · Wicomico
- 2024 margin
- Lean R (+5.5) · D 46.1% · R 51.5% · Other 2.4%
- 2008→2024 swing
- +0.3pp no change · 2008: -5.8pp · 2024: -5.5pp
- All cycles
- 2024: R+5.5 2020: R+1.9 2016: R+11.6 2012: R+6.9 2008: R+5.8
Not yet ingested
- Civics
- —
Market trends
- HPI YoY
- ▼ -19.52%
- Current HPI
- 236.5727
- Rent YoY
- —
- Metro
- Salisbury, MD-DE
- State GDP YoY
- ▲ 2.97%
- F500 in state
- 12
Industry mix (Fortune 500 HQ in MD)
| Industry | F500 HQs | Revenue |
|---|---|---|
| Aerospace / Defense | 1 | $71B |
|
||
| Utilities | 1 | $25B |
|
||
| Hotels | 1 | $24B |
|
||
| Consumer Goods | 1 | $7B |
|
||
| Real Estate | 1 | $6B |
|
||
| Chemicals | 1 | $2B |
|
||
Price history
1 event — show timeline
- 2026-05-26 Listed $89,999 BRIGHT MLS
Property tax history
-3.3%/yrLatest (2025): $914 · +1.7% YoY. Source: county tax records.
Cash-flow waterfall
monthlySold comps — $/sqft
last 12 mo · ≤1 miLoading sold comps…