5033 Richard Dr · Lowell, IN
Flood risk 1/10 · Minimal
- FEMA flood zone
- X (unshaded)
- Chance of flooding over 30 yrs
- 0.0%
- Est. flood insurance / yr
- $507 – $1,088
Fire risk 1/10 · Minimal
- Est. fire insurance / yr
- $717 – $1,331
Heat risk 2/10 · Minimal
- Hot days now (above 101°F)
- 7 days/yr
- Hot days in 30 yrs
- 16 days/yr
Wind risk 2/10 · Minimal
- Chance of severe wind over 30 yrs
- 0.0%
Air-quality risk 2/10 · Minimal
- Unhealthy air days now
- 1 days/yr
- Unhealthy air days in 30 yrs
- 2 days/yr
Risk factors via First Street. Map © Google.
Why this score? — see what drove the D grade
The composite is a weighted blend of 9 inputs, each scored 0–100. Each bar is that input's sub-score; the figure is the points it added to the 100-point composite (weight × sub-score).
- ARV discount +13.3/15.0
- Cash flow +8.9/30.0
- Schools +4.5/10.0
- Livability +3.8/5.0
- 1% rule +2.7/10.0
- DSCR +2.5/10.0
- Rent growth +2.5/5.0
- Condition / age +2.5/5.0
- Appreciation +0.0/10.0
$361,900
🖨 Deal sheet (PDF) 📄 Offer letter ✓ Due diligence
Listing remarks MLS
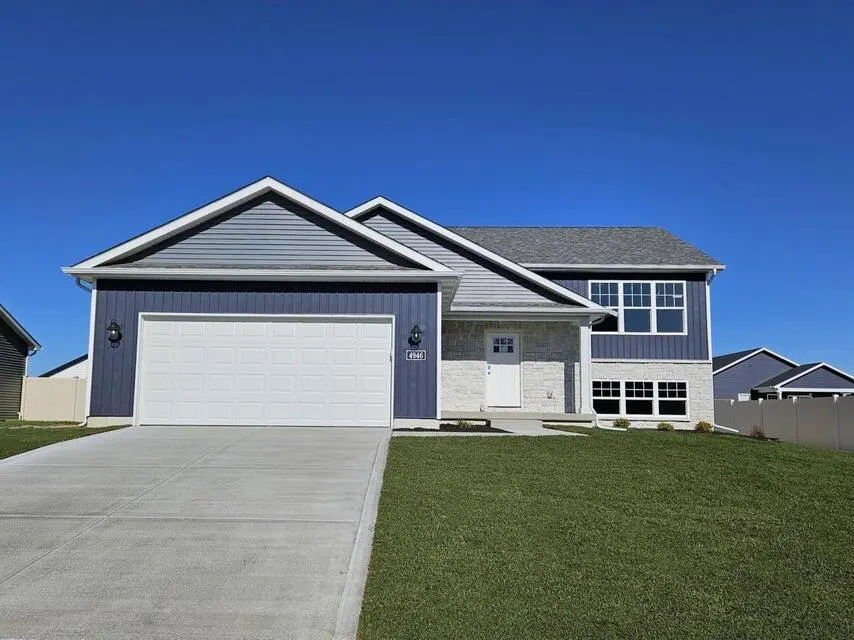
NOT YET BUILT, this is our HARRISON MODEL. This spacious two level home offers a possible five bedroom, three bath layout. This home features an open concept living area, great room with cathedral ceiling, spacious dining area with immediate exterior access via sliding doors, large kitchen with soft close maple cabinetry, crown molding, GRANITE counters, kitchen island with seating, and pantry. The primary bedroom includes a tray ceiling, ENSUITE bath, and walk-in closet. Additional features include black or brushed nickel options for hardware and lighting, one PAINT color included, QUARTZ tops in all bathrooms, and lower level with OPTIONS to finish (rough-in for future bath is included/standard). Exterior features include a tasteful BOARD AND BATTEN/vinyl sided finish, rear DECK, attached garage with opener installed, covered porch, full LANDSCAPING PACKAGE, and BUILDER WARRANTY. Many options for customization of our 18 floor plans are possible to include structural changes such as a 3 car garage, 5' garage extension, slab, or basement options, as well as for other finishes such as for a fireplace, custom tile shower, exterior masonry, etc. Photos are of a previously built home.
Key facts
- Crown molding
- Granite counters
- Spacious dining area
Tags
Neighborhood map
What this means for you Summary
Snapshot
- This is a 3-bed/2.0-bath single-family listed at $362k.
Deal economics
- At list price, monthly cash flow is $-289 ($-3k/yr) — negative.
- To cash-flow at today's rent, offer at most $320k (11.6% below list).
- To meet the 1% rule (rent ≥ 1% of price), the offer needs to be $280k (22.6% below list).
- Recommended offer: $280k (22.6% below list) — sets the bar for 1% rule.
- Cap rate 5.3% vs local median 3.8% in Lowell — top-decile yield for the area; either an underpriced asset or a hidden risk that comps aren't pricing in. Stress-test before assuming the spread holds.
Location & tenants
- Location reads 76/100 on livability (#51 in IN, #3,455 nationally) — a middle-class / working-renter tenant base. Strengths: crime A+, cost of living A+, housing A+; Watch: health & safety C-, amenities F, commute F.
- Tri-Creek School Corporation (town): math 46% / reading 56% proficiency, ranked #39 of 301 in IN (top 13%) — acceptable for families but not a draw, mixed tenant base, ~2y average lease.
- Zoned schools: Three Creeks Elem School (math 55% / reading 48%, grade C-, #256 of 994 statewide, top 26%, 515 students, 30% FRL); Lowell Middle School (math 36% / reading 54%, grade D, #81 of 330 statewide, top 25%, 742 students, 33% FRL); Lowell Senior High School (math 31% / reading 75%, grade C-, #99 of 369 statewide, top 27%, 1,033 students, 29% FRL).
- Market conditions: 351 active listings in the ZIP; 1 comparable units currently listed for rent nearby; 1,642 units permitted in Lake County in 2024 (14 in 5+ unit buildings).
Forward outlook
- Local home prices are declining (-3.0%/yr); year-one equity from $3k of loan paydown is wiped out by about $11k of value loss. Plan a longer hold.
- Lake County population projected to shrink 7% by 2050 — rents likely to lag national; underwrite the cash flow, not the appreciation.
Negotiation context
- It's been on market 68 days — a 6% lower offer ($340k) is reasonable based on typical stale-listing flexibility.
Questions for the listing agent
- What do current leases actually rent for vs. the listed asking? Can we see a recent rent roll and the last 12 months of T-12 income?
- It's been on market 68 days. Have you received any prior offers? Is the seller open to a 23% concession, seller financing, or rate buy-down credit?
- Why hasn't it sold? Are there any deal-killer items the seller is aware of (foundation, flood, title, zoning, code violations)?
- Is there a deadline driving the sale (1031 exchange, divorce, estate, relocation)? That informs how much negotiation room exists.
- The area grade is low — what's the realistic commute time and amenity access for the typical tenant pool here? Any planned neighborhood developments (good or bad) we should know about?
- What's the average days-on-market for RENTAL listings here right now (not sales)? A rising rental-DOM trend means longer vacancies and softer asking-rent achievability than the comps imply.
- What's the recent tenant-quality profile in this submarket — average credit score on applications, eviction rate, late-payment / NSF rate, and stable-employment percentage? A property-management company in the area should have these aggregated.
- How much new for-sale + rental construction is in the pipeline within 1–3 miles? Heavy new supply typically softens prices + rents 12–24 months out; constrained supply supports both.
Investment metrics
- 1% rule
- 0.77% ✗
- Cap rate
- 5.33%
- Cash-on-cash
- -3.42%
- DSCR
- 0.85
- GRM
- 10.8
CMA / ARV
- ARV (median comp)
- $415,849
- List price
- $361,900
- Delta
- -12.97%
- Verdict
- UNDERPRICED
- Comps
- 20 within 1.0 mi
Show comp detail 12 sales within ~0.75 mi
| Address | Dist | Beds/Ba | Sqft | Sold | Price | $/sf | Match |
|---|---|---|---|---|---|---|---|
| 18345 Judith Way | 0.10mi | 3/2.0 | 1,620 (+8%) | 2mo | $493,300 | $305 | 80 |
| 4839 Richard Dr | 0.03mi | 3/2.0 | 1,725 (+15%) | 1mo | $457,500 | $265 | 74 |
| 18349 Kaiti Dr | 0.44mi | 3/2.0 | 1,618 (+8%) | 2mo | $361,000 | $223 | 65 |
| 17814 Hillside Dr | 0.74mi | 3/2.5 | 1,517 (+1%) | 0mo | $324,901 | $214 | 62 |
| 1634 Northwood Dr | 0.66mi | 3/2.0 | 1,552 (+3%) | 5mo | $310,000 | $200 | 60 |
| 17801 Violette Ln | 0.73mi | 3/2.5 | 1,517 (+1%) | 4mo | $315,000 | $208 | 60 |
| 17817 Hillside Dr | 0.70mi | 3/2.5 | 1,507 (+0%) | 8mo | $299,900 | $199 | 58 |
| 17792 Violette Way | 0.74mi | 3/2.5 | 1,517 (+1%) | 7mo | $314,000 | $207 | 57 |
| 1649 Southview Dr | 0.58mi | 3/2.0 | 1,388 (-8%) | 5mo | $210,000 | $151 | 56 |
| 201 Crestline Dr | 0.59mi | 3/1.5 | 1,378 (-8%) | 8mo | $315,000 | $229 | 50 |
| 17829 Hillside Dr | 0.70mi | 3/2.5 | 1,600 (+6%) | 8mo | $299,990 | $187 | 48 |
| 17798 Violette Ln | 0.72mi | 3/2.5 | 1,637 (+9%) | 6mo | $359,466 | $220 | 45 |
Match score weights: distance 35% · size 25% · config 20% · recency 20%. Top-matched comps best support the ARV.
Projected returns pro-forma
-3.0% appreciation · 3.0% rent growth · sell at horizon
- IRR
- -22.0%
- Equity multiple
- 0.24×
- Total profit
- $-77,008
- Equity at exit
- $53,960
- IRR
- -15.9%
- Equity multiple
- 0.11×
- Total profit
- $-90,588
- Equity at exit
- $31,290
Cash invested: $101,332 (down + closing). Projections, not guarantees.
Landlord ↔ Tenant lean methodology
- Overall (STATE)
- 90 Strongly Landlord-Friendly
- State Indiana
- 90 Strongly Landlord-Friendly · R+11
- County
- — inherits STATE
- City
- — inherits STATE
ZIP-level market 46356
- Home prices YoY
- -30.1%
- Active inventory
- 351
- Price-to-rent
- 10.8×
Monthly cashflow live
- Estimated rent
- $2,800 medium interval (Pro) →
- Mortgage (P&I)
- −$1,898
- Tax est. 1.5%
- −$452 /mo · $5,428/yr
- Insurance
- −$151
- HOA
- −$0
- Vacancy / Maint / Mgmt
- −$588
- Net cashflow
- $-289
Break-even live
Sensitivity live
| Price | -10% $-39 | -5% $-164 | +0% $-289 | +5% $-414 | +10% $-539 |
|---|---|---|---|---|---|
| Rent | -10% $-510 | -5% $-400 | +0% $-289 | +5% $-178 | +10% $-68 |
| Rate | -1.0pp $-107 | -0.5pp $-197 | base $-289 | +0.5pp $-383 | +1.0pp $-478 |
UW: 25.0% down · 7.5% · 30yr · 1.5% tax · 5.0% vac · 8.0% maint · 8.0% mgmt
Financing live
Cash to close
- Down payment
- $90,475
- Closing costs
- $10,857
- Reserves months
- —
- Total cash needed
- —
Loan-product check · same deal, 3 products live
Conventional
25% down · 7.5% · 30yr
- Down + closing
- —
- Monthly P&I
- —
- Monthly cashflow
- —
- DSCR
- —
- Eligible?
- —
Personal DTI + credit; lowest rate.
DSCR
20% down · 8.5% · 30yr
- Down + closing
- —
- Monthly P&I
- —
- Monthly cashflow
- —
- DSCR
- —
- Eligible?
- —
No personal income docs; deal must DSCR.
Hard money
10% down · 12.0% · 12mo
- Down + closing
- —
- Monthly P&I
- —
- Monthly cashflow
- —
- DSCR
- —
- Eligible?
- —
Short-term bridge; refi at stabilization.
Rent comps 1 comps
| Address | Beds | Baths | Sqft | Rent | $/sqft | DOM | Units | Dist |
|---|---|---|---|---|---|---|---|---|
| 4507 W 173rd Ave Lowell, IN | 4.0 | 3.0 | 1900 | $2,800 | $1.47 | 20d | 1 | 1.25mi |
Listing history 15 events
-
2026-06-21days on market $361,900 Active 68 DOM
-
2026-06-18days on market $361,900 Active 65 DOM
-
2026-06-17days on market $361,900 Active 64 DOM
-
2026-06-16days on market $361,900 Active 63 DOM
-
2026-06-15days on market $361,900 Active 62 DOM
-
2026-06-13days on market $361,900 Active 60 DOM
-
2026-06-09days on market $361,900 Active 56 DOM
-
2026-06-08days on market $361,900 Active 55 DOM
-
2026-06-07days on market $361,900 Active 54 DOM
-
2026-06-04days on market $361,900 Active 51 DOM
-
2026-06-03days on market $361,900 Active 50 DOM
-
2026-06-02days on market $361,900 Active 49 DOM
-
2026-06-01days on market $361,900 Active 48 DOM
-
2026-05-31days on market $361,900 Active 47 DOM
-
2026-04-14$361,900 Active 1199-char remark
Show marketing remark (1199 chars)
NOT YET BUILT, this is our HARRISON MODEL. This spacious two level home offers a possible five bedroom, three bath layout. This home features an open concept living area, great room with cathedral ceiling, spacious dining area with immediate exterior access via sliding doors, large kitchen with soft close maple cabinetry, crown molding, GRANITE counters, kitchen island with seating, and pantry. The primary bedroom includes a tray ceiling, ENSUITE bath, and walk-in closet. Additional features include black or brushed nickel options for hardware and lighting, one PAINT color included, QUARTZ tops in all bathrooms, and lower level with OPTIONS to finish (rough-in for future bath is included/standard). Exterior features include a tasteful BOARD AND BATTEN/vinyl sided finish, rear DECK, attached garage with opener installed, covered porch, full LANDSCAPING PACKAGE, and BUILDER WARRANTY. Many options for customization of our 18 floor plans are possible to include structural changes such as a 3 car garage, 5' garage extension, slab, or basement options, as well as for other finishes such as for a fireplace, custom tile shower, exterior masonry, etc. Photos are of a previously built home.
ⓘ Source: listings_history table (triggers on properties + properties_extension) + one-shot
backfill from property_details.listing_events for pre-trigger history.
Climate risk First Street
- Flood 1/10 Low FEMA zone X (unshaded) · 0% chance over 30 yrs
- Wildfire 1/10 Low
- Heat 2/10 Low 7 d/yr ≥101°F today · 16 d/yr by 30 yrs out
- Wind 2/10 Low 0% chance of damaging wind over 30 yrs
- Air quality 2/10 Low 1 unhealthy d/yr today · 2 by 30 yrs out
Nearby sold comps map
Loading sold comps map…
Walkable amenities ~0.75 mi
Loading nearby amenities…
Taxation est. · year 1
- Rental income
- $33,600
- − Mortgage interest
- −$20,272
- − Property taxes
- −$5,428
- − Insurance
- −$1,810
- − Repairs & maintenance
- −$2,688
- − Management
- −$2,688
- − Depreciation
- −$10,528
- Taxable loss
- −$9,814
- Est. tax savings @ 24.0%
- +$2,355
- After-tax cash flow
- $-1,113/yr
For passive investors: Depreciation is non-cash, so a rental often shows a tax loss while cash-flowing — sheltering income. Rental losses are passive: they offset passive income freely, and up to $25,000/yr can offset ordinary (W-2) income if you actively participate and your MAGI is under $100k (phasing out to $0 by $150k); unused losses carry forward. On sale, claimed depreciation is recaptured at up to 25%, and gains may owe capital-gains tax (a 1031 exchange can defer both). Figures are a year-1 estimate at your 24.0% rate — not tax advice; consult a CPA.
Schools (NCES district)
- District
- Tri-Creek School Corporation
- NCES district ID
- 1811460
- Math proficiency
- 46% ▼ -8.00%
- Reading proficiency
- 56% ▼ -5.00%
- Median HH income
- $64,614
- Composite
- 44.97/100
- National rank
- #2704
- State rank
- #39 of 301 in IN
Livability — Lowell
- Score
- 76/100
- State rank
- #51
- US rank
- #3455
Category grades
Schools grade is shown separately in the Schools card above.
Census & demographics
- Census place
- Lowell, IN
- City population
- 19,396
- Population (ZIP)
- 19,396
Population outlook (Lake County) Hauer SSP2
- Today (2025)
- 484,026 people
- By 2030
- 478,091 · -1.2%
- By 2040
- 462,974 · -4.3%
- By 2050
- 449,894 · -7.1%
- By 2075
- 436,169 · -9.9%
- By 2100
- 426,607 · -11.9%
Race, ethnicity, and origin ACS 2023
- Neighborhood character
- Predominantly White (88%)
- Race & ethnicity
- White 88% Hispanic / Latino 9% Two or more races 6%
- Hispanic origin (detail)
- Mexican 8%
- Common ancestry
- Romanian 16% Iranian 10% Lithuanian 2%
- Foreign-born
- 4% · Canada
- Languages at home
- 95% English-only · Spanish 4% Russian/Polish/Slavic 1%
Political lean MEDSL · Lake
- 2024 margin
- Lean D (+5.6) · D 52.1% · R 46.5% · Other 1.5%
- 2008→2024 swing
- -28.6pp toward R · 2008: 34.3pp · 2024: 5.6pp
- All cycles
- 2024: D+5.6 2020: D+15.1 2016: D+20.6 2012: D+31.0 2008: D+34.3
Not yet ingested
- Civics
- —
Market trends
- HPI YoY
- ▼ -110.73%
- Current HPI
- 256.6224
- Rent YoY
- —
- Metro
- —
- State GDP YoY
- ▲ 2.90%
- F500 in state
- 18
Industry mix (Fortune 500 HQ in IN)
| Industry | F500 HQs | Revenue |
|---|---|---|
| Industrial Machinery | 2 | $37B |
|
||
| Healthcare | 1 | $177B |
|
||
| Pharmaceuticals | 1 | $45B |
|
||
| Metals / Steel | 1 | $18B |
|
||
| Agriculture | 1 | $17B |
|
||
| Packaging | 1 | $12B |
|
||
Price history
1 event — show timeline
- 2026-04-14 Listed $361,900 NIRA MLS as Distributed by MLS Grid
Cash-flow waterfall
monthlySold comps — $/sqft
last 12 mo · ≤1 miLoading sold comps…