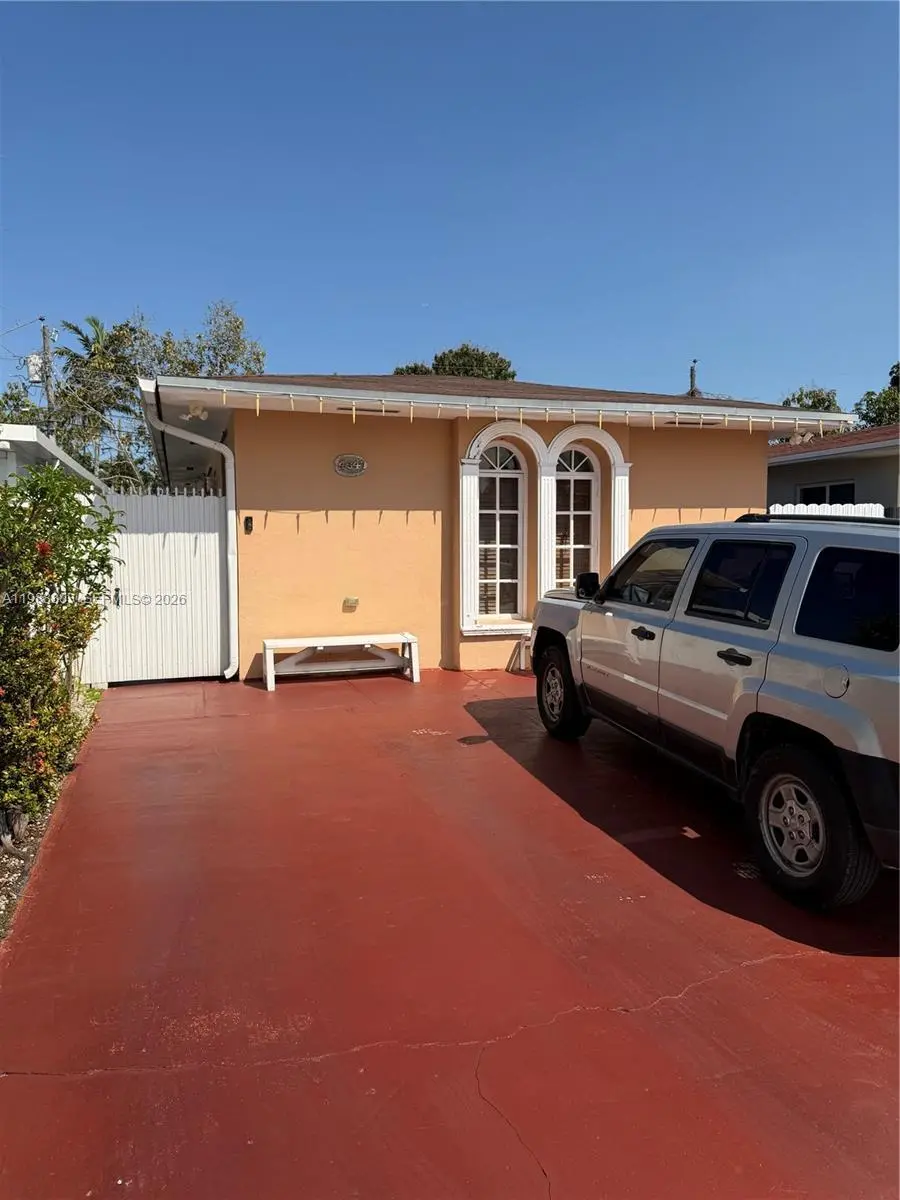
4347 E 9th Ct · Hialeah, FL
Flood risk 1/10 · Minimal
- FEMA flood zone
- AH
- Chance of flooding over 30 yrs
- 0.0%
- Est. flood insurance / yr
- $1,142 – $2,507
Fire risk 1/10 · Minimal
- Est. fire insurance / yr
- $947 – $1,759
Heat risk 10/10 · Severe
- Hot days now (above 105°F)
- 7 days/yr
- Hot days in 30 yrs
- 26 days/yr
Wind risk 10/10 · Severe
- Chance of severe wind over 30 yrs
- 99.0%
Air-quality risk 2/10 · Minimal
- Unhealthy air days now
- 1 days/yr
- Unhealthy air days in 30 yrs
- 2 days/yr
Risk factors via First Street. Map © Google.
Why this score? — see what drove the D- grade
The composite is a weighted blend of 9 inputs, each scored 0–100. Each bar is that input's sub-score; the figure is the points it added to the 100-point composite (weight × sub-score).
- ARV discount +15.0/15.0
- Cash flow +7.4/30.0
- Schools +4.2/10.0
- Livability +3.7/5.0
- Rent growth +2.5/5.0
- Condition / age +2.5/5.0
- 1% rule +1.5/10.0
- DSCR +1.5/10.0
- Appreciation +0.0/10.0
$490,000
🖨 Deal sheet (PDF) 📄 Offer letter ✓ Due diligence
Listing remarks MLS
2 bedroom, 2 bathroom home located in the heart of Hialeah. Large yard with plenty of room for a pool. Perfect for entertaining. Centrally located near highways, shopping, dining and entertainment venues. This is a Fannie Mae owned property.
Key facts
- Ample parking
- 3,000 sq ft lot
- Parking
Tags
Neighborhood map
What this means for you Summary
Snapshot
- This is a 2-bed/2.0-bath single-family listed at $490k.
Deal economics
- At list price, monthly cash flow is $-790 ($-9k/yr) — negative.
- To cash-flow at today's rent, offer at most $350k (28.5% below list).
- To meet the 1% rule (rent ≥ 1% of price), the offer needs to be $317k (35.2% below list).
- Recommended offer: $317k (35.2% below list) — sets the bar for 1% rule.
- Cap rate 4.7% vs local median 3.5% in Hialeah — top-decile yield for the area; either an underpriced asset or a hidden risk that comps aren't pricing in. Stress-test before assuming the spread holds.
Location & tenants
- Location reads 74/100 on livability (#288 in FL, #4,774 nationally) — a middle-class / working-renter tenant base. Strengths: commute A+, health & safety A+; Watch: amenities F, employment D-.
- Miami-Dade (suburban): math 45% / reading 54% proficiency, ranked #40 of 73 in FL (top 55%) — families likely to look elsewhere, expect single-tenant / working-renter base with shorter leases; 64% free/reduced lunch — lower-income household profile, screen leases tightly.
- Zoned schools: North Hialeah Elementary School (math 52% / reading 54%, grade C, #963 of 2,144 statewide, top 45%, 432 students, 66% FRL); Hialeah Middle School (math 30% / reading 42%, grade F, #410 of 571 statewide, top 72%, 878 students, 68% FRL); Hialeah Senior High School (math 16% / reading 37%, grade F, #489 of 667 statewide, top 74%, 1,732 students, 67% FRL) — zoned schools at 67% FRL track the district average.
- Market conditions: Rents soft (-0.1%/yr); 111 active listings in the ZIP; 10,051 units permitted in Miami-Dade County in 2024 (7,758 in 5+ unit buildings).
- At $3,174/mo this rent would consume 63% of the median local household income ($61k/yr) (locally 1352% of renters already pay >50% of income on rent) — very limited rent-growth headroom before tenants either downsize or default.
Forward outlook
- Local home prices are declining (-3.0%/yr); year-one equity from $3k of loan paydown is wiped out by about $15k of value loss. Plan a longer hold.
- Miami-Dade County population projected at +28% by 2050 — long-run rental-demand tailwind backs the buy-and-hold thesis.
Negotiation context
- It's been on market 34 days — a 3% lower offer ($475k) is reasonable based on typical stale-listing flexibility.
- 3 sale attempts since 12y ago with the ask held roughly flat each time — persistent listings suggest the price (not the market) is what's stuck; bring a comps-based counter.
- Current owner paid $110k; list at $490k implies a 345% gain — meaningful room to come down on a strong offer.
Risks & watch-outs
- Watch-outs: flood insurance adds $152/mo.
- Climate carrying-cost: in FEMA flood zone AH (mandatory federal flood insurance); severe wind risk, 99% chance of damaging wind over 30y; extreme-heat days projected 7→26/yr by 2055 (HVAC capex compounding) — expect insurance premiums to compound above CPI over the hold.
Questions for the listing agent
- What do current leases actually rent for vs. the listed asking? Can we see a recent rent roll and the last 12 months of T-12 income?
- It's been on market 34 days. Have you received any prior offers? Is the seller open to a 35% concession, seller financing, or rate buy-down credit?
- Built in 1977 — when were the roof, HVAC, electrical panel, plumbing, and water heater last replaced?
- What's the actual annual flood-insurance premium (NFIP or private), and is the property in a SFHA with mandatory coverage?
- Is there a deadline driving the sale (1031 exchange, divorce, estate, relocation)? That informs how much negotiation room exists.
- The area grade is low — what's the realistic commute time and amenity access for the typical tenant pool here? Any planned neighborhood developments (good or bad) we should know about?
- What's the average days-on-market for RENTAL listings here right now (not sales)? A rising rental-DOM trend means longer vacancies and softer asking-rent achievability than the comps imply.
- What's the recent tenant-quality profile in this submarket — average credit score on applications, eviction rate, late-payment / NSF rate, and stable-employment percentage? A property-management company in the area should have these aggregated.
- How much new for-sale + rental construction is in the pipeline within 1–3 miles? Heavy new supply typically softens prices + rents 12–24 months out; constrained supply supports both.
Investment metrics
- 1% rule
- 0.65% ✗
- Cap rate
- 4.73%
- Cash-on-cash
- -5.58%
- DSCR
- 0.75
- GRM
- 12.9
CMA / ARV
- ARV (on-the-fly)
- $595,000
- Comps found
- 1
Show comp detail 1 sale within ~0.75 mi
| Address | Dist | Beds/Ba | Sqft | Sold | Price | $/sf | Match |
|---|---|---|---|---|---|---|---|
| 3880 E 8th Ln | 0.34mi | 3/2.0 (+1) | 924 (-8%) | 3mo | $550,000 | $595 | 64 |
Match score weights: distance 35% · size 25% · config 20% · recency 20%. Top-matched comps best support the ARV.
Projected returns pro-forma
-3.0% appreciation · 0.0% rent growth · sell at horizon
- IRR
- -31.5%
- Equity multiple
- -0.01×
- Total profit
- $-139,034
- Equity at exit
- $73,061
- IRR
- -55.4%
- Equity multiple
- -0.62×
- Total profit
- $-221,844
- Equity at exit
- $42,366
Cash invested: $137,200 (down + closing). Projections, not guarantees.
Landlord ↔ Tenant lean methodology
- Overall (STATE)
- 87 Strongly Landlord-Friendly
- State Florida
- 87 Strongly Landlord-Friendly · R+3
- County
- — inherits STATE
- City
- — inherits STATE
ZIP-level market 33013
- Rents YoY
- -0.1%
- Active inventory
- 111
- Price-to-rent
- 12.9×
Monthly cashflow live
- Estimated rent
- $3,174 medium interval (Pro) →
- Mortgage (P&I)
- −$2,570
- Tax from tax record
- −$372 /mo · $4,461/yr
- Insurance
- −$204
- Flood insurance flood zone
- −$152 /mo · $1,824/yr
- HOA
- −$0
- Vacancy / Maint / Mgmt
- −$667
- Net cashflow
- $-790
Break-even live
Sensitivity live
| Price | -10% $-513 | -5% $-651 | +0% $-790 | +5% $-929 | +10% $-1,068 |
|---|---|---|---|---|---|
| Rent | -10% $-1,041 | -5% $-916 | +0% $-790 | +5% $-665 | +10% $-539 |
| Rate | -1.0pp $-543 | -0.5pp $-666 | base $-790 | +0.5pp $-917 | +1.0pp $-1,046 |
UW: 25.0% down · 7.5% · 30yr · 1.5% tax · 5.0% vac · 8.0% maint · 8.0% mgmt
Financing live
Cash to close
- Down payment
- $122,500
- Closing costs
- $14,700
- Reserves months
- —
- Total cash needed
- —
Loan-product check · same deal, 3 products live
Conventional
25% down · 7.5% · 30yr
- Down + closing
- —
- Monthly P&I
- —
- Monthly cashflow
- —
- DSCR
- —
- Eligible?
- —
Personal DTI + credit; lowest rate.
DSCR
20% down · 8.5% · 30yr
- Down + closing
- —
- Monthly P&I
- —
- Monthly cashflow
- —
- DSCR
- —
- Eligible?
- —
No personal income docs; deal must DSCR.
Hard money
10% down · 12.0% · 12mo
- Down + closing
- —
- Monthly P&I
- —
- Monthly cashflow
- —
- DSCR
- —
- Eligible?
- —
Short-term bridge; refi at stabilization.
Listing history 13 events
-
2026-04-27status Pending
-
2026-03-24$490,000 Active
-
2014-12-03soldstatus $110,000 Sold 241-char remark
Show marketing remark (241 chars)
2 bedroom, 2 bathroom home located in the heart of Hialeah. Large yard with plenty of room for a pool. Perfect for entertaining. Centrally located near highways, shopping, dining and entertainment venues. This is a Fannie Mae owned property.
-
2014-10-10status Pending 241-char remark
Show marketing remark (241 chars)
2 bedroom, 2 bathroom home located in the heart of Hialeah. Large yard with plenty of room for a pool. Perfect for entertaining. Centrally located near highways, shopping, dining and entertainment venues. This is a Fannie Mae owned property.
-
2014-09-09price $125,500 241-char remark
Show marketing remark (241 chars)
2 bedroom, 2 bathroom home located in the heart of Hialeah. Large yard with plenty of room for a pool. Perfect for entertaining. Centrally located near highways, shopping, dining and entertainment venues. This is a Fannie Mae owned property.
-
2014-08-28price $134,500 241-char remark
Show marketing remark (241 chars)
2 bedroom, 2 bathroom home located in the heart of Hialeah. Large yard with plenty of room for a pool. Perfect for entertaining. Centrally located near highways, shopping, dining and entertainment venues. This is a Fannie Mae owned property.
-
2014-07-10price $139,900 241-char remark
Show marketing remark (241 chars)
2 bedroom, 2 bathroom home located in the heart of Hialeah. Large yard with plenty of room for a pool. Perfect for entertaining. Centrally located near highways, shopping, dining and entertainment venues. This is a Fannie Mae owned property.
-
2014-06-15$149,900 Active 241-char remark
Show marketing remark (241 chars)
2 bedroom, 2 bathroom home located in the heart of Hialeah. Large yard with plenty of room for a pool. Perfect for entertaining. Centrally located near highways, shopping, dining and entertainment venues. This is a Fannie Mae owned property.
-
2014-06-15historical
Show marketing remark (241 chars)
2 bedroom, 2 bathroom home located in the heart of Hialeah. Large yard with plenty of room for a pool. Perfect for entertaining. Centrally located near highways, shopping, dining and entertainment venues. This is a Fannie Mae owned property.
-
2014-06-12$149,900 Active
-
1999-11-06soldstatus $114,000
-
1995-08-09soldstatus $86,000
-
1982-10-01soldstatus $56,000
ⓘ Source: listings_history table (triggers on properties + properties_extension) + one-shot
backfill from property_details.listing_events for pre-trigger history.
Tax reassessment forecast FL · Resets to sale price
- Current annual tax
- $4,461 · $372/mo
- Projected year-2 tax
- $4,461 · $372/mo
- Expected delta
- $0/yr ($0/mo · 0.0%)
ⓘ Screening estimate from a state-policy table — verify with the county assessor before closing.
Climate risk First Street
- Flood 1/10 Low FEMA zone AH · 0% chance over 30 yrs
- Wildfire 1/10 Low
- Heat 10/10 Extreme 7 d/yr ≥105°F today · 26 d/yr by 30 yrs out
- Wind 10/10 Extreme 99% chance of damaging wind over 30 yrs
- Air quality 2/10 Low 1 unhealthy d/yr today · 2 by 30 yrs out
Nearby sold comps map
Loading sold comps map…
Walkable amenities ~0.75 mi
Loading nearby amenities…
Taxation est. · year 1
- Rental income
- $38,088
- − Mortgage interest
- −$27,448
- − Property taxes
- −$4,461
- − Insurance
- −$4,274
- − Repairs & maintenance
- −$3,047
- − Management
- −$3,047
- − Depreciation
- −$14,255
- Taxable loss
- −$18,444
- Est. tax savings @ 24.0%
- +$4,427
- After-tax cash flow
- $-5,055/yr
For passive investors: Depreciation is non-cash, so a rental often shows a tax loss while cash-flowing — sheltering income. Rental losses are passive: they offset passive income freely, and up to $25,000/yr can offset ordinary (W-2) income if you actively participate and your MAGI is under $100k (phasing out to $0 by $150k); unused losses carry forward. On sale, claimed depreciation is recaptured at up to 25%, and gains may owe capital-gains tax (a 1031 exchange can defer both). Figures are a year-1 estimate at your 24.0% rate — not tax advice; consult a CPA.
Schools (NCES district)
- District
- Miami-Dade
- NCES district ID
- 1200390
- Math proficiency
- 45% ▼ -16.00%
- Reading proficiency
- 54% ▼ -5.00%
- Median HH income
- $43,928
- Composite
- 41.76/100
- National rank
- #3397
- State rank
- #40 of 73 in FL
Livability — Hialeah
- Score
- 74/100
- State rank
- #288
- US rank
- #4774
Category grades
Schools grade is shown separately in the Schools card above.
Census & demographics
- Census place
- Hialeah, FL
- County
- Miami-Dade County · 2,697,751 people
- City population
- 315,776
- Metro
- Miami-Fort Lauderdale-Pompano Beach, FL
- Population (ZIP)
- 30,695
- Household income
- $60,658
- Rent vs Own
- Severe rent burden
- 1352.0
Population outlook (Miami-Dade County) Hauer SSP2
- Today (2025)
- 3,126,439 people
- By 2030
- 3,325,765 · +6.4%
- By 2040
- 3,697,561 · +18.3%
- By 2050
- 4,012,134 · +28.3%
- By 2075
- 4,605,612 · +47.3%
- By 2100
- 4,866,598 · +55.7%
Race, ethnicity, and origin ACS 2023
- Neighborhood character
- Predominantly Hispanic (94%)
- Race & ethnicity
- Hispanic / Latino 94% Two or more races 56% White 5%
- Hispanic origin (detail)
- Puerto Rican 1% Cuban 82%
- Foreign-born
- 74% · Canada, Jamaica
- Languages at home
- 9% English-only · Spanish 90%
Political lean MEDSL · Miami-Dade
- 2024 margin
- R (+11.4) · D 43.9% · R 55.4%
- 2008→2024 swing
- -27.6pp toward R · 2008: 16.1pp · 2024: -11.4pp
- All cycles
- 2024: R+11.4 2020: D+7.3 2016: D+29.6 2012: D+23.7 2008: D+16.1
Not yet ingested
- Civics
- —
Market trends
- HPI YoY
- ▼ -664.57%
- Current HPI
- 429.3973
- Rent YoY
- ▼ -0.13%
- Metro
- Miami-Fort Lauderdale-Pompano Beach, FL
- State GDP YoY
- ▲ 3.28%
- F500 in state
- 36
Industry mix (Fortune 500 HQ in FL)
| Industry | F500 HQs | Revenue |
|---|---|---|
| Industrial Technology | 2 | $29B |
|
||
| Insurance | 2 | $17B |
|
||
| Retail | 1 | $60B |
|
||
| Technology Distribution | 1 | $58B |
|
||
| Homebuilding | 1 | $35B |
|
||
| Technology Manufacturing | 1 | $35B |
|
||
Price history
+775.0% since first listed13 events — show timeline
- 2026-04-27 Pending — MARMLS
- 2026-03-24 Listed $490,000 MARMLS
- 2014-12-03 Sold (MLS) $110,000 MARMLS
- 2014-10-10 Pending — MARMLS
- 2014-09-09 Price Changed $125,500 MARMLS
- 2014-08-28 Price Changed $134,500 MARMLS
- 2014-07-10 Price Changed $139,900 MARMLS
- 2014-06-15 Listed $149,900 MARMLS
- 2014-06-15 Listing Removed — MARMLS
- 2014-06-12 Listed $149,900 MARMLS
- 1999-11-06 Sold (Public Records) $114,000 Public Records
- 1995-08-09 Sold (Public Records) $86,000 Public Records
- 1982-10-01 Sold (Public Records) $56,000 Public Records
Property tax history
+6.5%/yrLatest (2025): $4,461 · -11.8% YoY. Source: county tax records.
Cash-flow waterfall
monthlySold comps — $/sqft
last 12 mo · ≤1 miLoading sold comps…