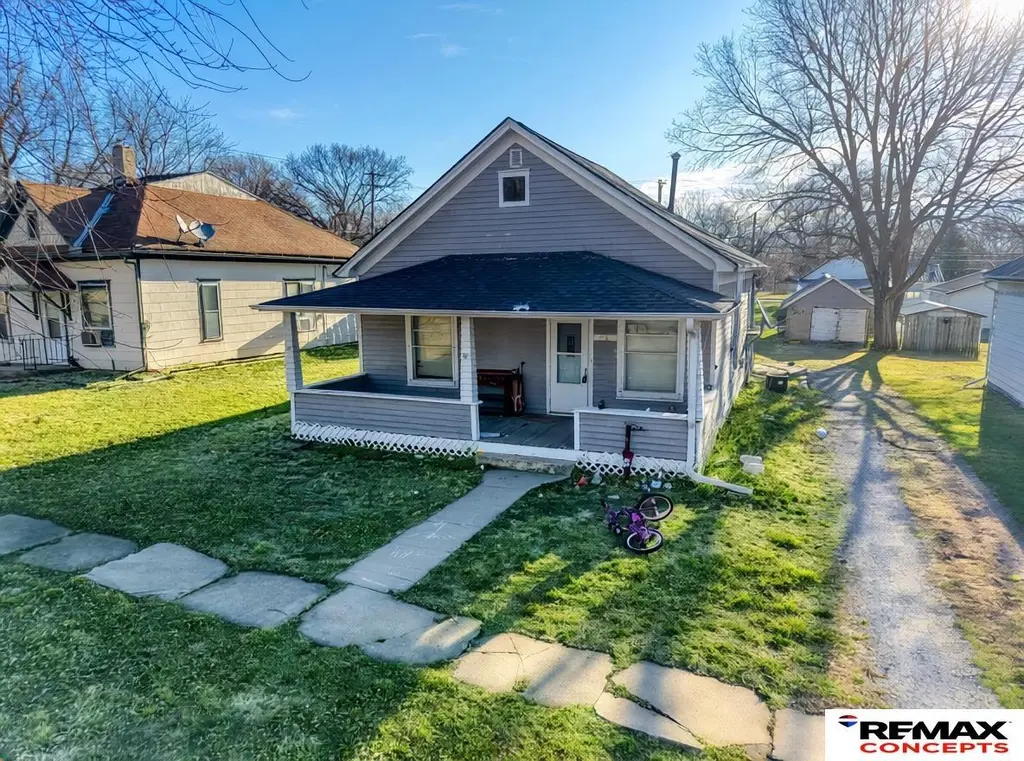
416 N 8th St · Wymore, NE
Flood risk 1/10 · Minimal
- FEMA flood zone
- X (unshaded)
- Chance of flooding over 30 yrs
- 0.0%
- Est. flood insurance / yr
- $473 – $860
Fire risk 1/10 · Minimal
- Est. fire insurance / yr
- $1,161 – $2,155
Heat risk 3/10 · Minor
- Hot days now (above 105°F)
- 7 days/yr
- Hot days in 30 yrs
- 16 days/yr
Wind risk 2/10 · Minimal
- Chance of severe wind over 30 yrs
- —
Air-quality risk 2/10 · Minimal
- Unhealthy air days now
- 1 days/yr
- Unhealthy air days in 30 yrs
- 1 days/yr
Risk factors via First Street. Map © Google.
Why this score? — see what drove the B grade
The composite is a weighted blend of 9 inputs, each scored 0–100. Each bar is that input's sub-score; the figure is the points it added to the 100-point composite (weight × sub-score).
- Cash flow +30.0/30.0
- ARV discount +12.3/15.0
- DSCR +10.0/10.0
- 1% rule +8.2/10.0
- Livability +3.7/5.0
- Schools +3.4/10.0
- Rent growth +2.5/5.0
- Condition / age +2.5/5.0
- Appreciation +1.4/10.0
$65,000
🖨 Deal sheet 📄 Offer letter ✓ Due diligence
Listing remarks MLS
Welcome to 416 N 8th Street this2-bedroom, 1-bath home small-town! With an inviting front porch and classic curb appeal, you’ll feel right at home the moment you arrive. Inside, you'll find a functional layout, and a spacious living area filled with natural light. The Roof is a newer one 5 years old. Schedule your showing today and see the potential for yourself!
Key facts
- Spacious living area
- Newer roof
- Front porch
Tags
Neighborhood map
What this means for you Summary
Snapshot
- This is a 2-bed/1.0-bath single-family listed at $65k.
Deal economics
- At list price, monthly cash flow is $265 ($3k/yr) — positive.
- The deal already cash-flows at list — no discount required.
- Meets the 1% rule at list price ($857 rent vs $65k).
- Recommended offer: $61k (6.0% below list) — sets the bar for market timing.
Location & tenants
- Location reads 73/100 on livability (#145 in NE) — a middle-class / working-renter tenant base. Strengths: crime A+, cost of living A+, housing A+; Watch: employment D+, schools D, amenities F.
- Southern School District 1 (rural): math 38% / reading 38% proficiency, ranked #224 of 245 in NE (top 91%) — families likely to look elsewhere, expect single-tenant / working-renter base with shorter leases.
- Market conditions: 8 active listings in the ZIP; 41 units permitted in Gage County in 2024 (14 in 5+ unit buildings).
Forward outlook
- Local home prices are declining (-3.0%/yr); year-one equity from $449 of loan paydown is wiped out by about $2k of value loss. Plan a longer hold.
- Gage County population projected at -15% by 2050 — secular population decline; favor cash flow + early exit over multi-decade hold.
- At projected returns (-3.0% appreciation + 3.0% rent growth), your $18k cash investment doubles in ~7 years — after that, you're playing with house money.
Negotiation context
- It's been on market 73 days — a 6% lower offer ($61k) is reasonable based on typical stale-listing flexibility.
- 6 sale attempts since 14y ago with the ask held roughly flat each time — persistent listings suggest the price (not the market) is what's stuck; bring a comps-based counter.
- Current owner paid $19k; list at $65k implies a 242% gain — meaningful room to come down on a strong offer.
Risks & watch-outs
- Watch-outs: built in 1910 — expect roof / HVAC / electrical / plumbing capex.
Questions for the listing agent
- It's been on market 73 days. Have you received any prior offers? Is the seller open to a 6% concession, seller financing, or rate buy-down credit?
- Built in 1910 — when were the roof, HVAC, electrical panel, plumbing, and water heater last replaced?
- Why hasn't it sold? Are there any deal-killer items the seller is aware of (foundation, flood, title, zoning, code violations)?
- Is there a deadline driving the sale (1031 exchange, divorce, estate, relocation)? That informs how much negotiation room exists.
- Schools are D-rated, which usually means shorter tenancies and higher turnover. Who's the typical renter profile here, and what's been the actual vacancy rate?
- What's the average days-on-market for RENTAL listings here right now (not sales)? A rising rental-DOM trend means longer vacancies and softer asking-rent achievability than the comps imply.
- What's the recent tenant-quality profile in this submarket — average credit score on applications, eviction rate, late-payment / NSF rate, and stable-employment percentage? A property-management company in the area should have these aggregated.
- How much new for-sale + rental construction is in the pipeline within 1–3 miles? Heavy new supply typically softens prices + rents 12–24 months out; constrained supply supports both.
Investment metrics
- 1% rule
- 1.32% ✓
- Cap rate
- 11.18%
- Cash-on-cash
- 17.46%
- DSCR
- 1.78
- GRM
- 6.3
CMA / ARV
- ARV (median comp)
- $72,823
- List price
- $65,000
- Delta
- -10.74%
- Verdict
- UNDERPRICED
- Comps
- 13 within 1.0 mi
Projected returns pro-forma
-3.0% appreciation · 3.0% rent growth · sell at horizon
- IRR
- 8.8%
- Equity multiple
- 1.35×
- Total profit
- $6,326
- Equity at exit
- $9,692
- IRR
- 18.0%
- Equity multiple
- 2.49×
- Total profit
- $27,190
- Equity at exit
- $5,620
Cash invested: $18,200 (down + closing). Projections, not guarantees.
Landlord ↔ Tenant lean methodology
- Overall (STATE)
- 83 Strongly Landlord-Friendly
- State Nebraska
- 83 Strongly Landlord-Friendly · R+13
- County
- — inherits STATE
- City
- — inherits STATE
ZIP-level market 68466
- Home prices YoY
- -4.2%
- Active inventory
- 8
- Price-to-rent
- 6.3×
Monthly cashflow live
- Estimated rent
- $857 medium interval (Pro) →
- Mortgage (P&I)
- −$341
- Tax from tax record
- −$44 /mo · $532/yr
- Insurance
- −$27
- HOA
- −$0
- Vacancy / Maint / Mgmt
- −$180
- Net cashflow
- $265
Break-even live
UW: 25.0% down · 7.5% · 30yr · 1.5% tax · 5.0% vac · 8.0% maint · 8.0% mgmt
Financing live
Cash to close
- Down payment
- $16,250
- Closing costs
- $1,950
- Reserves months
- —
- Total cash needed
- —
Loan-product check · same deal, 3 products live
Conventional
25% down · 7.5% · 30yr
- Down + closing
- —
- Monthly P&I
- —
- Monthly cashflow
- —
- DSCR
- —
- Eligible?
- —
Personal DTI + credit; lowest rate.
DSCR
20% down · 8.5% · 30yr
- Down + closing
- —
- Monthly P&I
- —
- Monthly cashflow
- —
- DSCR
- —
- Eligible?
- —
No personal income docs; deal must DSCR.
Hard money
10% down · 12.0% · 12mo
- Down + closing
- —
- Monthly P&I
- —
- Monthly cashflow
- —
- DSCR
- —
- Eligible?
- —
Short-term bridge; refi at stabilization.
Listing history 28 events
-
2026-06-19days on market $65,000 Active 73 DOM
-
2026-06-18days on market $65,000 Active 72 DOM
-
2026-06-17days on market $65,000 Active 71 DOM
-
2026-06-16days on market $65,000 Active 70 DOM
-
2026-06-15days on market $65,000 Active 69 DOM
-
2026-06-14days on market $65,000 Active 67 DOM
-
2026-06-12days on market $65,000 Active 66 DOM
-
2026-06-09days on market $65,000 Active 63 DOM
-
2026-06-08days on market $65,000 Active 62 DOM
-
2026-06-07days on market $65,000 Active 61 DOM
-
2026-06-05days on market $65,000 Active 59 DOM
-
2026-06-04days on market $65,000 Active 57 DOM
-
2026-06-02days on market $65,000 Active 56 DOM
-
2026-06-01days on market $65,000 Active 55 DOM
-
2026-05-31days on market $65,000 Active 54 DOM
-
2026-05-31days on market $65,000 Active 53 DOM
-
2026-04-07$65,000 New 371-char remark
Show marketing remark (371 chars)
Welcome to 416 N 8th Street this2-bedroom, 1-bath home small-town! With an inviting front porch and classic curb appeal, you’ll feel right at home the moment you arrive. Inside, you'll find a functional layout, and a spacious living area filled with natural light. The Roof is a newer one 5 years old. Schedule your showing today and see the potential for yourself!
-
2026-04-07historical
Show marketing remark (371 chars)
Welcome to 416 N 8th Street this2-bedroom, 1-bath home small-town! With an inviting front porch and classic curb appeal, you’ll feel right at home the moment you arrive. Inside, you'll find a functional layout, and a spacious living area filled with natural light. The Roof is a newer one 5 years old. Schedule your showing today and see the potential for yourself!
-
2026-02-27$70,000 New
-
2026-02-27historical
-
2025-12-01$70,000 New
-
2025-12-01historical
-
2025-11-28status Active
-
2025-10-14historical
-
2025-05-12$70,000 New
-
2013-05-21soldstatus $19,000
-
2013-05-20soldstatus $19,000
-
2012-09-28$22,000
ⓘ Source: listings_history table (triggers on properties + properties_extension) + one-shot
backfill from property_details.listing_events for pre-trigger history.
Tax reassessment forecast NE · Resets to sale price
- Current annual tax
- $532 · $44/mo
- Projected year-2 tax
- $1,124 · $94/mo
- Expected delta
- +$593/yr (+$49/mo · 111.5%)
ⓘ Screening estimate from a state-policy table — verify with the county assessor before closing.
Climate risk First Street
- Flood 1/10 Low FEMA zone X (unshaded) · 0% chance over 30 yrs
- Wildfire 1/10 Low
- Heat 3/10 Moderate 7 d/yr ≥105°F today · 16 d/yr by 30 yrs out
- Wind 2/10 Low
- Air quality 2/10 Low 1 unhealthy d/yr today · 1 by 30 yrs out
Nearby sold comps map
Loading sold comps map…
Walkable amenities ~0.75 mi
Loading nearby amenities…
Taxation est. · year 1
- Rental income
- $10,285
- − Mortgage interest
- −$3,641
- − Property taxes
- −$532
- − Insurance
- −$325
- − Repairs & maintenance
- −$823
- − Management
- −$823
- − Depreciation
- −$1,891
- Taxable income
- $2,251
- Est. tax owed @ 24.0%
- −$540
- After-tax cash flow
- $2,638/yr
For passive investors: Depreciation is non-cash, so a rental often shows a tax loss while cash-flowing — sheltering income. Rental losses are passive: they offset passive income freely, and up to $25,000/yr can offset ordinary (W-2) income if you actively participate and your MAGI is under $100k (phasing out to $0 by $150k); unused losses carry forward. On sale, claimed depreciation is recaptured at up to 25%, and gains may owe capital-gains tax (a 1031 exchange can defer both). Figures are a year-1 estimate at your 24.0% rate — not tax advice; consult a CPA.
Schools (NCES district)
- District
- Southern School District 1
- NCES district ID
- 3177180
- Math proficiency
- 38% ▲ 3.00%
- Reading proficiency
- 38% ▲ 3.00%
- Median HH income
- $38,704
- Composite
- 34.27/100
- National rank
- #10239
- State rank
- #224 of 245 in NE
Livability — Wymore
- Score
- 73/100
- State rank
- #145
- US rank
- #5268
Category grades
Schools grade is shown separately in the Schools card above.
Census & demographics
- Census place
- Wymore, NE
- Population (ZIP)
- 1,675
Population outlook (Gage County) Hauer SSP2
- Today (2025)
- 21,133 people
- By 2030
- 20,629 · -2.4%
- By 2040
- 19,398 · -8.2%
- By 2050
- 18,049 · -14.6%
- By 2075
- 15,504 · -26.6%
- By 2100
- 12,941 · -38.8%
Race, ethnicity, and origin ACS 2023
- Neighborhood character
- Predominantly White (93%)
- Race & ethnicity
- White 93% Two or more races 4% Black 1% Hispanic / Latino 1%
- Common ancestry
- Italian 2% Lithuanian 2% Slovak 1%
- Foreign-born
- 1%
- Languages at home
- 98% English-only · German/W. Germanic 1% Spanish 1%
Political lean MEDSL · Gage
- 2024 margin
- Solid R (+39.2) · D 29.7% · R 68.9% · Other 1.4%
- 2008→2024 swing
- -29.8pp toward R · 2008: -9.5pp · 2024: -39.2pp
- All cycles
- 2024: R+39.2 2020: R+36.5 2016: R+34.5 2012: R+16.8 2008: R+9.5
Not yet ingested
- Civics
- —
Market trends
- HPI YoY
- ▼ -7.15%
- Current HPI
- 163.1228
- Rent YoY
- —
- Metro
- —
- State GDP YoY
- ▲ 0.68%
- F500 in state
- 2
Industry mix (Fortune 500 HQ in NE)
| Industry | F500 HQs | Revenue |
|---|---|---|
| Conglomerate | 1 | $371B |
|
||
Price history
+195.5% since first listed12 events — show timeline
- 2026-04-07 Listing Removed — GPRMLS
- 2026-04-07 Listed $65,000 GPRMLS
- 2026-02-27 Listing Removed — GPRMLS
- 2026-02-27 Listed $70,000 GPRMLS
- 2025-12-01 Listing Removed — GPRMLS
- 2025-12-01 Listed $70,000 GPRMLS
- 2025-11-28 Relisted — GPRMLS
- 2025-10-14 Listing Removed — GPRMLS
- 2025-05-12 Listed $70,000 GPRMLS
- 2013-05-21 Sold (Public Records) $19,000 Public Records
- 2013-05-20 Sold (MLS) $19,000 GPRMLS
- 2012-09-28 Listed $22,000 GPRMLS
Property tax history
+6.3%/yrLatest (2025): $532 · +17.6% YoY. Source: county tax records.
Cash-flow waterfall
monthlySold comps — $/sqft
last 12 mo · ≤1 miLoading sold comps…