 Multi-family
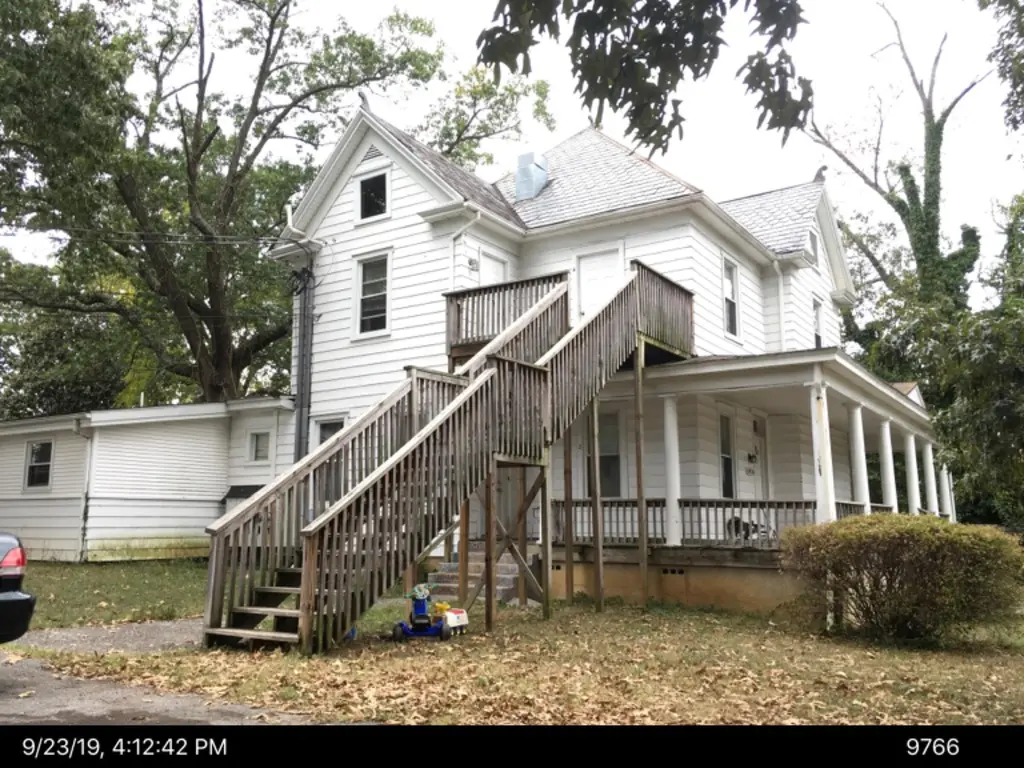
1926 E Main St Unit & 1928 · Salem, VA
Flood risk 1/10 · Minimal
- FEMA flood zone
- X (unshaded)
- Chance of flooding over 30 yrs
- 0.0%
- Est. flood insurance / yr
- $473 – $860
Fire risk 1/10 · Minimal
- Est. fire insurance / yr
- $666 – $1,236
Heat risk 5/10 · Moderate
- Hot days now (above 101°F)
- 7 days/yr
- Hot days in 30 yrs
- 16 days/yr
Wind risk 2/10 · Minimal
- Chance of severe wind over 30 yrs
- 1.0%
Air-quality risk 1/10 · Minimal
- Unhealthy air days now
- 0 days/yr
- Unhealthy air days in 30 yrs
- 0 days/yr
Risk factors via First Street. Map © Google.
Why this score? — see what drove the B grade
The composite is a weighted blend of 9 inputs, each scored 0–100. Each bar is that input's sub-score; the figure is the points it added to the 100-point composite (weight × sub-score).
- Cash flow +30.0/30.0
- 1% rule +10.0/10.0
- DSCR +10.0/10.0
- ARV discount +7.5/15.0
- Schools +5.7/10.0
- Rent growth +4.0/5.0
- Livability +3.9/5.0
- Condition / age +1.0/5.0
- Appreciation +0.0/10.0
$288,000
🖨 Deal sheet 📄 Offer letter ✓ Due diligence
Multi-family units
County records classify this as Multi-Family (5+ Unit). Listing-text estimate: 1 unit. estimate disagrees with records
5+ unit building — per-unit beds/baths from public records are typically unavailable; the breakdown below (if shown) is an estimate from the listing text.
Listing remarks
1926 has 5 units all 1 bd & 1 bath : #1 Vacant, #2 rented $560 M-T-M, #3 Vacant, #4 Vacant, #5 rented $640 lease ends 1/14/25,1928 E. Main has 1 rented $ 670, lease ends 4/11/25 1 bd, 1 bath. property will be shown by appointment on Wednesday, September 25th. Text LA to schedule.
Key facts
- 0.95 acre lot
- Built 1909
- Listed 604 days
Property features AI
Finance
- Other: Annual tax amount listed
- Financial info: Six total units
- HOA & community:
Exterior
- Parking:
- Security:
- Utilities: Owner pays water, sewer, and lawn care
- Home design: Multi-family apartment building; Built in 1909
- Construction:
- Exterior features: Nearly 1-acre lot (approximately 0.95 acres)
Interior
- Kitchen:
- Bedrooms:
- Flooring:
- Bathrooms:
- Heating & cooling: Heat pump electric for heating and cooling
- Interior features: Crawl space basement
- Laundry & utility:
Neighborhood map
What this means for you Summary
Snapshot
- This is a multifamily listed at $288k. Condition is rated poor.
Deal economics
- At list price, monthly cash flow is $2k ($22k/yr) — positive.
- The deal already cash-flows at list — no discount required.
- Meets the 1% rule at list price ($5k rent vs $288k).
- Recommended offer: $253k (12.0% below list) — sets the bar for market timing.
- Cap rate 13.9% vs local median 2.9% in Salem — top-decile yield for the area; either an underpriced asset or a hidden risk that comps aren't pricing in. Stress-test before assuming the spread holds.
Location & tenants
- Location reads 77/100 on livability (#104 in VA, #3,257 nationally) — a middle-class / working-renter tenant base. Strengths: housing A+, health & safety A+, cost of living A; Watch: amenities F, commute F.
- Salem City Public School District (suburban): math 61% / reading 74% proficiency, ranked #35 of 131 in VA (top 27%) — acceptable for families but not a draw, mixed tenant base, ~2y average lease.
- Zoned schools: East Salem Elementary (math 52% / reading 67%, grade B-, #536 of 1,108 statewide, top 51%, 409 students, 73% FRL); Andrew Lewis Middle (math 57% / reading 72%, grade A-, #123 of 342 statewide, top 37%, 895 students, 44% FRL); Salem High (math 64% / reading 91%, grade A-, #83 of 319 statewide, top 28%, 1,227 students, 39% FRL) — zoned schools average 52% FRL vs 27% district-wide (25 pts higher); higher-poverty schools than district average — tighter screening recommended.
- Market conditions: Rents rising fast (+6.0%/yr); 271 active listings in the ZIP; 23 comparable units currently listed for rent nearby; rentals at typical pace (median 22d on market — plan ~3-4 weeks tenant-placement turnaround); 268 units permitted in Salem city in 2024 (248 in 5+ unit buildings).
- At $4,818/mo this rent would consume 78% of the median local household income ($74k/yr) (locally 1115% of renters already pay >50% of income on rent) — very limited rent-growth headroom before tenants either downsize or default.
Forward outlook
- Local home prices are declining (-3.0%/yr); year-one equity from $2k of loan paydown is wiped out by about $9k of value loss. Plan a longer hold.
- Salem County population projected at +16% by 2050 — long-run rental-demand tailwind backs the buy-and-hold thesis.
- At projected returns (-3.0% appreciation + 6.0% rent growth), your $81k cash investment doubles in ~5 years — after that, you're playing with house money.
Negotiation context
- It's been on market 604 days — a 12% lower offer ($253k) is reasonable based on typical stale-listing flexibility.
- 2 sale attempts since 2y ago; this cycle's ask has dropped $87k (23%) from the opening price — seller is motivated, your offer sets the floor, not the list.
Risks & watch-outs
- Watch-outs: built in 1909 — expect roof / HVAC / electrical / plumbing capex.
- Climate carrying-cost: extreme-heat days projected 7→16/yr by 2055 (HVAC capex compounding) — expect insurance premiums to compound above CPI over the hold.
Questions for the listing agent
- It's been on market 604 days. Have you received any prior offers? Is the seller open to a 12% concession, seller financing, or rate buy-down credit?
- Have any recent inspections been done? Can we get a copy of the seller's disclosures and any deferred-maintenance estimates?
- Built in 1909 — when were the roof, HVAC, electrical panel, plumbing, and water heater last replaced?
- Why hasn't it sold? Are there any deal-killer items the seller is aware of (foundation, flood, title, zoning, code violations)?
- Is there a deadline driving the sale (1031 exchange, divorce, estate, relocation)? That informs how much negotiation room exists.
- Schools are A-rated — typically a magnet for longer-tenancy family renters. What's the average tenant stay here, and is there a school-zone premium baked into asking?
- What's the average days-on-market for RENTAL listings here right now (not sales)? A rising rental-DOM trend means longer vacancies and softer asking-rent achievability than the comps imply.
- What's the recent tenant-quality profile in this submarket — average credit score on applications, eviction rate, late-payment / NSF rate, and stable-employment percentage? A property-management company in the area should have these aggregated.
- How much new apartment / multifamily construction is in the pipeline within 1–3 miles? Heavy new supply (>2% of stock underway) typically softens rents 12–24 months out; light construction supports rent growth.
Investment metrics
- 1% rule
- 1.67% ✓
- Cap rate
- 13.86%
- Cash-on-cash
- 27.02%
- DSCR
- 2.20
- GRM
- 5.0
CMA / ARV
- ARV (median comp)
- $922,021
- List price
- $288,000
- Delta
- -68.76%
- Verdict
- UNDERPRICED
- Comps
- 2 within 2.0 mi
Show comp detail 1 sale within ~0.75 mi
| Address | Dist | Beds/Ba | Sqft | Sold | Price | $/sf | Match |
|---|---|---|---|---|---|---|---|
| 115 Dalewood Ave Unit & 117 | 0.25mi | —/— | — | 17mo | $275,000 | — | 62 |
Match score weights: distance 35% · size 25% · config 20% · recency 20%. Top-matched comps best support the ARV.
Projected returns pro-forma
-3.0% appreciation · 5.98% rent growth · sell at horizon
- IRR
- 24.3%
- Equity multiple
- 2.04×
- Total profit
- $83,938
- Equity at exit
- $42,942
- IRR
- 34.0%
- Equity multiple
- 4.56×
- Total profit
- $287,213
- Equity at exit
- $24,901
Cash invested: $80,640 (down + closing). Projections, not guarantees.
Landlord ↔ Tenant lean methodology
- Overall (STATE)
- 55 Moderately Landlord-Leaning
- State Virginia
- 55 Moderately Landlord-Leaning · D+2
- County
- — inherits STATE
- City
- — inherits STATE
ZIP-level market 24153
- Rents YoY
- 6.0%
- Active inventory
- 271
- Price-to-rent
- 24.9×
Monthly cashflow live
- Estimated rent
- $4,818 high interval (Pro) →
- Mortgage (P&I)
- −$1,510
- Tax est. 1.5%
- −$360 /mo · $4,320/yr
- Insurance
- −$120
- HOA
- −$0
- Vacancy / Maint / Mgmt
- −$1,012
- Net cashflow
- $1,816
Break-even live
5-unit breakdown (identical units grouped — click to expand)
| Units | Beds | Baths | Est. rent |
|---|---|---|---|
| 5× units | 1 | 1 | $4,820 |
| #1 | 1 | 1 | $964 |
| #2 | 1 | 1 | $964 |
| #3 | 1 | 1 | $964 |
| #4 | 1 | 1 | $964 |
| #5 | 1 | 1 | $964 |
| Total (5 units) | $4,818 | ||
UW: 25.0% down · 7.5% · 30yr · 1.5% tax · 5.0% vac · 8.0% maint · 8.0% mgmt
Financing live
Cash to close
- Down payment
- $72,000
- Closing costs
- $8,640
- Reserves months
- —
- Total cash needed
- —
Loan-product check · same deal, 3 products live
Conventional
25% down · 7.5% · 30yr
- Down + closing
- —
- Monthly P&I
- —
- Monthly cashflow
- —
- DSCR
- —
- Eligible?
- —
Personal DTI + credit; lowest rate.
DSCR
20% down · 8.5% · 30yr
- Down + closing
- —
- Monthly P&I
- —
- Monthly cashflow
- —
- DSCR
- —
- Eligible?
- —
No personal income docs; deal must DSCR.
Hard money
10% down · 12.0% · 12mo
- Down + closing
- —
- Monthly P&I
- —
- Monthly cashflow
- —
- DSCR
- —
- Eligible?
- —
Short-term bridge; refi at stabilization.
Rent comps 23 comps
| Address | Beds | Baths | Sqft | Rent | $/sqft | DOM | Units | Dist |
|---|---|---|---|---|---|---|---|---|
| 124 Bellevue Ave Salem, VA | 3.0 | 1.0 | — | $1,595 | — | 44d | 1 | 0.15mi |
| 1741 Pexton Ave Salem, VA | 3.0 | 1.0 | 792 | $1,452 | $1.83 | 13d | 1 | 0.47mi |
| 4310 Tyree Rd NW Roanoke, VA | 3.0 | 1.0 | 913 | $1,650 | $1.81 | 13d | 1 | 0.91mi |
| 4206 Vermont Ave NW Roanoke, VA | 1.0 | 1.0 | — | $723 | — | 44d | 1 | 0.94mi |
| 4112 Virginia Ave NW Roanoke, VA | 1.0 | 1.0 | 750 | $850 | $1.13 | 44d | 1 | 1.02mi |
| 4626 Autumn Ln NW Roanoke, VA | 3.0 | 2.5 | 1408 | $1,999 | $1.42 | 13d | 1 | 1.06mi |
| 328 Woodside Dr Salem, VA | 3.0 | 2.5 | 1408 | $1,999 | $1.42 | 21d | 1 | 1.10mi |
| 829 Westside Blvd NW Apt 2 Roanoke, VA | 1.0 | 1.0 | 700 | $895 | $1.28 | 44d | 1 | 1.14mi |
| 802 Westside Blvd NW Apt 9 Roanoke, VA | 1.0 | 1.0 | — | $746 | — | 21d | 1 | 1.16mi |
| 817 Westside Blvd NW Unit A Roanoke, VA | 1.0 | 1.0 | 525 | $716 | $1.36 | 21d | 1 | 1.17mi |
| 813 Westside Blvd NW Apt A Roanoke, VA | 1.0 | 1.0 | 525 | $716 | $1.36 | 44d | 1 | 1.17mi |
| 809 Westside Blvd NW Apt C Roanoke, VA | 1.0 | 1.0 | 525 | $696 | $1.33 | 44d | 1 | 1.19mi |
| 3802 Panorama Ave NW #12 Roanoke, VA | 3.0 | 1.0 | 1100 | $995 | $0.90 | 44d | 1 | 1.31mi |
| 3802 Panorama Ave NW #2 Roanoke, VA | 2.0 | 1.0 | 900 | $995 | $1.11 | 44d | 1 | 1.31mi |
| 3802 Panorama Ave NW #6 Roanoke, VA | 2.0 | 1.0 | 900 | $1,050 | $1.17 | 44d | 1 | 1.31mi |
| 3902 Tennessee Ave NW Roanoke, VA | 3.0 | 1.0 | — | $1,495 | — | 13d | 1 | 1.31mi |
| 900 Camelot Dr Salem, VA | 1.0–3.0 | 1.0–1.5 | 905 | $1,532 | $1.69 | 13d | 10 | 1.39mi |
| 128 Rutledge Dr Salem, VA | 1.0–3.0 | 1.0–2.0 | 822 | $1,365 | $1.66 | 13d | 13 | 1.40mi |
| 3720 Panorama Ave NW Unit 24 Roanoke, VA | 2.0 | 1.0 | — | $923 | — | 21d | 1 | 1.43mi |
| 3720 Panorama Ave NW Unit 34 Roanoke, VA | 2.0 | 1.0 | — | $878 | — | 21d | 1 | 1.43mi |
| 500 Poage Ln Salem, VA | 1.0 | 1.0 | 460 | $915 | $1.99 | 13d | 2 | 1.49mi |
| 500 Poage Ln Unit 28 Salem, VA | 1.0 | 1.0 | 456 | $935 | $2.05 | 21d | 1 | 1.49mi |
| 500 Poage Ln Apt 13 Salem, VA | 1.0 | 1.0 | 465 | $895 | $1.92 | 21d | 1 | 1.49mi |
Listing history 28 events
-
2026-06-18days on market $288,000 Active 604 DOM
-
2026-06-17days on market $288,000 Active 603 DOM
-
2026-06-16days on market $288,000 Active 602 DOM
-
2026-06-15days on market $288,000 Active 601 DOM
-
2026-06-14days on market $288,000 Active 599 DOM
-
2026-06-13days on market $288,000 Active 598 DOM
-
2026-06-10days on market $288,000 Active 596 DOM
-
2026-06-09days on market $288,000 Active 595 DOM
-
2026-06-08days on market $288,000 Active 594 DOM
-
2026-06-03days on market $288,000 Active 589 DOM
-
2026-06-02days on market $288,000 Active 588 DOM
-
2026-06-01days on market $288,000 Active 587 DOM
-
2026-05-31days on market $288,000 Active 586 DOM
-
2026-05-30days on market $288,000 Active 585 DOM
-
2026-05-18price $288,000
-
2026-02-06price $297,767
-
2026-01-05price $303,844
-
2025-12-01status Active
-
2025-11-02status Pending
-
2025-10-08price $310,045
-
2025-09-03price $316,372
-
2025-08-08price $322,829
-
2025-06-20price $329,417
-
2025-05-16price $336,140
-
2025-04-11price $343,000
-
2025-03-07price $350,000
-
2024-12-20price $360,000
-
2024-09-23$375,000 Active
ⓘ Source: listings_history table (triggers on properties + properties_extension) + one-shot
backfill from property_details.listing_events for pre-trigger history.
Climate risk First Street
- Flood 1/10 Low FEMA zone X (unshaded) · 0% chance over 30 yrs
- Wildfire 1/10 Low
- Heat 5/10 Major 7 d/yr ≥101°F today · 16 d/yr by 30 yrs out
- Wind 2/10 Low 100% chance of damaging wind over 30 yrs
- Air quality 1/10 Low 0 unhealthy d/yr today · 0 by 30 yrs out
Nearby sold comps map
Loading sold comps map…
Walkable amenities ~0.75 mi
Loading nearby amenities…
Taxation est. · year 1
- Rental income
- $57,816
- − Mortgage interest
- −$16,132
- − Property taxes
- −$4,320
- − Insurance
- −$1,440
- − Repairs & maintenance
- −$4,625
- − Management
- −$4,625
- − Depreciation
- −$8,378
- Taxable income
- $18,295
- Est. tax owed @ 24.0%
- −$4,391
- After-tax cash flow
- $17,400/yr
For passive investors: Depreciation is non-cash, so a rental often shows a tax loss while cash-flowing — sheltering income. Rental losses are passive: they offset passive income freely, and up to $25,000/yr can offset ordinary (W-2) income if you actively participate and your MAGI is under $100k (phasing out to $0 by $150k); unused losses carry forward. On sale, claimed depreciation is recaptured at up to 25%, and gains may owe capital-gains tax (a 1031 exchange can defer both). Figures are a year-1 estimate at your 24.0% rate — not tax advice; consult a CPA.
Condition & rehab AI · 13 photos
This property requires extensive repairs and updates to its kitchen, bathrooms, exterior, and landscaping. Immediate attention to these areas will significantly increase its resale and rental value.
Repairs flagged
- Major Kitchen appliances — Outdated and in need of replacement
- Major Bathroom fixtures — Outdated and in need of replacement
- Major Exterior siding and paint — Weathered and peeling, needs repainting and possibly replacement
- Major Landscaping — Overgrown and in need of trimming and maintenance
Value-add opportunities
- Resale New kitchen appliances — Modern appliances will attract more buyers and increase the home's appeal
- Resale New bathroom fixtures — Up-to-date fixtures will improve the home's appeal and functionality
- Both Painting and repainting of exterior and interior — Fresh paint will improve the home's curb appeal and interior condition, attracting more buyers and renters
- Both Landscaping and trimming — A well-maintained yard will enhance the home's curb appeal and attract more buyers and renters
Renovation cost estimate screening
| Repair item | Severity | Est. cost |
|---|---|---|
| Kitchen appliances · Outdated and in need of replacement | Major | $15,000–50,000 |
| Bathroom fixtures · Outdated and in need of replacement | Major | $15,000–50,000 |
| Exterior siding and paint · Weathered and peeling, needs repainting and possibly replacement | Major | $15,000–50,000 |
| Landscaping · Overgrown and in need of trimming and maintenance | Major | $15,000–50,000 |
| Total estimated repair cost · 4 items | $60,000–200,000 |
Value-add ROI direction
- Resale New kitchen appliances — Modern appliances will attract more buyers and increase the home's appeal ↑
- Resale New bathroom fixtures — Up-to-date fixtures will improve the home's appeal and functionality ↑
- Both Painting and repainting of exterior and interior — Fresh paint will improve the home's curb appeal and interior condition, attracting more buyers and renters ↑
- Both Landscaping and trimming — A well-maintained yard will enhance the home's curb appeal and attract more buyers and renters ↑
ⓘ Cost ranges are severity-bucket heuristics (US national rule-of-thumb). Get contractor quotes + a written scope before underwriting a rehab budget.
Schools (NCES district)
- District
- Salem City Public School District
- NCES district ID
- 5103460
- Math proficiency
- 61% ▼ -21.00%
- Reading proficiency
- 74% ▼ -7.00%
- Median HH income
- $49,976
- Composite
- 57.25/100
- National rank
- #1092
- State rank
- #35 of 131 in VA
Livability — Salem
- Score
- 77/100
- State rank
- #104
- US rank
- #3257
Category grades
Schools grade is shown separately in the Schools card above.
Census & demographics
- Census place
- Salem, VA
- County
- Salem City · 38,914 people
- City population
- 38,914
- Metro
- Roanoke, VA
- Population (ZIP)
- 38,914
- Household income
- $74,260
- Rent vs Own
- Severe rent burden
- 1115.0
Population outlook (Salem County) Hauer SSP2
- Today (2025)
- 26,761 people
- By 2030
- 27,543 · +2.9%
- By 2040
- 29,174 · +9.0%
- By 2050
- 30,902 · +15.5%
- By 2075
- 35,530 · +32.8%
- By 2100
- 39,381 · +47.2%
Race, ethnicity, and origin ACS 2023
- Neighborhood character
- Predominantly White (84%)
- Race & ethnicity
- White 84% Black 6% Hispanic / Latino 4% Two or more races 4% Asian 2%
- Common ancestry
- Serbian 2% Slovak 2% Romanian 1%
- Foreign-born
- 4% · Canada, China
- Languages at home
- 96% English-only · Spanish 2% Other Indo-European 1%
Political lean MEDSL · Salem
- 2024 margin
- R (+19.3) · D 39.8% · R 59.1% · Other 1.1%
- 2008→2024 swing
- -3.8pp toward R · 2008: -15.5pp · 2024: -19.3pp
- All cycles
- 2024: R+19.3 2020: R+19.4 2016: R+24.8 2012: R+20.6 2008: R+15.5
Not yet ingested
- Civics
- —
Market trends
- HPI YoY
- ▼ -259.46%
- Current HPI
- 170.8986
- Rent YoY
- ▲ 5.98%
- Metro
- Roanoke, VA
- State GDP YoY
- ▲ 2.40%
- F500 in state
- 50
Industry mix (Fortune 500 HQ in VA)
| Industry | F500 HQs | Revenue |
|---|---|---|
| Aerospace / Defense | 4 | $236B |
|
||
| Technology / Defense | 3 | $32B |
|
||
| Financial Services | 2 | $176B |
|
||
| Utilities | 2 | $27B |
|
||
| Insurance | 2 | $25B |
|
||
| Technology | 2 | $15B |
|
||
Price history
-23.2% since first listed14 events — show timeline
- 2026-05-18 Price Changed $288,000 MLSRV
- 2026-02-06 Price Changed $297,767 MLSRV
- 2026-01-05 Price Changed $303,844 MLSRV
- 2025-12-01 Relisted — MLSRV
- 2025-11-02 Pending — MLSRV
- 2025-10-08 Price Changed $310,045 MLSRV
- 2025-09-03 Price Changed $316,372 MLSRV
- 2025-08-08 Price Changed $322,829 MLSRV
- 2025-06-20 Price Changed $329,417 MLSRV
- 2025-05-16 Price Changed $336,140 MLSRV
- 2025-04-11 Price Changed $343,000 MLSRV
- 2025-03-07 Price Changed $350,000 MLSRV
- 2024-12-20 Price Changed $360,000 MLSRV
- 2024-09-23 Listed $375,000 MLSRV
Cash-flow waterfall
monthlySold comps — $/sqft
last 12 mo · ≤1 miLoading sold comps…