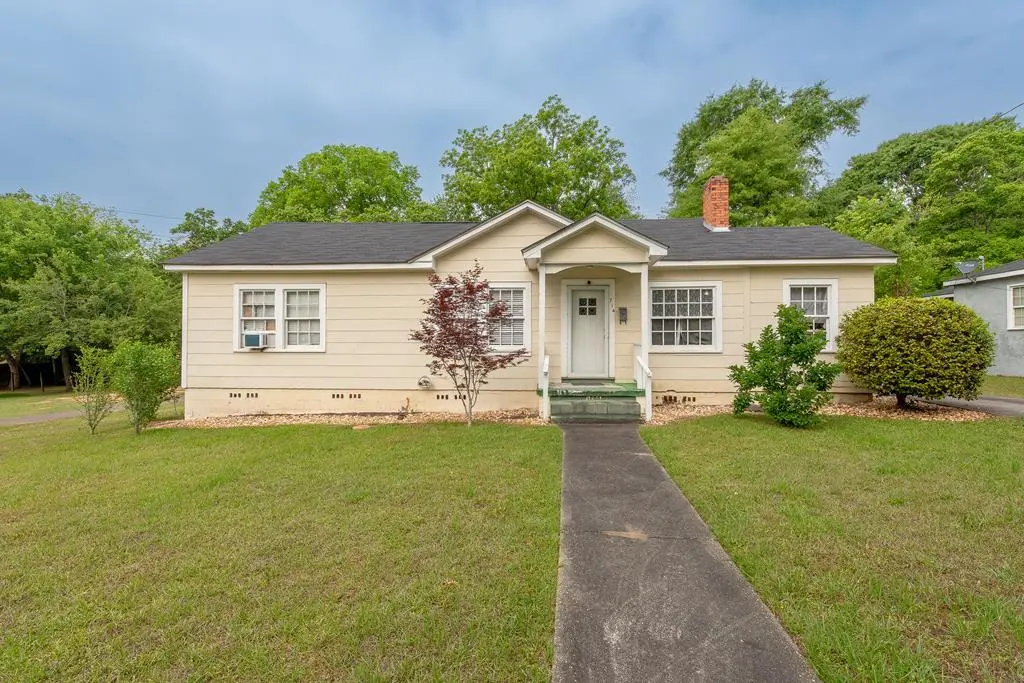
714 Dusy St · Dothan, AL
Flood risk 1/10 · Minimal
- FEMA flood zone
- X (unshaded)
- Chance of flooding over 30 yrs
- 0.0%
- Est. flood insurance / yr
- $507 – $1,088
Fire risk 1/10 · Minimal
- Est. fire insurance / yr
- $916 – $1,700
Heat risk 8/10 · Major
- Hot days now (above 107°F)
- 7 days/yr
- Hot days in 30 yrs
- 19 days/yr
Wind risk 8/10 · Major
- Chance of severe wind over 30 yrs
- 99.0%
Air-quality risk 4/10 · Minor
- Unhealthy air days now
- 5 days/yr
- Unhealthy air days in 30 yrs
- 6 days/yr
Risk factors via First Street. Map © Google.
Why this score? — see what drove the B grade
The composite is a weighted blend of 9 inputs, each scored 0–100. Each bar is that input's sub-score; the figure is the points it added to the 100-point composite (weight × sub-score).
- Cash flow +28.9/30.0
- ARV discount +15.0/15.0
- DSCR +10.0/10.0
- 1% rule +6.7/10.0
- Livability +3.2/5.0
- Rent growth +2.5/5.0
- Schools +2.5/10.0
- Condition / age +2.5/5.0
- Appreciation +0.0/10.0
$94,500
🖨 Deal sheet 📄 Offer letter ✓ Due diligence
Listing remarks
Charming traditional cottage full of character and timeless appeal. This cozy three bedroom, one bath home offers 1279 ft. of inviting living space, including a lovely enclosed porch perfect for morning coffee or relaxing evenings. This home blends classic charm with thoughtful updates, including a newer roof, just two years old. Nestled on a spacious 0.26 acre lot- There's plenty of room to enjoy the outdoors, garden, or entertain. Whether you're looking for your first time home, or quaint retreat, this adorable cottage is full of warmth and potential.
Key facts
- Newer roof
- Spacious lot
- Enclosed porch
Tags
Property features AI
Exterior
- Parking: No garage
- Utilities: Public water; Public sewer
- Home design: Single-family residence; One story
- Construction: Fiber cement and other exterior materials; Built with one level
- Exterior features: On waterfront; No patio or porch
Interior
- Kitchen: Cooktop; Oven; Refrigerator
- Flooring: Wood; Laminate
- Bathrooms: 1 full bathroom
- Interior features: Double-pane windows; Fireplace (1)
Neighborhood map
What this means for you Summary
Snapshot
- This is a 3-bed/1.0-bath single-family listed at $94k.
Deal economics
- At list price, monthly cash flow is $322 ($4k/yr) — positive.
- The deal already cash-flows at list — no discount required.
- Meets the 1% rule at list price ($1k rent vs $94k).
- Recommended offer: $93k (1.5% below list) — sets the bar for market timing.
- Cap rate 10.4% vs local median 4.4% in Dothan — top-decile yield for the area; either an underpriced asset or a hidden risk that comps aren't pricing in. Stress-test before assuming the spread holds.
Location & tenants
- Location reads 64/100 on livability (#146 in AL) — a middle-class / working-renter tenant base. Strengths: cost of living A+, housing A+, health & safety A+; Watch: schools D+, employment D, crime F.
- Dothan City (urban): math 19% / reading 39% proficiency, ranked #73 of 129 in AL (top 57%) — low school quality limits family demand, transient renter base, plan for 1-2y turnover.
- Market conditions: 410 active listings in the ZIP; 12 comparable units currently listed for rent nearby; rentals lingering (median 44d on market — plan ~5-8 weeks vacancy on turnover, expect pricing pressure); 100% of comp listings sitting > 30 days — soft ceiling on asking rent; 463 units permitted in Houston County in 2024 (96 in 5+ unit buildings).
Forward outlook
- Local home prices are declining (-3.0%/yr); year-one equity from $653 of loan paydown is wiped out by about $3k of value loss. Plan a longer hold.
- Houston County population projected at +7% by 2050 — modest demand growth; plan on rents tracking national, not racing it.
- At projected returns (-3.0% appreciation + 3.0% rent growth), your $26k cash investment doubles in ~9 years — after that, you're playing with house money.
Negotiation context
- It's been on market 17 days — a 2% lower offer ($93k) is reasonable based on typical stale-listing flexibility.
Risks & watch-outs
- Watch-outs: built in 1946 — expect roof / HVAC / electrical / plumbing capex.
- Climate carrying-cost: severe wind risk, 99% chance of damaging wind over 30y; extreme-heat days projected 7→19/yr by 2055 (HVAC capex compounding) — expect insurance premiums to compound above CPI over the hold.
Questions for the listing agent
- Built in 1946 — when were the roof, HVAC, electrical panel, plumbing, and water heater last replaced?
- Is there a deadline driving the sale (1031 exchange, divorce, estate, relocation)? That informs how much negotiation room exists.
- Schools are D-rated, which usually means shorter tenancies and higher turnover. Who's the typical renter profile here, and what's been the actual vacancy rate?
- Crime grade is F in this area — have there been break-ins, vandalism, or insurance claims at this property in the last 3 years? What carrier currently insures it and at what premium?
- What's the average days-on-market for RENTAL listings here right now (not sales)? A rising rental-DOM trend means longer vacancies and softer asking-rent achievability than the comps imply.
- What's the recent tenant-quality profile in this submarket — average credit score on applications, eviction rate, late-payment / NSF rate, and stable-employment percentage? A property-management company in the area should have these aggregated.
- How much new for-sale + rental construction is in the pipeline within 1–3 miles? Heavy new supply typically softens prices + rents 12–24 months out; constrained supply supports both.
Investment metrics
- 1% rule
- 1.17% ✓
- Cap rate
- 10.38%
- Cash-on-cash
- 14.58%
- DSCR
- 1.65
- GRM
- 7.1
CMA / ARV
- ARV (median comp)
- $116,511
- List price
- $94,500
- Delta
- -18.89%
- Verdict
- UNDERPRICED
- Comps
- 20 within 1.0 mi
Show comp detail 12 sales within ~0.75 mi
| Address | Dist | Beds/Ba | Sqft | Sold | Price | $/sf | Match |
|---|---|---|---|---|---|---|---|
| 303 Lakeview Dr | 0.20mi | 3/1.5 | 1,244 (-3%) | 10mo | $97,500 | $78 | 76 |
| 901 S Bell St | 0.32mi | 3/1.0 | 1,248 (-2%) | 12mo | $93,000 | $75 | 71 |
| 803 Dogwood Trl | 0.32mi | 3/2.0 | 1,225 (-4%) | 6mo | $105,000 | $86 | 69 |
| 607 Arlington Ave | 0.67mi | 4/1.0 (+1) | 1,278 (-0%) | 1mo | $55,000 | $43 | 63 |
| 803 Dogwood Trl | 0.32mi | 3/2.0 | 1,410 (+10%) | 6mo | $105,000 | $74 | 59 |
| 1022 S Lena St | 0.22mi | 3/1.0 | 1,137 (-11%) | 17mo | $90,000 | $79 | 57 |
| 707 S Lena St | 0.08mi | 2/1.0 (-1) | 1,101 (-14%) | 14mo | $50,000 | $45 | 56 |
| 1636 S Alice St | 0.48mi | 2/1.5 (-1) | 1,304 (+2%) | 17mo | $55,000 | $42 | 54 |
| 1117 Alpine Ln | 0.67mi | 3/1.0 | 1,370 (+7%) | 10mo | $110,000 | $80 | 49 |
| 706 Westmead St A & B St | 0.68mi | 2/2.0 (-1) | 1,102 (-14%) | 0mo | $20,000 | $18 | 36 |
| 1125 Garden Ln | 0.75mi | 3/1.5 | 1,120 (-12%) | 9mo | $132,000 | $118 | 35 |
| 618 Langley Dr | 0.71mi | 2/1.0 (-1) | 1,100 (-14%) | 11mo | $90,000 | $82 | 30 |
Match score weights: distance 35% · size 25% · config 20% · recency 20%. Top-matched comps best support the ARV.
Projected returns pro-forma
-3.0% appreciation · 3.0% rent growth · sell at horizon
- IRR
- 5.0%
- Equity multiple
- 1.19×
- Total profit
- $5,124
- Equity at exit
- $14,090
- IRR
- 14.4%
- Equity multiple
- 2.16×
- Total profit
- $30,651
- Equity at exit
- $8,171
Cash invested: $26,460 (down + closing). Projections, not guarantees.
Landlord ↔ Tenant lean methodology
- Overall (STATE)
- 90 Strongly Landlord-Friendly
- State Alabama
- 90 Strongly Landlord-Friendly · R+15
- County
- — inherits STATE
- City
- — inherits STATE
ZIP-level market 36301
- Home prices YoY
- -24.9%
- Active inventory
- 410
- Price-to-rent
- 7.1×
Monthly cashflow live
- Estimated rent
- $1,105 high interval (Pro) →
- Mortgage (P&I)
- −$496
- Tax from tax record
- −$17 /mo · $200/yr
- Insurance
- −$39
- HOA
- −$0
- Vacancy / Maint / Mgmt
- −$232
- Net cashflow
- $322
Break-even live
UW: 25.0% down · 7.5% · 30yr · 1.5% tax · 5.0% vac · 8.0% maint · 8.0% mgmt
Financing live
Cash to close
- Down payment
- $23,625
- Closing costs
- $2,835
- Reserves months
- —
- Total cash needed
- —
Loan-product check · same deal, 3 products live
Conventional
25% down · 7.5% · 30yr
- Down + closing
- —
- Monthly P&I
- —
- Monthly cashflow
- —
- DSCR
- —
- Eligible?
- —
Personal DTI + credit; lowest rate.
DSCR
20% down · 8.5% · 30yr
- Down + closing
- —
- Monthly P&I
- —
- Monthly cashflow
- —
- DSCR
- —
- Eligible?
- —
No personal income docs; deal must DSCR.
Hard money
10% down · 12.0% · 12mo
- Down + closing
- —
- Monthly P&I
- —
- Monthly cashflow
- —
- DSCR
- —
- Eligible?
- —
Short-term bridge; refi at stabilization.
Rent comps 12 comps
| Address | Beds | Baths | Sqft | Rent | $/sqft | DOM | Units | Dist |
|---|---|---|---|---|---|---|---|---|
| 310 W Lafayette St Dothan, AL | 3.0 | 1.0 | 1459 | $995 | $0.68 | 43d | 1 | 0.39mi |
| 806 S Ussery St Dothan, AL | 3.0 | 1.0 | 934 | $895 | $0.96 | 43d | 1 | 0.50mi |
| 193 S Saint Andrews St Dothan, AL | 2.0 | 2.0 | 1100 | $2,100 | $1.91 | 43d | 1 | 0.63mi |
| 403 Holly Ln Dothan, AL | 2.0 | 1.0–2.0 | 1175 | $1,350 | $1.15 | 43d | 4 | 0.87mi |
| 803 E Adams St Dothan, AL | 4.0 | 2.0 | 1564 | $1,350 | $0.86 | 43d | 1 | 1.14mi |
| 1000 Fairlane Dr Dothan, AL | 3.0 | 2.0 | 1500 | $1,200 | $0.80 | 43d | 1 | 1.17mi |
| 2004 Roebuck St Dothan, AL | 3.0 | 1.5 | 1609 | $1,175 | $0.73 | 43d | 1 | 1.24mi |
| 1009 Jonathan St Dothan, AL | 3.0 | 1.5 | 1318 | $1,300 | $0.99 | 43d | 1 | 1.31mi |
| 306 Mustang Dr Dothan, AL | 3.0 | 1.0 | 1301 | $1,050 | $0.81 | 43d | 1 | 1.37mi |
| 1301 Alexander Dr Dothan, AL | 1.0–2.0 | 1.0–1.5 | 833 | $795 | $0.95 | 43d | 1 | 1.37mi |
| 131 Hedstrom Dr Greenwood, AL | 3.0 | 2.0 | 1526 | $1,400 | $0.92 | 43d | 1 | 1.43mi |
| 1658 W Main St Dothan, AL | 2.0 | 1.0 | 1000 | $875 | $0.88 | 43d | 1 | 1.48mi |
Listing history 2 events
-
2026-05-11status Pending 559-char remark
-
2026-04-24$94,500 Active 559-char remark
ⓘ Source: listings_history table (triggers on properties + properties_extension) + one-shot
backfill from property_details.listing_events for pre-trigger history.
Tax reassessment forecast AL · Resets to sale price
- Current annual tax
- $200 · $17/mo
- Projected year-2 tax
- $387 · $32/mo
- Expected delta
- +$188/yr (+$16/mo · 93.8%)
ⓘ Screening estimate from a state-policy table — verify with the county assessor before closing.
Climate risk First Street
- Flood 1/10 Low FEMA zone X (unshaded) · 0% chance over 30 yrs
- Wildfire 1/10 Low
- Heat 8/10 Severe 7 d/yr ≥107°F today · 19 d/yr by 30 yrs out
- Wind 8/10 Severe 99% chance of damaging wind over 30 yrs
- Air quality 4/10 Moderate 5 unhealthy d/yr today · 6 by 30 yrs out
Nearby sold comps map
Loading sold comps map…
Walkable amenities ~0.75 mi
Loading nearby amenities…
Taxation est. · year 1
- Rental income
- $13,264
- − Mortgage interest
- −$5,293
- − Property taxes
- −$200
- − Insurance
- −$472
- − Repairs & maintenance
- −$1,061
- − Management
- −$1,061
- − Depreciation
- −$2,749
- Taxable income
- $2,427
- Est. tax owed @ 24.0%
- −$582
- After-tax cash flow
- $3,277/yr
For passive investors: Depreciation is non-cash, so a rental often shows a tax loss while cash-flowing — sheltering income. Rental losses are passive: they offset passive income freely, and up to $25,000/yr can offset ordinary (W-2) income if you actively participate and your MAGI is under $100k (phasing out to $0 by $150k); unused losses carry forward. On sale, claimed depreciation is recaptured at up to 25%, and gains may owe capital-gains tax (a 1031 exchange can defer both). Figures are a year-1 estimate at your 24.0% rate — not tax advice; consult a CPA.
Schools (NCES district)
- District
- Dothan City
- NCES district ID
- 0101230
- Math proficiency
- 19% ▼ -23.00%
- Reading proficiency
- 39% ▼ -3.00%
- Median HH income
- $42,279
- Composite
- 24.56/100
- National rank
- #7640
- State rank
- #73 of 129 in AL
Livability — Dothan
- Score
- 64/100
- State rank
- #146
- US rank
- #13662
Category grades
Schools grade is shown separately in the Schools card above.
Census & demographics
- Census place
- Dothan, AL
- City population
- 47,783
- Population (ZIP)
- 38,627
Population outlook (Houston County) Hauer SSP2
- Today (2025)
- 110,280 people
- By 2030
- 112,668 · +2.2%
- By 2040
- 116,149 · +5.3%
- By 2050
- 117,805 · +6.8%
- By 2075
- 118,577 · +7.5%
- By 2100
- 110,940 · +0.6%
Race, ethnicity, and origin ACS 2023
- Neighborhood character
- Diverse neighborhood (Simpson 0.55)
- Race & ethnicity
- White 59% Black 31% Hispanic / Latino 5% Two or more races 5%
- Hispanic origin (detail)
- Mexican 3%
- Common ancestry
- Slovak 1% Italian 1% Lithuanian 1%
- Foreign-born
- 3% · Canada
- Languages at home
- 95% English-only · Spanish 4%
Political lean MEDSL · Houston
- 2024 margin
- Solid R (+47.8) · D 25.7% · R 73.5%
- 2008→2024 swing
- -7.0pp toward R · 2008: -40.8pp · 2024: -47.8pp
- All cycles
- 2024: R+47.8 2020: R+42.7 2016: R+47.6 2012: R+40.3 2008: R+40.8
Not yet ingested
- Civics
- —
Market trends
- HPI YoY
- ▼ -53.46%
- Current HPI
- 161.1212
- Rent YoY
- —
- Metro
- —
- State GDP YoY
- ▲ 2.94%
- F500 in state
- 4
Industry mix (Fortune 500 HQ in AL)
| Industry | F500 HQs | Revenue |
|---|---|---|
| Financial Services | 1 | $8B |
|
||
| Healthcare | 1 | $5B |
|
||
Price history
2 events — show timeline
- 2026-05-11 Pending — SAMLS
- 2026-04-24 Listed $94,500 SAMLS
Property tax history
-3.8%/yrLatest (2025): $200 · +3.7% YoY. Source: county tax records.
Cash-flow waterfall
monthlySold comps — $/sqft
last 12 mo · ≤1 miLoading sold comps…