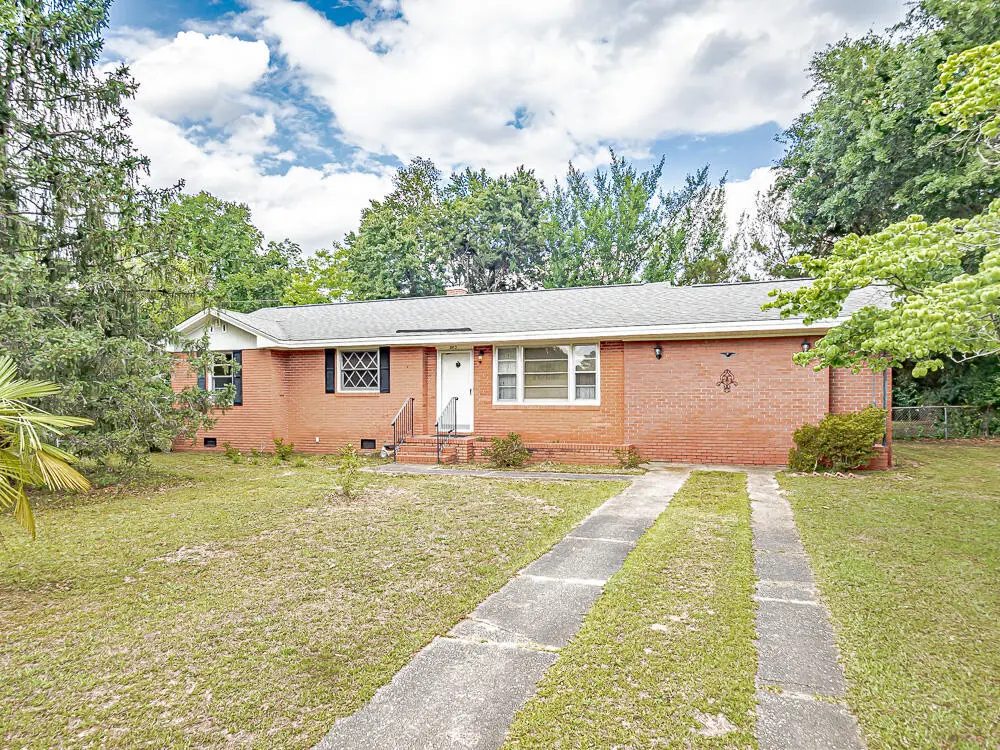
883 Watts Dr · Sumter, SC
Flood risk 1/10 · Minimal
- FEMA flood zone
- X (unshaded)
- Chance of flooding over 30 yrs
- 0.0%
- Est. flood insurance / yr
- $507 – $1,088
Fire risk 5/10 · Moderate
- Est. fire insurance / yr
- $783 – $1,453
Heat risk 7/10 · Major
- Hot days now (above 108°F)
- 7 days/yr
- Hot days in 30 yrs
- 16 days/yr
Wind risk 8/10 · Major
- Chance of severe wind over 30 yrs
- 80.0%
Air-quality risk 2/10 · Minimal
- Unhealthy air days now
- 2 days/yr
- Unhealthy air days in 30 yrs
- 2 days/yr
Risk factors via First Street. Map © Google.
Why this score? — see what drove the B- grade
The composite is a weighted blend of 9 inputs, each scored 0–100. Each bar is that input's sub-score; the figure is the points it added to the 100-point composite (weight × sub-score).
- Cash flow +30.0/30.0
- 1% rule +10.0/10.0
- DSCR +10.0/10.0
- ARV discount +7.5/15.0
- Rent growth +3.5/5.0
- Livability +3.0/5.0
- Condition / age +2.5/5.0
- Schools +1.9/10.0
- Appreciation +0.0/10.0
$100,000
🖨 Deal sheet 📄 Offer letter ✓ Due diligence
Listing remarks
This 3 bedroom brick home is located in a nice neighborhood and located minutes to everything in Sumter. It's a great fixer upper for a couple looking for their first home or a great investment property! Storage building in the backyard and also offers a fenced in backyard. Home is being sold AS IS. No kitchen appliances & HVAC does not work, Inspections are for buyers information only.
Key facts
- Storage building
- Fenced in backyard
- Brick home
Tags
Property features AI
Exterior
- Parking: Public paved road access (public maintained road)
- Utilities: Public water; Septic tank
- Home design: Single-family house; One-level
- Construction: Brick construction; Shingle roof
- Exterior features: Patio; Chain link fencing; Shed(s)
Interior
- Kitchen: No built-in appliances listed
- Bedrooms: 6 total rooms (includes bedrooms and living spaces)
- Flooring: Hardwood; Linoleum
- Bathrooms: 1 full bathroom
- Heating & cooling: No heating; No cooling
- Interior features: Eat-in kitchen; Crawl space basement
- Laundry & utility: Washer hookup; Electric dryer hookup
Neighborhood map
What this means for you Summary
Snapshot
- This is a 3-bed/1.0-bath single-family listed at $100k.
Deal economics
- At list price, monthly cash flow is $845 ($10k/yr) — positive.
- The deal already cash-flows at list — no discount required.
- Meets the 1% rule at list price ($2k rent vs $100k).
- Cap rate 16.4% vs local median 3.4% in Sumter — top-decile yield for the area; either an underpriced asset or a hidden risk that comps aren't pricing in. Stress-test before assuming the spread holds.
Location & tenants
- Location reads 59/100 on livability (#235 in SC) — a working-class tenant base; expect higher turnover. Strengths: cost of living A+, health & safety A+, housing A-; Watch: crime F, amenities F, commute F.
- Sumter 01 (urban): math 18% / reading 28% proficiency, ranked #64 of 80 in SC (top 80%) — low school quality limits family demand, transient renter base, plan for 1-2y turnover; 64% free/reduced lunch — lower-income household profile, screen leases tightly.
- Zoned schools: Wilder Elementary (math 22% / reading 22%, grade F, #475 of 597 statewide, top 81%, 376 students, 100% FRL); Bates Middle (math 9% / reading 21%, grade F, #202 of 229 statewide, top 89%, 569 students, 100% FRL); Sumter High School (math 22% / reading 67%, grade F, #166 of 196 statewide, top 87%, 2,289 students, 100% FRL) — zoned schools average 100% FRL vs 64% district-wide (36 pts higher); higher-poverty schools than district average — tighter screening recommended.
- Market conditions: Rents rising fast (+4.2%/yr); 229 active listings in the ZIP; 386 units permitted in Sumter County in 2024 (0 in 5+ unit buildings).
- This rent runs 35% of the median local income ($63k/yr) — at the standard rent-burdened threshold; future hikes will face affordability resistance.
Forward outlook
- Local home prices are declining (-3.0%/yr); year-one equity from $691 of loan paydown is wiped out by about $3k of value loss. Plan a longer hold.
- Sumter County population projected at -14% by 2050 — secular population decline; favor cash flow + early exit over multi-decade hold.
- At projected returns (-3.0% appreciation + 4.2% rent growth), your $28k cash investment doubles in ~4 years — after that, you're playing with house money.
Negotiation context
- Only 4 days on market — expect competitive offers; lowballing is unlikely to land.
Risks & watch-outs
- Climate carrying-cost: severe wind risk, 80% chance of damaging wind over 30y; moderate wildfire risk; extreme-heat days projected 7→16/yr by 2055 (HVAC capex compounding) — expect insurance premiums to compound above CPI over the hold.
Questions for the listing agent
- Built in 1963 — when were the roof, HVAC, electrical panel, plumbing, and water heater last replaced?
- Is there a deadline driving the sale (1031 exchange, divorce, estate, relocation)? That informs how much negotiation room exists.
- Schools are D-rated, which usually means shorter tenancies and higher turnover. Who's the typical renter profile here, and what's been the actual vacancy rate?
- Crime grade is F in this area — have there been break-ins, vandalism, or insurance claims at this property in the last 3 years? What carrier currently insures it and at what premium?
- What's the average days-on-market for RENTAL listings here right now (not sales)? A rising rental-DOM trend means longer vacancies and softer asking-rent achievability than the comps imply.
- What's the recent tenant-quality profile in this submarket — average credit score on applications, eviction rate, late-payment / NSF rate, and stable-employment percentage? A property-management company in the area should have these aggregated.
- How much new for-sale + rental construction is in the pipeline within 1–3 miles? Heavy new supply typically softens prices + rents 12–24 months out; constrained supply supports both.
Investment metrics
- 1% rule
- 1.82% ✓
- Cap rate
- 16.43%
- Cash-on-cash
- 36.22%
- DSCR
- 2.61
- GRM
- 4.6
CMA / ARV
- ARV (on-the-fly)
- $206,417
- Comps found
- 12
Show comp detail 12 sales within ~0.75 mi
| Address | Dist | Beds/Ba | Sqft | Sold | Price | $/sf | Match |
|---|---|---|---|---|---|---|---|
| 2665 Mccrays Mill Rd | 0.25mi | 3/1.0 | 1,343 (-2%) | 1mo | $172,500 | $128 | 84 |
| 120 Wells Ct | 0.38mi | 3/1.5 | 1,365 (-0%) | 7mo | $118,800 | $87 | 75 |
| 2629 Hilldale Dr | 0.21mi | 3/2.0 | 1,253 (-8%) | 2mo | $178,000 | $142 | 71 |
| 2465 Edmunds Dr | 0.47mi | 3/2.0 | 1,456 (+6%) | 11mo | $200,000 | $137 | 54 |
| 2435 Stadium Rd | 0.75mi | 3/2.0 | 1,407 (+3%) | 7mo | $212,000 | $151 | 50 |
| 794 Pitts Rd | 0.60mi | 3/2.0 | 1,448 (+6%) | 10mo | $200,000 | $138 | 50 |
| 747 Bay Springs Dr | 0.49mi | 3/2.0 | 1,565 (+14%) | 1mo | $257,000 | $164 | 48 |
| 2411 Orvis St | 0.42mi | 3/2.0 | 1,571 (+15%) | 5mo | $249,900 | $159 | 47 |
| 2425 Stadium Rd | 0.74mi | 3/2.0 | 1,477 (+8%) | 7mo | $190,000 | $129 | 42 |
| 1055 Kentwood Dr | 0.54mi | 3/2.0 | 1,559 (+14%) | 10mo | $240,000 | $154 | 39 |
| 3075 Foxcroft Cir | 0.61mi | 3/2.0 | 1,555 (+14%) | 8mo | $249,900 | $161 | 38 |
| 3200 Foxcroft Cir | 0.72mi | 3/2.0 | 1,561 (+14%) | 9mo | $250,000 | $160 | 31 |
Match score weights: distance 35% · size 25% · config 20% · recency 20%. Top-matched comps best support the ARV.
Projected returns pro-forma
-3.0% appreciation · 4.19% rent growth · sell at horizon
- IRR
- 33.2%
- Equity multiple
- 2.42×
- Total profit
- $39,783
- Equity at exit
- $14,910
- IRR
- 40.8%
- Equity multiple
- 5.04×
- Total profit
- $113,051
- Equity at exit
- $8,646
Cash invested: $28,000 (down + closing). Projections, not guarantees.
Landlord ↔ Tenant lean methodology
- Overall (STATE)
- 90 Strongly Landlord-Friendly
- State South Carolina
- 90 Strongly Landlord-Friendly · R+6
- County
- — inherits STATE
- City
- — inherits STATE
ZIP-level market 29154
- Home prices YoY
- -32.7%
- Rents YoY
- 4.2%
- Active inventory
- 229
- Price-to-rent
- 4.6×
Monthly cashflow live
- Estimated rent
- $1,815 medium interval (Pro) →
- Mortgage (P&I)
- −$524
- Tax from tax record
- −$23 /mo · $273/yr
- Insurance
- −$42
- HOA
- −$0
- Vacancy / Maint / Mgmt
- −$381
- Net cashflow
- $845
Break-even live
UW: 25.0% down · 7.5% · 30yr · 1.5% tax · 5.0% vac · 8.0% maint · 8.0% mgmt
Financing live
Cash to close
- Down payment
- $25,000
- Closing costs
- $3,000
- Reserves months
- —
- Total cash needed
- —
Loan-product check · same deal, 3 products live
Conventional
25% down · 7.5% · 30yr
- Down + closing
- —
- Monthly P&I
- —
- Monthly cashflow
- —
- DSCR
- —
- Eligible?
- —
Personal DTI + credit; lowest rate.
DSCR
20% down · 8.5% · 30yr
- Down + closing
- —
- Monthly P&I
- —
- Monthly cashflow
- —
- DSCR
- —
- Eligible?
- —
No personal income docs; deal must DSCR.
Hard money
10% down · 12.0% · 12mo
- Down + closing
- —
- Monthly P&I
- —
- Monthly cashflow
- —
- DSCR
- —
- Eligible?
- —
Short-term bridge; refi at stabilization.
Listing history 2 events
-
2026-05-22status Pending
-
2026-05-18$100,000 Active
ⓘ Source: listings_history table (triggers on properties + properties_extension) + one-shot
backfill from property_details.listing_events for pre-trigger history.
Tax reassessment forecast SC · Resets to sale price
- Current annual tax
- $273 · $23/mo
- Projected year-2 tax
- $570 · $48/mo
- Expected delta
- +$297/yr (+$25/mo · 108.7%)
ⓘ Screening estimate from a state-policy table — verify with the county assessor before closing.
Climate risk First Street
- Flood 1/10 Low FEMA zone X (unshaded) · 0% chance over 30 yrs
- Wildfire 5/10 Major
- Heat 7/10 Severe 7 d/yr ≥108°F today · 16 d/yr by 30 yrs out
- Wind 8/10 Severe 80% chance of damaging wind over 30 yrs
- Air quality 2/10 Low 2 unhealthy d/yr today · 2 by 30 yrs out
Nearby sold comps map
Loading sold comps map…
Walkable amenities ~0.75 mi
Loading nearby amenities…
Taxation est. · year 1
- Rental income
- $21,781
- − Mortgage interest
- −$5,602
- − Property taxes
- −$273
- − Insurance
- −$500
- − Repairs & maintenance
- −$1,742
- − Management
- −$1,742
- − Depreciation
- −$2,909
- Taxable income
- $9,012
- Est. tax owed @ 24.0%
- −$2,163
- After-tax cash flow
- $7,978/yr
For passive investors: Depreciation is non-cash, so a rental often shows a tax loss while cash-flowing — sheltering income. Rental losses are passive: they offset passive income freely, and up to $25,000/yr can offset ordinary (W-2) income if you actively participate and your MAGI is under $100k (phasing out to $0 by $150k); unused losses carry forward. On sale, claimed depreciation is recaptured at up to 25%, and gains may owe capital-gains tax (a 1031 exchange can defer both). Figures are a year-1 estimate at your 24.0% rate — not tax advice; consult a CPA.
Schools (NCES district)
- District
- Sumter 01
- NCES district ID
- 4503902
- Math proficiency
- 18% ▼ -13.00%
- Reading proficiency
- 28% ▼ -6.00%
- Median HH income
- $40,423
- Composite
- 19.45/100
- National rank
- #8775
- State rank
- #64 of 80 in SC
Livability — Sumter
- Score
- 59/100
- State rank
- #235
- US rank
- #19754
Category grades
Schools grade is shown separately in the Schools card above.
Census & demographics
- County
- Sumter County · 76,912 people
- City population
- 67,992
- Metro
- Sumter, SC
- Population (ZIP)
- 29,454
- Household income
- $62,772
- Rent vs Own
- Severe rent burden
- 338.0
Population outlook (Sumter County) Hauer SSP2
- Today (2025)
- 104,585 people
- By 2030
- 102,282 · -2.2%
- By 2040
- 96,258 · -8.0%
- By 2050
- 89,592 · -14.3%
- By 2075
- 74,715 · -28.6%
- By 2100
- 60,235 · -42.4%
Race, ethnicity, and origin ACS 2023
- Neighborhood character
- Diverse neighborhood (Simpson 0.59)
- Race & ethnicity
- White 53% Black 36% Two or more races 8% Hispanic / Latino 4% Asian 1%
- Common ancestry
- Italian 2% Serbian 2% Slovak 2%
- Foreign-born
- 2% · Canada
- Languages at home
- 96% English-only · Spanish 2% Tagalog/Filipino 1%
Political lean MEDSL · Sumter
- 2024 margin
- Toss-up / Even · D 51.9% · R 47.0% · Other 1.2%
- 2008→2024 swing
- -10.6pp toward R · 2008: 15.4pp · 2024: 4.9pp
- All cycles
- 2024: D+4.9 2020: D+13.0 2016: D+12.0 2012: D+17.5 2008: D+15.4
Not yet ingested
- Civics
- —
Market trends
- HPI YoY
- ▼ -76.65%
- Current HPI
- 157.8545
- Rent YoY
- ▲ 4.19%
- Metro
- Sumter, SC
- State GDP YoY
- ▲ 4.51%
- F500 in state
- 2
Industry mix (Fortune 500 HQ in SC)
| Industry | F500 HQs | Revenue |
|---|---|---|
| Packaging | 1 | $7B |
|
||
Price history
2 events — show timeline
- 2026-05-22 Pending — SBOR
- 2026-05-18 Listed $100,000 SBOR
Property tax history
+3.6%/yrLatest (2025): $273 · +0.6% YoY. Source: county tax records.
Cash-flow waterfall
monthlySold comps — $/sqft
last 12 mo · ≤1 miLoading sold comps…