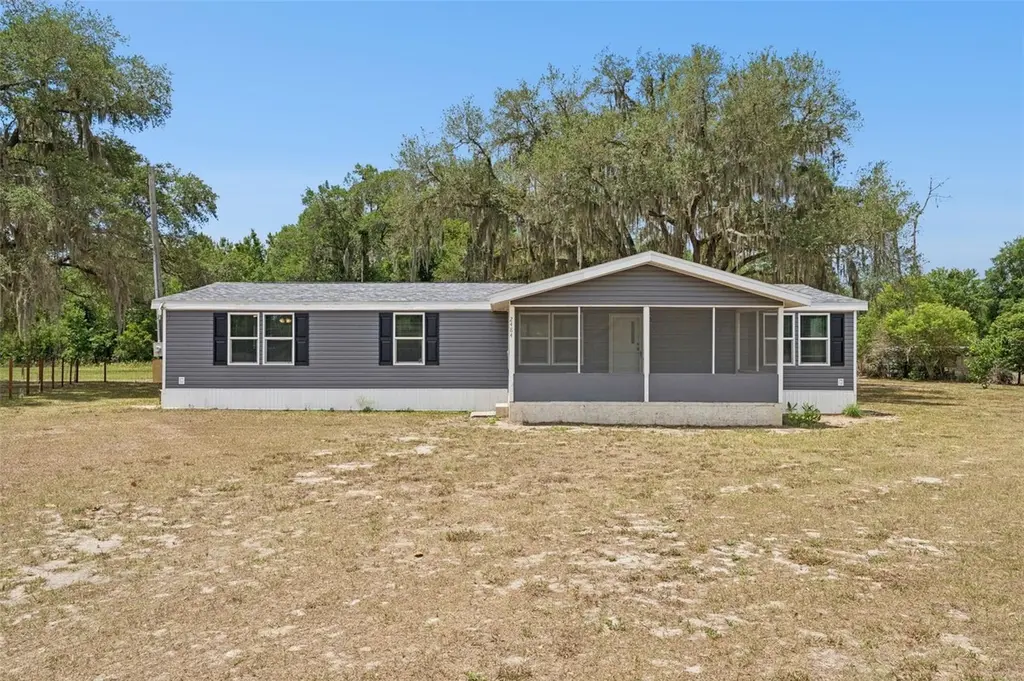
2484 Gator Ln · Mascotte, FL
Flood risk 1/10 · Minimal
- FEMA flood zone
- X (unshaded)
- Chance of flooding over 30 yrs
- 0.0%
- Est. flood insurance / yr
- $507 – $1,088
Fire risk 7/10 · Major
- Est. fire insurance / yr
- $947 – $1,759
Heat risk 8/10 · Major
- Hot days now (above 108°F)
- 7 days/yr
- Hot days in 30 yrs
- 23 days/yr
Wind risk 9/10 · Severe
- Chance of severe wind over 30 yrs
- 99.0%
Air-quality risk 2/10 · Minimal
- Unhealthy air days now
- 1 days/yr
- Unhealthy air days in 30 yrs
- 1 days/yr
Risk factors via First Street. Map © Google.
Why this score? — see what drove the D grade
The composite is a weighted blend of 9 inputs, each scored 0–100. Each bar is that input's sub-score; the figure is the points it added to the 100-point composite (weight × sub-score).
- Cash flow +19.5/30.0
- DSCR +6.2/10.0
- 1% rule +4.2/10.0
- Schools +4.2/10.0
- Livability +3.6/5.0
- Rent growth +2.9/5.0
- Condition / age +2.5/5.0
- ARV discount +1.7/15.0
- Appreciation +0.0/10.0
$260,000
🖨 Deal sheet 📄 Offer letter ✓ Due diligence
Listing remarks
Under contract-accepting backup offers. Tucked away from the noise and fast pace of the city, this beautifully updated double-wide mobile home offers the peaceful country lifestyle so many are searching for. Situated on over an acre of land spanning two separate parcels with individual folio numbers, this property gives you room to breathe, spread out, and enjoy the quiet charm of rural living without feeling crowded by the city. The home has been thoughtfully updated and features a brand-new roof installed in 2025, along with new siding and updated flooring that give the property a fresh and welcoming feel. Whether you're looking for space for your toys, animals, gardening, or simply a lit
Key facts
- New siding
- Two separate parcels
- Brand-new roof
Tags
Property features AI
Finance
- Other: Property type: Residential; Has additional parcels; Zoning: A; Lot size approximately 0.58 acres (about 1 to less than 2 acres reported)
- Financial info: No lease restrictions; Homesteaded
- HOA & community: No HOA
Exterior
- Parking: No parking details provided
- Security: No security details provided
- Utilities: Well water; Septic tank; Other utilities
- Home design: Manufactured double-wide home; Single-story; North-facing
- Construction: Vinyl siding and frame construction; Shingle roof; Other foundation details; Built as manufactured home
- Exterior features: Other exterior features; Dirt road access
Interior
- Kitchen: Includes appliances
- Bedrooms: 3 bedrooms
- Flooring: Other flooring
- Bathrooms: 2 full bathrooms
- Heating & cooling: Other heating; Central air conditioning
- Interior features: Wood-burning fireplace; Other interior features
- Laundry & utility: Laundry closet; Washer; Dryer
Neighborhood map
What this means for you Summary
Snapshot
- This is a 3-bed/2.0-bath manufactured listed at $260k.
Deal economics
- At list price, monthly cash flow is $293 ($4k/yr) — positive.
- The deal already cash-flows at list — no discount required.
- To meet the 1% rule (rent ≥ 1% of price), the offer needs to be $239k (8.2% below list).
- Recommended offer: $239k (8.2% below list) — sets the bar for 1% rule.
- Cap rate 7.6% vs local median 4.8% in Mascotte — top-decile yield for the area; either an underpriced asset or a hidden risk that comps aren't pricing in. Stress-test before assuming the spread holds.
Location & tenants
- Location reads 71/100 on livability (#405 in FL) — a middle-class / working-renter tenant base. Strengths: cost of living A+, housing A+, health & safety A+; Watch: schools D-, amenities F, commute F.
- Lake (suburban): math 49% / reading 50% proficiency, ranked #37 of 73 in FL (top 51%) — families likely to look elsewhere, expect single-tenant / working-renter base with shorter leases.
- Market conditions: Rents rising (+1.7%/yr); 585 active listings in the ZIP; solid renter incomes; 4,799 units permitted in Lake County in 2024 (814 in 5+ unit buildings).
- This rent runs 32% of the median local income ($91k/yr) — at the standard rent-burdened threshold; future hikes will face affordability resistance.
Forward outlook
- Local home prices are declining (-3.0%/yr); year-one equity from $2k of loan paydown is wiped out by about $8k of value loss. Plan a longer hold.
- Lake County population projected at +37% by 2050 — long-run rental-demand tailwind backs the buy-and-hold thesis.
Negotiation context
- Only 1 days on market — expect competitive offers; lowballing is unlikely to land.
- 8 sale attempts with the ask held roughly flat each time — persistent listings suggest the price (not the market) is what's stuck; bring a comps-based counter.
- Current owner paid $180k; 44% above their basis — modest negotiation headroom, anchor on the comps not their cost.
Risks & watch-outs
- Climate carrying-cost: severe wind risk, 99% chance of damaging wind over 30y; major wildfire risk; extreme-heat days projected 7→23/yr by 2055 (HVAC capex compounding) — expect insurance premiums to compound above CPI over the hold.
Questions for the listing agent
- Is there a deadline driving the sale (1031 exchange, divorce, estate, relocation)? That informs how much negotiation room exists.
- Schools are D-rated, which usually means shorter tenancies and higher turnover. Who's the typical renter profile here, and what's been the actual vacancy rate?
- The area grade is low — what's the realistic commute time and amenity access for the typical tenant pool here? Any planned neighborhood developments (good or bad) we should know about?
- What's the average days-on-market for RENTAL listings here right now (not sales)? A rising rental-DOM trend means longer vacancies and softer asking-rent achievability than the comps imply.
- What's the recent tenant-quality profile in this submarket — average credit score on applications, eviction rate, late-payment / NSF rate, and stable-employment percentage? A property-management company in the area should have these aggregated.
- How much new for-sale + rental construction is in the pipeline within 1–3 miles? Heavy new supply typically softens prices + rents 12–24 months out; constrained supply supports both.
Investment metrics
- 1% rule
- 0.92% ✗
- Cap rate
- 7.65%
- Cash-on-cash
- 4.83%
- DSCR
- 1.22
- GRM
- 9.1
CMA / ARV
- ARV (on-the-fly)
- $230,160
- Comps found
- 1
Show comp detail 1 sale within ~0.75 mi
| Address | Dist | Beds/Ba | Sqft | Sold | Price | $/sf | Match |
|---|---|---|---|---|---|---|---|
| 2484 Gator Ln | 0.00mi | 3/2.0 | 1,680 (0%) | 0mo | $230,000 | $137 | 100 |
Match score weights: distance 35% · size 25% · config 20% · recency 20%. Top-matched comps best support the ARV.
Projected returns pro-forma
-3.0% appreciation · 1.67% rent growth · sell at horizon
- IRR
- -10.2%
- Equity multiple
- 0.63×
- Total profit
- $-26,702
- Equity at exit
- $38,767
- IRR
- -2.6%
- Equity multiple
- 0.83×
- Total profit
- $-12,167
- Equity at exit
- $22,480
Cash invested: $72,800 (down + closing). Projections, not guarantees.
Landlord ↔ Tenant lean methodology
- Overall (STATE)
- 87 Strongly Landlord-Friendly
- State Florida
- 87 Strongly Landlord-Friendly · R+3
- County
- — inherits STATE
- City
- — inherits STATE
ZIP-level market 34736
- Home prices YoY
- -22.5%
- Rents YoY
- 1.7%
- Active inventory
- 585
- Price-to-rent
- 9.1×
Monthly cashflow live
- Estimated rent
- $2,387 medium interval (Pro) →
- Mortgage (P&I)
- −$1,363
- Tax from tax record
- −$121 /mo · $1,446/yr
- Insurance
- −$108
- HOA
- −$0
- Vacancy / Maint / Mgmt
- −$501
- Net cashflow
- $293
Break-even live
UW: 25.0% down · 7.5% · 30yr · 1.5% tax · 5.0% vac · 8.0% maint · 8.0% mgmt
Financing live
Cash to close
- Down payment
- $65,000
- Closing costs
- $7,800
- Reserves months
- —
- Total cash needed
- —
Loan-product check · same deal, 3 products live
Conventional
25% down · 7.5% · 30yr
- Down + closing
- —
- Monthly P&I
- —
- Monthly cashflow
- —
- DSCR
- —
- Eligible?
- —
Personal DTI + credit; lowest rate.
DSCR
20% down · 8.5% · 30yr
- Down + closing
- —
- Monthly P&I
- —
- Monthly cashflow
- —
- DSCR
- —
- Eligible?
- —
No personal income docs; deal must DSCR.
Hard money
10% down · 12.0% · 12mo
- Down + closing
- —
- Monthly P&I
- —
- Monthly cashflow
- —
- DSCR
- —
- Eligible?
- —
Short-term bridge; refi at stabilization.
Listing history 16 events
-
2026-05-26$260,000 Active
-
2026-05-25historical $1,895
-
2026-05-18$1,895
-
2026-05-13historical $1,895
-
2026-05-06$1,895
-
2026-04-23historical $1,895
-
2026-04-20$1,895
-
2026-04-20historical $1,895
-
2026-03-05historical $1,895
-
2026-03-02$1,895
-
2026-02-03$1,895
-
2026-02-03historical $1,895
-
2026-01-31$1,895
-
2026-01-31historical $1,895
-
2026-01-30$1,895
-
2022-06-16soldstatus $180,000
ⓘ Source: listings_history table (triggers on properties + properties_extension) + one-shot
backfill from property_details.listing_events for pre-trigger history.
Tax reassessment forecast FL · Resets to sale price
- Current annual tax
- $1,446 · $121/mo
- Projected year-2 tax
- $2,158 · $180/mo
- Expected delta
- +$712/yr (+$59/mo · 49.2%)
ⓘ Screening estimate from a state-policy table — verify with the county assessor before closing.
Climate risk First Street
- Flood 1/10 Low FEMA zone X (unshaded) · 0% chance over 30 yrs
- Wildfire 7/10 Severe
- Heat 8/10 Severe 7 d/yr ≥108°F today · 23 d/yr by 30 yrs out
- Wind 9/10 Extreme 99% chance of damaging wind over 30 yrs
- Air quality 2/10 Low 1 unhealthy d/yr today · 1 by 30 yrs out
Nearby sold comps map
Loading sold comps map…
Walkable amenities ~0.75 mi
Loading nearby amenities…
Taxation est. · year 1
- Rental income
- $28,640
- − Mortgage interest
- −$14,564
- − Property taxes
- −$1,446
- − Insurance
- −$1,300
- − Repairs & maintenance
- −$2,291
- − Management
- −$2,291
- − Depreciation
- −$7,564
- Taxable loss
- −$816
- Est. tax savings @ 24.0%
- +$196
- After-tax cash flow
- $3,714/yr
For passive investors: Depreciation is non-cash, so a rental often shows a tax loss while cash-flowing — sheltering income. Rental losses are passive: they offset passive income freely, and up to $25,000/yr can offset ordinary (W-2) income if you actively participate and your MAGI is under $100k (phasing out to $0 by $150k); unused losses carry forward. On sale, claimed depreciation is recaptured at up to 25%, and gains may owe capital-gains tax (a 1031 exchange can defer both). Figures are a year-1 estimate at your 24.0% rate — not tax advice; consult a CPA.
Schools (NCES district)
- District
- Lake
- NCES district ID
- 1201050
- Math proficiency
- 49% ▼ -7.00%
- Reading proficiency
- 50% ▼ -4.00%
- Median HH income
- $46,632
- Composite
- 42.05/100
- National rank
- #3327
- State rank
- #37 of 73 in FL
Livability — Mascotte
- Score
- 71/100
- State rank
- #405
- US rank
- #7156
Category grades
Schools grade is shown separately in the Schools card above.
Census & demographics
- County
- Lake County · 364,602 people
- City population
- 33,565
- Metro
- Orlando-Kissimmee-Sanford, FL
- Population (ZIP)
- 28,001
- Household income
- $90,545
- Rent vs Own
- Severe rent burden
- 216.0
Population outlook (Lake County) Hauer SSP2
- Today (2025)
- 386,640 people
- By 2030
- 417,107 · +7.9%
- By 2040
- 476,676 · +23.3%
- By 2050
- 531,296 · +37.4%
- By 2075
- 648,303 · +67.7%
- By 2100
- 698,530 · +80.7%
Race, ethnicity, and origin ACS 2023
- Neighborhood character
- Diverse neighborhood (Simpson 0.65)
- Race & ethnicity
- White 52% Hispanic / Latino 25% Two or more races 17% Black 15% Asian 4%
- Hispanic origin (detail)
- Mexican 3% Puerto Rican 15% Cuban 2%
- Common ancestry
- Romanian 2% Hispanic 2% Lithuanian 1%
- Foreign-born
- 13% · Canada, Guatemala
- Languages at home
- 81% English-only · Spanish 14% French/Haitian/Cajun 2% Other Indo-European 1%
Political lean MEDSL · Lake
- 2024 margin
- Strong R (+24.7) · D 37.3% · R 62.0%
- 2008→2024 swing
- -11.2pp toward R · 2008: -13.5pp · 2024: -24.7pp
- All cycles
- 2024: R+24.7 2020: R+20.0 2016: R+23.1 2012: R+17.1 2008: R+13.5
Not yet ingested
- Civics
- —
Market trends
- HPI YoY
- ▼ -77.23%
- Current HPI
- 265.3457
- Rent YoY
- ▲ 1.67%
- Metro
- Orlando-Kissimmee-Sanford, FL
- State GDP YoY
- ▲ 3.28%
- F500 in state
- 36
Industry mix (Fortune 500 HQ in FL)
| Industry | F500 HQs | Revenue |
|---|---|---|
| Industrial Technology | 2 | $29B |
|
||
| Insurance | 2 | $17B |
|
||
| Retail | 1 | $60B |
|
||
| Technology Distribution | 1 | $58B |
|
||
| Homebuilding | 1 | $35B |
|
||
| Technology Manufacturing | 1 | $35B |
|
||
Price history
+44.4% since first listed16 events — show timeline
- 2026-05-26 Listed $260,000 Stellar MLS as Distributed by MLS Grid
- 2026-05-25 Rental Removed $1,895 SHOWMOJO
- 2026-05-18 Listed for Rent $1,895 SHOWMOJO
- 2026-05-13 Rental Removed $1,895 STELLARMLS
- 2026-05-06 Listed for Rent $1,895 STELLARMLS
- 2026-04-23 Rental Removed $1,895 RENTALBEAST
- 2026-04-20 Listed for Rent $1,895 RENTALBEAST
- 2026-04-20 Rental Removed $1,895 STELLARMLS
- 2026-03-05 Rental Removed $1,895 RENTALBEAST
- 2026-03-02 Listed for Rent $1,895 RENTALBEAST
- 2026-02-03 Listed for Rent $1,895 STELLARMLS
- 2026-02-03 Rental Removed $1,895 RENTALBEAST
- 2026-01-31 Listed for Rent $1,895 RENTALBEAST
- 2026-01-31 Rental Removed $1,895 SHOWMOJO
- 2026-01-30 Listed for Rent $1,895 SHOWMOJO
- 2022-06-16 Sold (Public Records) $180,000 Public Records
Property tax history
+11.6%/yrLatest (2025): $1,446 · +0.8% YoY. Source: county tax records.
Cash-flow waterfall
monthlySold comps — $/sqft
last 12 mo · ≤1 miLoading sold comps…