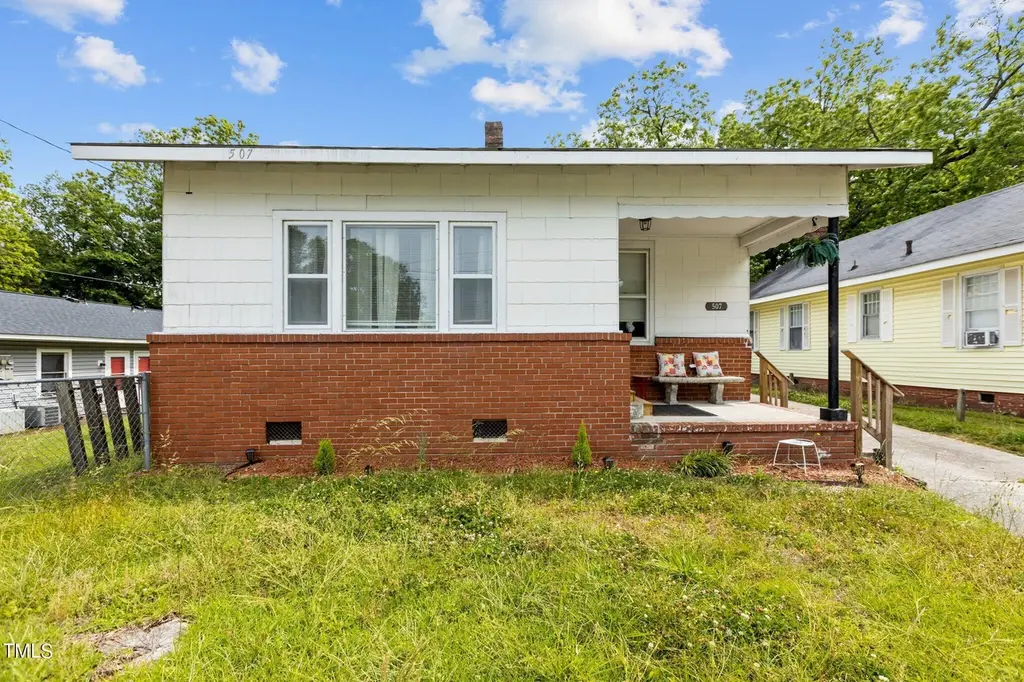
507 W 3rd St · Greenville, NC
Flood risk 1/10 · Minimal
- FEMA flood zone
- X (unshaded)
- Chance of flooding over 30 yrs
- 0.0%
- Est. flood insurance / yr
- $507 – $1,088
Fire risk 3/10 · Minor
- Est. fire insurance / yr
- $906 – $1,684
Heat risk 7/10 · Major
- Hot days now (above 107°F)
- 7 days/yr
- Hot days in 30 yrs
- 16 days/yr
Wind risk 8/10 · Major
- Chance of severe wind over 30 yrs
- 80.0%
Air-quality risk 3/10 · Minor
- Unhealthy air days now
- 3 days/yr
- Unhealthy air days in 30 yrs
- 3 days/yr
Risk factors via First Street. Map © Google.
Why this score? — see what drove the C+ grade
The composite is a weighted blend of 9 inputs, each scored 0–100. Each bar is that input's sub-score; the figure is the points it added to the 100-point composite (weight × sub-score).
- Cash flow +22.9/30.0
- ARV discount +15.0/15.0
- DSCR +7.4/10.0
- 1% rule +5.9/10.0
- Rent growth +3.9/5.0
- Livability +3.9/5.0
- Schools +3.6/10.0
- Condition / age +2.5/5.0
- Appreciation +0.0/10.0
$125,000
🖨 Deal sheet 📄 Offer letter ✓ Due diligence
Listing remarks
Great investment opportunity meeting 1% rule. Tenants in place - Income $15,540/Year. This 3 bedroom - 2.5 bathrooms ranch offers a fenced back yard, detached garage, and covered front porch. Location is perfect, between East Carolina University and the ECU Health Main Campus Medical District. Income statement and lease documents available upon request.
Key facts
- Covered front porch
- Fenced back yard
- Detached garage
Tags
Property features AI
Finance
- HOA & community: No association
Exterior
- Parking: Open parking for 2 cars; Concrete driveway
- Utilities: Public water; Public sewer; Electricity connected; Sewer connected; Water connected; Cable available
- Home design: Single-story house
- Construction: Brick veneer and wood siding; Shingle roof; Block and brick/mortar foundation; Built as a house (one level)
- Exterior features: Deck; Front porch; Fenced backyard; Garage(s) on property
Interior
- Kitchen: Electric range; Refrigerator
- Bedrooms: 3 bedrooms (all on the main level)
- Flooring: Luxury vinyl; Tile; Vinyl
- Bathrooms: 2 full bathrooms; 1 half bathroom
- Heating & cooling: Electric heating with heat pump; Central air with heat pump
- Interior features: Electric range and refrigerator; Washer and electric dryer hookups
- Laundry & utility: Washer hookup; Electric dryer hookup
Neighborhood map
What this means for you Summary
Snapshot
- This is a 3-bed/2.5-bath single-family listed at $125k.
Deal economics
- At list price, monthly cash flow is $221 ($3k/yr) — positive.
- The deal already cash-flows at list — no discount required.
- Meets the 1% rule at list price ($1k rent vs $125k).
- Cap rate 8.4% vs local median 3.8% in Greenville — top-decile yield for the area; either an underpriced asset or a hidden risk that comps aren't pricing in. Stress-test before assuming the spread holds.
Location & tenants
- Location reads 77/100 on livability (#30 in NC, #2,977 nationally) — a middle-class / working-renter tenant base. Strengths: commute A+, cost of living A+, health & safety A+; Watch: schools C-, crime F, employment F.
- Pitt County Schools (rural): math 41% / reading 44% proficiency, ranked #100 of 178 in NC (top 56%) — families likely to look elsewhere, expect single-tenant / working-renter base with shorter leases.
- Market conditions: Rents rising fast (+5.4%/yr); 350 active listings in the ZIP; 7 comparable units currently listed for rent nearby; rentals at typical pace (median 21d on market — plan ~3-4 weeks tenant-placement turnaround); 1,300 units permitted in Pitt County in 2024 (204 in 5+ unit buildings).
- This rent runs 33% of the median local income ($49k/yr) — at the standard rent-burdened threshold; future hikes will face affordability resistance.
Forward outlook
- Local home prices are declining (-3.0%/yr); year-one equity from $864 of loan paydown is wiped out by about $4k of value loss. Plan a longer hold.
- Pitt County population projected at +22% by 2050 — long-run rental-demand tailwind backs the buy-and-hold thesis.
- At projected returns (-3.0% appreciation + 5.4% rent growth), your $35k cash investment doubles in ~10 years — after that, you're playing with house money.
Negotiation context
- Only 8 days on market — expect competitive offers; lowballing is unlikely to land.
- 13 sale attempts since 4y ago with the ask held roughly flat each time — persistent listings suggest the price (not the market) is what's stuck; bring a comps-based counter.
Risks & watch-outs
- Watch-outs: built in 1935 — expect roof / HVAC / electrical / plumbing capex.
- Climate carrying-cost: severe wind risk, 80% chance of damaging wind over 30y; extreme-heat days projected 7→16/yr by 2055 (HVAC capex compounding) — expect insurance premiums to compound above CPI over the hold.
Questions for the listing agent
- Built in 1935 — when were the roof, HVAC, electrical panel, plumbing, and water heater last replaced?
- Is there a deadline driving the sale (1031 exchange, divorce, estate, relocation)? That informs how much negotiation room exists.
- Crime grade is F in this area — have there been break-ins, vandalism, or insurance claims at this property in the last 3 years? What carrier currently insures it and at what premium?
- What's the average days-on-market for RENTAL listings here right now (not sales)? A rising rental-DOM trend means longer vacancies and softer asking-rent achievability than the comps imply.
- What's the recent tenant-quality profile in this submarket — average credit score on applications, eviction rate, late-payment / NSF rate, and stable-employment percentage? A property-management company in the area should have these aggregated.
- How much new for-sale + rental construction is in the pipeline within 1–3 miles? Heavy new supply typically softens prices + rents 12–24 months out; constrained supply supports both.
Investment metrics
- 1% rule
- 1.09% ✓
- Cap rate
- 8.41%
- Cash-on-cash
- 7.56%
- DSCR
- 1.34
- GRM
- 7.7
CMA / ARV
- ARV (on-the-fly)
- $170,024
- Comps found
- 9
Show comp detail 9 sales within ~0.75 mi
| Address | Dist | Beds/Ba | Sqft | Sold | Price | $/sf | Match |
|---|---|---|---|---|---|---|---|
| 509 W Third St | 0.01mi | 3/2.0 | 1,576 (-2%) | 23mo | $100,000 | $63 | 76 |
| 407 Latham St | 0.12mi | 3/2.0 | 1,698 (+6%) | 12mo | $220,000 | $130 | 72 |
| 501 Evans St | 0.41mi | 3/2.0 | 1,800 (+12%) | 21mo | $217,000 | $121 | 41 |
| 1209 Fleming St | 0.59mi | 3/1.0 | 1,434 (-11%) | 10mo | $35,000 | $24 | 40 |
| 110 Paris Ave | 0.74mi | 3/1.0 | 1,406 (-12%) | 1mo | $80,000 | $57 | 38 |
| 620 Hudson St | 0.62mi | 3/2.0 | 1,391 (-13%) | 17mo | $221,000 | $159 | 33 |
| 113 E Ninth St | 0.58mi | 3/1.0 | 1,410 (-12%) | 18mo | $150,000 | $106 | 32 |
| 806 Vanderbilt Ln | 0.63mi | 3/2.0 | 1,375 (-14%) | 16mo | $221,000 | $161 | 31 |
| 206 Stutz St | 0.70mi | 3/2.0 | 1,384 (-14%) | 18mo | $145,000 | $105 | 27 |
Match score weights: distance 35% · size 25% · config 20% · recency 20%. Top-matched comps best support the ARV.
Projected returns pro-forma
-3.0% appreciation · 5.44% rent growth · sell at horizon
- IRR
- -2.0%
- Equity multiple
- 0.92×
- Total profit
- $-2,772
- Equity at exit
- $18,638
- IRR
- 10.1%
- Equity multiple
- 1.87×
- Total profit
- $30,479
- Equity at exit
- $10,808
Cash invested: $35,000 (down + closing). Projections, not guarantees.
Landlord ↔ Tenant lean methodology
- Overall (STATE)
- 85 Strongly Landlord-Friendly
- State North Carolina
- 85 Strongly Landlord-Friendly · R+3
- County
- — inherits STATE
- City
- — inherits STATE
ZIP-level market 27834
- Rents YoY
- 5.4%
- Active inventory
- 350
- Price-to-rent
- 7.7×
Monthly cashflow live
- Estimated rent
- $1,359 high interval (Pro) →
- Mortgage (P&I)
- −$656
- Tax from tax record
- −$145 /mo · $1,745/yr
- Insurance
- −$52
- HOA
- −$0
- Vacancy / Maint / Mgmt
- −$285
- Net cashflow
- $221
Break-even live
UW: 25.0% down · 7.5% · 30yr · 1.5% tax · 5.0% vac · 8.0% maint · 8.0% mgmt
Financing live
Cash to close
- Down payment
- $31,250
- Closing costs
- $3,750
- Reserves months
- —
- Total cash needed
- —
Loan-product check · same deal, 3 products live
Conventional
25% down · 7.5% · 30yr
- Down + closing
- —
- Monthly P&I
- —
- Monthly cashflow
- —
- DSCR
- —
- Eligible?
- —
Personal DTI + credit; lowest rate.
DSCR
20% down · 8.5% · 30yr
- Down + closing
- —
- Monthly P&I
- —
- Monthly cashflow
- —
- DSCR
- —
- Eligible?
- —
No personal income docs; deal must DSCR.
Hard money
10% down · 12.0% · 12mo
- Down + closing
- —
- Monthly P&I
- —
- Monthly cashflow
- —
- DSCR
- —
- Eligible?
- —
Short-term bridge; refi at stabilization.
Rent comps 7 comps
| Address | Beds | Baths | Sqft | Rent | $/sqft | DOM | Units | Dist |
|---|---|---|---|---|---|---|---|---|
| 550 Pitt-Greene Connector Greenville, NC | 4.0 | 1.0–4.0 | 1012 | $1,288 | $1.27 | 13d | 25 | 0.30mi |
| 1001 Park Ave Greenville, NC | 3.0 | 1.0 | 1296 | $1,150 | $0.89 | 21d | 1 | 0.32mi |
| 206 Hudson St Greenville, NC | 2.0 | 1.0 | 1150 | $900 | $0.78 | 21d | 1 | 0.55mi |
| 600 Howell St Apt E Greenville, NC | 2.0 | 1.0 | 1050 | $815 | $0.78 | 21d | 1 | 1.01mi |
| 115 Stancill Dr Unit B Greenville, NC | 3.0 | 1.0 | 1090 | $1,500 | $1.38 | 21d | 1 | 1.10mi |
| 301 Maple St Greenville, NC | 3.0 | 2.0 | 1230 | $1,800 | $1.46 | 21d | 1 | 1.19mi |
| 701 Treybrooke Cir Greenville, NC | 1.0–2.0 | 1.5–2.0 | 1070 | $1,650 | $1.54 | 13d | 18 | 1.35mi |
Listing history 33 events
-
2026-05-14status Pending
-
2026-05-06$125,000 Active
-
2025-08-30historical $1,250
-
2025-08-28historical $1,250
-
2025-08-08$1,250
-
2025-08-08$1,250
-
2024-09-23historical $1,200
-
2024-09-12historical $1,200
-
2024-09-12$1,200
-
2024-08-24historical $1,200
-
2024-08-24$1,200
-
2024-08-19historical
-
2024-08-01historical $1,600
-
2024-07-31$1,600
-
2024-07-27historical $1,600
-
2024-07-27$1,600
-
2024-07-25$130,000 Active
-
2024-07-09price $1,600
-
2024-06-18$1,800
-
2024-06-18historical $1,800
-
2024-06-15$1,800
-
2024-06-10historical
-
2024-05-20price $175,000
-
2024-05-06$200,000 Active
-
2023-06-22historical
-
2023-03-07soldstatus $160,000 Closed
-
2023-03-07soldstatus $160,000
-
2023-02-01status Pending
-
2023-01-01$210,000 Active
-
2022-09-20soldstatus $45,000 Closed
-
2022-09-20soldstatus $45,000
-
2022-09-01status Pending
-
2022-08-29$71,000 Active
ⓘ Source: listings_history table (triggers on properties + properties_extension) + one-shot
backfill from property_details.listing_events for pre-trigger history.
Tax reassessment forecast NC · Resets to sale price
- Current annual tax
- $1,745 · $145/mo
- Projected year-2 tax
- $1,745 · $145/mo
- Expected delta
- $0/yr ($0/mo · 0.0%)
ⓘ Screening estimate from a state-policy table — verify with the county assessor before closing.
Climate risk First Street
- Flood 1/10 Low FEMA zone X (unshaded) · 0% chance over 30 yrs
- Wildfire 3/10 Moderate
- Heat 7/10 Severe 7 d/yr ≥107°F today · 16 d/yr by 30 yrs out
- Wind 8/10 Severe 80% chance of damaging wind over 30 yrs
- Air quality 3/10 Moderate 3 unhealthy d/yr today · 3 by 30 yrs out
Nearby sold comps map
Loading sold comps map…
Walkable amenities ~0.75 mi
Loading nearby amenities…
Taxation est. · year 1
- Rental income
- $16,308
- − Mortgage interest
- −$7,002
- − Property taxes
- −$1,745
- − Insurance
- −$625
- − Repairs & maintenance
- −$1,305
- − Management
- −$1,305
- − Depreciation
- −$3,636
- Taxable income
- $691
- Est. tax owed @ 24.0%
- −$166
- After-tax cash flow
- $2,482/yr
For passive investors: Depreciation is non-cash, so a rental often shows a tax loss while cash-flowing — sheltering income. Rental losses are passive: they offset passive income freely, and up to $25,000/yr can offset ordinary (W-2) income if you actively participate and your MAGI is under $100k (phasing out to $0 by $150k); unused losses carry forward. On sale, claimed depreciation is recaptured at up to 25%, and gains may owe capital-gains tax (a 1031 exchange can defer both). Figures are a year-1 estimate at your 24.0% rate — not tax advice; consult a CPA.
Schools (NCES district)
- District
- Pitt County Schools
- NCES district ID
- 3700012
- Math proficiency
- 41% ▬ 0.00%
- Reading proficiency
- 44% ▲ 2.00%
- Median HH income
- $40,631
- Composite
- 35.67/100
- National rank
- #4877
- State rank
- #100 of 178 in NC
Livability — Greenville
- Score
- 77/100
- State rank
- #30
- US rank
- #2977
Category grades
Schools grade is shown separately in the Schools card above.
Census & demographics
- Census place
- Greenville, NC
- County
- Pitt County · 142,592 people
- City population
- 115,121
- Metro
- Greenville, NC
- Population (ZIP)
- 56,347
- Household income
- $48,935
- Rent vs Own
- Severe rent burden
- 3319.0
Population outlook (Pitt County) Hauer SSP2
- Today (2025)
- 194,585 people
- By 2030
- 203,756 · +4.7%
- By 2040
- 220,807 · +13.5%
- By 2050
- 236,614 · +21.6%
- By 2075
- 275,940 · +41.8%
- By 2100
- 300,058 · +54.2%
Race, ethnicity, and origin ACS 2023
- Neighborhood character
- Diverse neighborhood (Simpson 0.59)
- Race & ethnicity
- Black 54% White 33% Hispanic / Latino 8% Two or more races 3% Asian 2%
- Hispanic origin (detail)
- Mexican 7%
- Common ancestry
- Lithuanian 1% Slovak 1% Romanian 1%
- Foreign-born
- 7% · Canada, China
- Languages at home
- 91% English-only · Spanish 6% Other Asian/Pacific 1%
Political lean MEDSL · Pitt
- 2024 margin
- Lean D (+6.0) · D 52.5% · R 46.5% · Other 1.1%
- 2008→2024 swing
- -2.8pp toward R · 2008: 8.8pp · 2024: 6.0pp
- All cycles
- 2024: D+6.0 2020: D+9.4 2016: D+7.4 2012: D+6.7 2008: D+8.8
Not yet ingested
- Civics
- —
Market trends
- HPI YoY
- ▼ -187.99%
- Current HPI
- 190.6869
- Rent YoY
- ▲ 5.44%
- Metro
- Greenville, NC
- State GDP YoY
- ▲ 3.28%
- F500 in state
- 26
Industry mix (Fortune 500 HQ in NC)
| Industry | F500 HQs | Revenue |
|---|---|---|
| Financial Services | 2 | $213B |
|
||
| Retail | 2 | $95B |
|
||
| Industrial Conglomerate | 1 | $38B |
|
||
| Metals / Steel | 1 | $35B |
|
||
| Utilities | 1 | $30B |
|
||
| Industrial Machinery | 1 | $19B |
|
||
Price history
+76.1% since first listed33 events — show timeline
- 2026-05-14 Pending — TMLS
- 2026-05-06 Listed $125,000 TMLS
- 2025-08-30 Rental Removed $1,250 BUILDIUM
- 2025-08-28 Rental Removed $1,250 TMLS
- 2025-08-08 Listed for Rent $1,250 BUILDIUM
- 2025-08-08 Listed for Rent $1,250 TMLS
- 2024-09-23 Rental Removed $1,200 TMLS
- 2024-09-12 Rental Removed $1,200 BUILDIUM
- 2024-09-12 Listed for Rent $1,200 BUILDIUM
- 2024-08-24 Rental Removed $1,200 BUILDIUM
- 2024-08-24 Listed for Rent $1,200 BUILDIUM
- 2024-08-19 Listing Removed — TMLS
- 2024-08-01 Rental Removed $1,600 BUILDIUM
- 2024-07-31 Listed for Rent $1,600 BUILDIUM
- 2024-07-27 Rental Removed $1,600 BUILDIUM
- 2024-07-27 Listed for Rent $1,600 BUILDIUM
- 2024-07-25 Listed $130,000 TMLS
- 2024-07-09 Price Changed $1,600 TMLS
- 2024-06-18 Listed for Rent $1,800 TMLS
- 2024-06-18 Rental Removed $1,800 BUILDIUM
- 2024-06-15 Listed for Rent $1,800 BUILDIUM
- 2024-06-10 Listing Removed — TMLS
- 2024-05-20 Price Changed $175,000 TMLS
- 2024-05-06 Listed $200,000 TMLS
- 2023-06-22 Rental Removed — BUILDIUM
- 2023-03-07 Sold (Public Records) $160,000 Public Records
- 2023-03-07 Sold (MLS) $160,000 Hive MLS
- 2023-02-01 Pending — Hive MLS
- 2023-01-01 Listed $210,000 Hive MLS
- 2022-09-20 Sold (Public Records) $45,000 Public Records
- 2022-09-20 Sold (MLS) $45,000 Hive MLS
- 2022-09-01 Pending — Hive MLS
- 2022-08-29 Listed $71,000 Hive MLS
Property tax history
+16.4%/yrLatest (2025): $1,745 · +0.7% YoY. Source: county tax records.
Cash-flow waterfall
monthlySold comps — $/sqft
last 12 mo · ≤1 miLoading sold comps…