3300 E Fry Blvd #7 · Sierra Vista, AZ
Flood risk 4/10 · Minor
- FEMA flood zone
- X (unshaded)
- Chance of flooding over 30 yrs
- 0.22%
- Est. flood insurance / yr
- $507 – $1,088
Fire risk 7/10 · Major
- Est. fire insurance / yr
- $610 – $1,132
Heat risk 5/10 · Moderate
- Hot days now (above 98°F)
- 6 days/yr
- Hot days in 30 yrs
- 16 days/yr
Wind risk 1/10 · Minimal
- Chance of severe wind over 30 yrs
- —
Air-quality risk 1/10 · Minimal
- Unhealthy air days now
- 0 days/yr
- Unhealthy air days in 30 yrs
- 0 days/yr
Risk factors via First Street. Map © Google.
Why this score? — see what drove the B+ grade
The composite is a weighted blend of 9 inputs, each scored 0–100. Each bar is that input's sub-score; the figure is the points it added to the 100-point composite (weight × sub-score).
- Cash flow +30.0/30.0
- ARV discount +15.0/15.0
- 1% rule +10.0/10.0
- DSCR +10.0/10.0
- Livability +4.0/5.0
- Schools +2.9/10.0
- Rent growth +2.5/5.0
- Condition / age +2.2/5.0
- Appreciation +0.0/10.0
$35,000
🖨 Deal sheet 📄 Offer letter ✓ Due diligence
Listing remarks
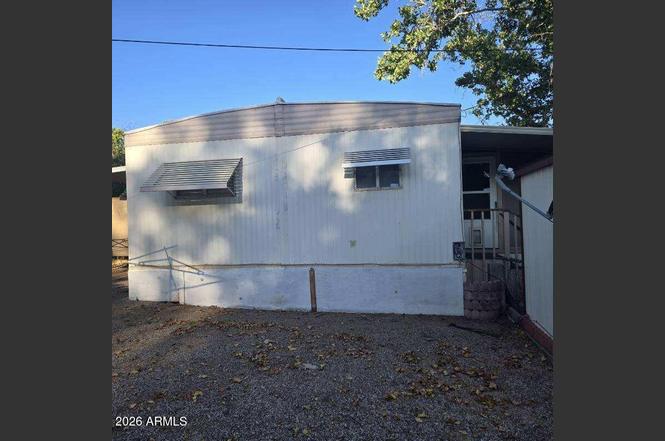
Welcome to this well-maintained 2-bedroom, 1.5-bath home nestled in the desirable Thunderbird RV Park. Offering a bright and open living area, this home features a functional kitchen with ample storage, a cozy dining space, and comfortable bedrooms for restful nights. The primary suite includes a convenient half bath, while the full bath is for modern comfort. Enjoy relaxing on the covered patio, perfect for morning coffee or evening sunsets. Located in a friendly, active community with easy access to shopping, dining, and local attractions. Ideal for year-round living, move-in ready and waiting for you!
Key facts
- 3,900 sq ft lot
- Parking
- Built 1970
Property features AI
Finance
- HOA & community: Land lease: $500 per month; Association covers sewer, grounds maintenance, street maintenance, trash, and water
Exterior
- Parking: 1 covered parking space; 1 carport space
- Utilities: City water; Public sewer
- Home design: Manufactured / Mobile home; Fee simple ownership
- Construction: Aluminum siding; Wood frame construction; Composition roof
- Exterior features: Chain link fencing; Shed(s); Dirt in back yard; Gravel/stone in front yard; Gravel/stone in back yard; Private maintained road
Interior
- Kitchen: Laminate counters; Refrigerator; Dishwasher
- Bedrooms: 2 possible bedrooms
- Flooring: Carpet; Vinyl
- Bathrooms: 1 full bathroom; 1 half bathroom
- Heating & cooling: Natural gas heating; Central air conditioning
- Interior features: Laminate counters; Refrigerator; Dishwasher
- Laundry & utility: Community laundry available
Neighborhood map
What this means for you Summary
Snapshot
- This is a 2-bed/1.5-bath manufactured listed at $35k. Condition is rated fair.
Deal economics
- At list price, monthly cash flow is $715 ($9k/yr) — positive.
- The deal already cash-flows at list — no discount required.
- Meets the 1% rule at list price ($1k rent vs $35k).
- Cap rate 30.8% vs local median 4.3% in Sierra Vista — top-decile yield for the area; either an underpriced asset or a hidden risk that comps aren't pricing in. Stress-test before assuming the spread holds.
Location & tenants
- Location reads 80/100 on livability (#5 in AZ, #1,805 nationally) — a professional / high-income tenant draw. Strengths: commute A+, housing A+, health & safety A+; Watch: amenities F.
- Sierra Vista Unified District (4175) (urban): math 27% / reading 39% proficiency, ranked #93 of 249 in AZ (top 37%) — families likely to look elsewhere, expect single-tenant / working-renter base with shorter leases.
- Zoned schools: Huachuca Mountain Elementary School (math 38% / reading 52%, grade D-, #334 of 1,109 statewide, top 30%, 416 students, 34% FRL); Joyce Clark Middle School (math 26% / reading 39%, grade F, #70 of 218 statewide, top 32%, 670 students, 46% FRL); Buena High School (math 19% / reading 29%, grade F, #202 of 381 statewide, top 54%, 1,836 students, 32% FRL) — zoned schools at 37% FRL track the district average.
- Market conditions: Rents flat; 176 active listings in the ZIP; 15 comparable units currently listed for rent nearby; rentals lingering (median 44d on market — plan ~5-8 weeks vacancy on turnover, expect pricing pressure); 100% of comp listings sitting > 30 days — soft ceiling on asking rent; 437 units permitted in Cochise County in 2024 (6 in 5+ unit buildings).
Forward outlook
- Local home prices are declining (-3.0%/yr); year-one equity from $242 of loan paydown is wiped out by about $1k of value loss. Plan a longer hold.
- Cochise County population projected at -30% by 2050 — secular population decline; favor cash flow + early exit over multi-decade hold.
- At projected returns (-3.0% appreciation + 0.0% rent growth), your $10k cash investment doubles in ~2 years — after that, you're playing with house money.
Negotiation context
- Only 5 days on market — expect competitive offers; lowballing is unlikely to land.
Risks & watch-outs
- Climate carrying-cost: major wildfire risk; extreme-heat days projected 6→16/yr by 2055 (HVAC capex compounding) — expect insurance premiums to compound above CPI over the hold.
Questions for the listing agent
- Have any recent inspections been done? Can we get a copy of the seller's disclosures and any deferred-maintenance estimates?
- Built in 1970 — when were the roof, HVAC, electrical panel, plumbing, and water heater last replaced?
- Is there a deadline driving the sale (1031 exchange, divorce, estate, relocation)? That informs how much negotiation room exists.
- What's the average days-on-market for RENTAL listings here right now (not sales)? A rising rental-DOM trend means longer vacancies and softer asking-rent achievability than the comps imply.
- What's the recent tenant-quality profile in this submarket — average credit score on applications, eviction rate, late-payment / NSF rate, and stable-employment percentage? A property-management company in the area should have these aggregated.
- How much new for-sale + rental construction is in the pipeline within 1–3 miles? Heavy new supply typically softens prices + rents 12–24 months out; constrained supply supports both.
Investment metrics
- 1% rule
- 3.46% ✓
- Cap rate
- 30.80%
- Cash-on-cash
- 87.54%
- DSCR
- 4.90
- GRM
- 2.4
CMA / ARV
- ARV (on-the-fly)
- $63,825
- Comps found
- 1
Show comp detail 1 sale within ~0.75 mi
| Address | Dist | Beds/Ba | Sqft | Sold | Price | $/sf | Match |
|---|---|---|---|---|---|---|---|
| 3595 E Blue Bird Dr | 0.33mi | 2/1.0 | 1,063 (+15%) | 8mo | $73,000 | $69 | 51 |
Match score weights: distance 35% · size 25% · config 20% · recency 20%. Top-matched comps best support the ARV.
Projected returns pro-forma
-3.0% appreciation · 0.0% rent growth · sell at horizon
- IRR
- 84.7%
- Equity multiple
- 4.71×
- Total profit
- $36,331
- Equity at exit
- $5,219
- IRR
- 87.2%
- Equity multiple
- 8.82×
- Total profit
- $76,626
- Equity at exit
- $3,026
Cash invested: $9,800 (down + closing). Projections, not guarantees.
Landlord ↔ Tenant lean methodology
- Overall (STATE)
- 87 Strongly Landlord-Friendly
- State Arizona
- 87 Strongly Landlord-Friendly · R+3
- County
- — inherits STATE
- City
- — inherits STATE
ZIP-level market 85635
- Home prices YoY
- -32.3%
- Rents YoY
- 0.0%
- Active inventory
- 176
- Price-to-rent
- 2.4×
Monthly cashflow live
- Estimated rent
- $1,211 high interval (Pro) →
- Mortgage (P&I)
- −$184
- Tax est. 1.5%
- −$44 /mo · $525/yr
- Insurance
- −$15
- HOA
- −$0
- Vacancy / Maint / Mgmt
- −$254
- Net cashflow
- $715
Break-even live
UW: 25.0% down · 7.5% · 30yr · 1.5% tax · 5.0% vac · 8.0% maint · 8.0% mgmt
Financing live
Cash to close
- Down payment
- $8,750
- Closing costs
- $1,050
- Reserves months
- —
- Total cash needed
- —
Loan-product check · same deal, 3 products live
Conventional
25% down · 7.5% · 30yr
- Down + closing
- —
- Monthly P&I
- —
- Monthly cashflow
- —
- DSCR
- —
- Eligible?
- —
Personal DTI + credit; lowest rate.
DSCR
20% down · 8.5% · 30yr
- Down + closing
- —
- Monthly P&I
- —
- Monthly cashflow
- —
- DSCR
- —
- Eligible?
- —
No personal income docs; deal must DSCR.
Hard money
10% down · 12.0% · 12mo
- Down + closing
- —
- Monthly P&I
- —
- Monthly cashflow
- —
- DSCR
- —
- Eligible?
- —
Short-term bridge; refi at stabilization.
Rent comps 15 comps
| Address | Beds | Baths | Sqft | Rent | $/sqft | DOM | Units | Dist |
|---|---|---|---|---|---|---|---|---|
| 3799 E Foothills Dr Apt 05 (182) Sierra Vista, AZ | 2.0 | 1.0 | 825 | $950 | $1.15 | 43d | 1 | 0.54mi |
| 289 S Highway 92 Sierra Vista, AZ | 1.0 | 1.0 | 665 | $1,316 | $1.98 | 44d | 1 | 0.61mi |
| 289 S Highway 92 Sierra Vista, AZ | 2.0 | 2.0 | 991 | $1,610 | $1.62 | 43d | 1 | 0.61mi |
| 4250 E Foothills Dr Sierra Vista, AZ | 1.0–2.0 | 1.0–2.0 | 686 | $1,150 | $1.68 | 43d | 17 | 0.75mi |
| 4208 Avenue Palermo Unit B Sierra Vista, AZ | 3.0 | 2.0 | 1026 | $1,200 | $1.17 | 43d | 1 | 0.85mi |
| 93 Kings Way Sierra Vista, AZ | 2.0–3.0 | 1.0 | 905 | $875 | $0.97 | 43d | 1 | 0.85mi |
| 4307 Avenida Palermo Sierra Vista, AZ | 3.0 | 2.0 | 1018 | $1,100 | $1.08 | 43d | 1 | 0.87mi |
| 4135 Calle Barona Apt C Sierra Vista, AZ | 2.0 | 1.0 | 845 | $1,175 | $1.39 | 43d | 1 | 0.88mi |
| 4225 Calle Barona Unit C Sierra Vista, AZ | 2.0 | 1.0 | 761 | $825 | $1.08 | 43d | 1 | 0.95mi |
| 409 S Lenzner Ave Sierra Vista, AZ | 1.0–3.0 | 1.0–2.0 | 793 | $1,372 | $1.73 | 43d | 23 | 0.97mi |
| 1417 Plaza Merito Unit A Sierra Vista, AZ | 2.0 | 1.0 | 802 | $1,225 | $1.53 | 43d | 1 | 1.07mi |
| 4410 Buena Loma Way Unit D Sierra Vista, AZ | 2.0 | 2.0 | 1070 | $1,025 | $0.96 | 43d | 1 | 1.27mi |
| 800 N Lenzner Ave Sierra Vista, AZ | 3.0 | 2.0 | 1050 | $1,070 | $1.02 | 43d | 1 | 1.29mi |
| 1205 Cottonwood Dr Sierra Vista, AZ | 3.0 | 2.0 | 1051 | $1,400 | $1.33 | 44d | 1 | 1.38mi |
| 1201 Colombo Ave Sierra Vista, AZ | 1.0–3.0 | 1.0–2.0 | 893 | $1,592 | $1.78 | 43d | 15 | 1.47mi |
Listing history 6 events
-
2026-06-19days on market $35,000 Active 5 DOM
-
2026-06-18days on market $35,000 Active 4 DOM
-
2026-06-17days on market $35,000 Active 3 DOM
-
2026-06-16days on market $35,000 Active 2 DOM
-
2026-06-15remarks 611-char remark
-
2026-06-15$35,000 Active 1 DOM
ⓘ Source: listings_history table (triggers on properties + properties_extension) + one-shot
backfill from property_details.listing_events for pre-trigger history.
Climate risk First Street
- Flood 4/10 Moderate FEMA zone X (unshaded) · 22% chance over 30 yrs
- Wildfire 7/10 Severe
- Heat 5/10 Major 6 d/yr ≥98°F today · 16 d/yr by 30 yrs out
- Wind 1/10 Low
- Air quality 1/10 Low 0 unhealthy d/yr today · 0 by 30 yrs out
Nearby sold comps map
Loading sold comps map…
Walkable amenities ~0.75 mi
Loading nearby amenities…
Taxation est. · year 1
- Rental income
- $14,534
- − Mortgage interest
- −$1,961
- − Property taxes
- −$525
- − Insurance
- −$175
- − Repairs & maintenance
- −$1,163
- − Management
- −$1,163
- − Depreciation
- −$1,018
- Taxable income
- $8,530
- Est. tax owed @ 24.0%
- −$2,047
- After-tax cash flow
- $6,532/yr
For passive investors: Depreciation is non-cash, so a rental often shows a tax loss while cash-flowing — sheltering income. Rental losses are passive: they offset passive income freely, and up to $25,000/yr can offset ordinary (W-2) income if you actively participate and your MAGI is under $100k (phasing out to $0 by $150k); unused losses carry forward. On sale, claimed depreciation is recaptured at up to 25%, and gains may owe capital-gains tax (a 1031 exchange can defer both). Figures are a year-1 estimate at your 24.0% rate — not tax advice; consult a CPA.
Condition & rehab AI · 12 photos
This manufactured home requires moderate renovations, including new siding, HVAC units, and landscaping, to improve its condition and value.
Repairs flagged
- Major siding — Significant wear and tear
- Major HVAC units — Older units need replacement
- Major landscaping — Overgrown bushes need trimming
Value-add opportunities
- Both painting — Fresh paint can improve curb appeal and interior aesthetics
- Both HVAC replacement — Newer units will improve comfort and energy efficiency
- Both landscaping — Trimmed bushes will enhance curb appeal and property value
Renovation cost estimate screening
| Repair item | Severity | Est. cost |
|---|---|---|
| siding · Significant wear and tear | Major | $15,000–50,000 |
| HVAC units · Older units need replacement | Major | $15,000–50,000 |
| landscaping · Overgrown bushes need trimming | Major | $15,000–50,000 |
| Total estimated repair cost · 3 items | $45,000–150,000 |
Value-add ROI direction
- Both painting — Fresh paint can improve curb appeal and interior aesthetics ↑
- Both HVAC replacement — Newer units will improve comfort and energy efficiency ↑
- Both landscaping — Trimmed bushes will enhance curb appeal and property value ↑
ⓘ Cost ranges are severity-bucket heuristics (US national rule-of-thumb). Get contractor quotes + a written scope before underwriting a rehab budget.
Schools (NCES district)
- District
- Sierra Vista Unified District (4175)
- NCES district ID
- 0401460
- Math proficiency
- 27% ▼ -19.00%
- Reading proficiency
- 39% ▼ -10.00%
- Median HH income
- $55,463
- Composite
- 29.17/100
- National rank
- #6573
- State rank
- #93 of 249 in AZ
Livability — Sierra Vista
- Score
- 80/100
- State rank
- #5
- US rank
- #1805
Category grades
Schools grade is shown separately in the Schools card above.
Census & demographics
- Census place
- Sierra Vista, AZ
- County
- Cochise County · 49,069 people
- City population
- 49,069
- Metro
- Sierra Vista-Douglas, AZ
- Population (ZIP)
- 34,193
- Household income
- $61,580
- Rent vs Own
- Severe rent burden
- 1129.0
Population outlook (Cochise County) Hauer SSP2
- Today (2025)
- 113,402 people
- By 2030
- 106,197 · -6.4%
- By 2040
- 92,166 · -18.7%
- By 2050
- 79,805 · -29.6%
- By 2075
- 56,831 · -49.9%
- By 2100
- 35,103 · -69.0%
Race, ethnicity, and origin ACS 2023
- Neighborhood character
- Diverse neighborhood (Simpson 0.60)
- Race & ethnicity
- White 58% Hispanic / Latino 25% Two or more races 17% Black 6% Asian 4%
- Hispanic origin (detail)
- Mexican 19% Puerto Rican 1%
- Common ancestry
- Romanian 3% Lithuanian 3% Italian 2%
- Foreign-born
- 11% · Canada, South Korea
- Languages at home
- 80% English-only · Spanish 14% Korean 2% German/W. Germanic 1%
Political lean MEDSL · Cochise
- 2024 margin
- Strong R (+23.1) · D 37.8% · R 61.0% · Other 1.2%
- 2008→2024 swing
- -2.5pp toward R · 2008: -20.7pp · 2024: -23.1pp
- All cycles
- 2024: R+23.1 2020: R+19.6 2016: R+22.6 2012: R+24.0 2008: R+20.7
Not yet ingested
- Civics
- —
Market trends
- HPI YoY
- ▼ -83.93%
- Current HPI
- 175.5821
- Rent YoY
- ▬ 0.00%
- Metro
- Sierra Vista-Douglas, AZ
- State GDP YoY
- ▲ 4.54%
- F500 in state
- 20
Industry mix (Fortune 500 HQ in AZ)
| Industry | F500 HQs | Revenue |
|---|---|---|
| Technology | 2 | $13B |
|
||
| Mining / Metals | 1 | $23B |
|
||
| Environmental Services | 1 | $16B |
|
||
| Metals / Steel | 1 | $14B |
|
||
| Technology Distribution | 1 | $9B |
|
||
| Homebuilding | 1 | $8B |
|
||
Price history
1 event — show timeline
- 2026-06-14 Listed $35,000 ARMLS
Cash-flow waterfall
monthlySold comps — $/sqft
last 12 mo · ≤1 miLoading sold comps…