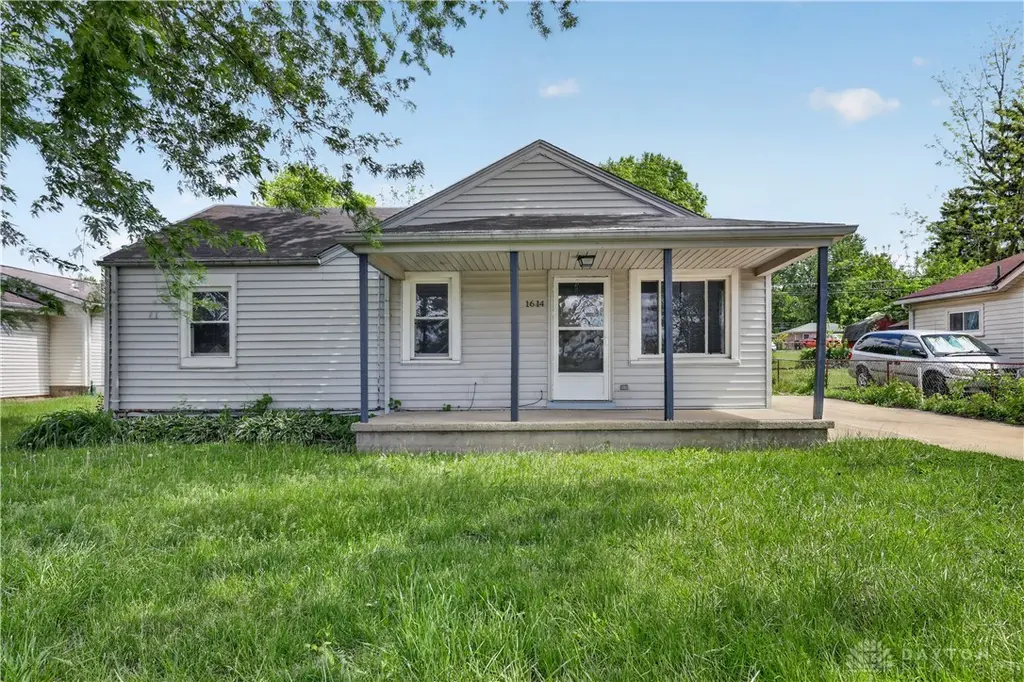
1614 Wilbur Ave · Fairborn, OH
Flood risk 1/10 · Minimal
- FEMA flood zone
- X (unshaded)
- Chance of flooding over 30 yrs
- 0.0%
- Est. flood insurance / yr
- $507 – $1,088
Fire risk 1/10 · Minimal
- Est. fire insurance / yr
- $713 – $1,323
Heat risk 3/10 · Minor
- Hot days now (above 101°F)
- 7 days/yr
- Hot days in 30 yrs
- 18 days/yr
Wind risk 2/10 · Minimal
- Chance of severe wind over 30 yrs
- —
Air-quality risk 4/10 · Minor
- Unhealthy air days now
- 4 days/yr
- Unhealthy air days in 30 yrs
- 5 days/yr
Risk factors via First Street. Map © Google.
Why this score? — see what drove the C+ grade
The composite is a weighted blend of 9 inputs, each scored 0–100. Each bar is that input's sub-score; the figure is the points it added to the 100-point composite (weight × sub-score).
- Cash flow +22.4/30.0
- ARV discount +15.0/15.0
- DSCR +7.2/10.0
- 1% rule +5.4/10.0
- Rent growth +3.9/5.0
- Schools +3.6/10.0
- Livability +3.6/5.0
- Condition / age +2.5/5.0
- Appreciation +0.0/10.0
$114,900
🖨 Deal sheet 📄 Offer letter ✓ Due diligence
Listing remarks MLS
3 bedroom 1 bath ranch style house.
Key facts
- Spacious yard
- Single level living
- Two storage sheds
Tags
Property features AI
Finance
- Financial info: Offered for sale
Exterior
- Parking: No garage
- Home design: Single-story home
- Construction: Aluminum and vinyl siding; Slab foundation
- Exterior features: Residential zoning; Lot dimensions about 25 x 125
Interior
- Kitchen: Range; Refrigerator
- Bedrooms: Two bedrooms on the main level (approx. 9 x 9 and 10 x 10)
- Bathrooms: One full bathroom; One half bathroom; One main-level bathroom
- Heating & cooling: Central air conditioning; Natural gas heating
- Interior features: Total of 6 rooms
Neighborhood map
What this means for you Summary
Snapshot
- This is a 3-bed/1.0-bath single-family listed at $115k.
Deal economics
- At list price, monthly cash flow is $192 ($2k/yr) — positive.
- The deal already cash-flows at list — no discount required.
- Meets the 1% rule at list price ($1k rent vs $115k).
- Cap rate 8.3% vs local median 3.7% in Fairborn — top-decile yield for the area; either an underpriced asset or a hidden risk that comps aren't pricing in. Stress-test before assuming the spread holds.
Location & tenants
- Location reads 72/100 on livability (#374 in OH) — a middle-class / working-renter tenant base. Strengths: cost of living A+, housing A+; Watch: health & safety C-, schools D+, employment D+.
- Fairborn City (suburban): math 36% / reading 49% proficiency, ranked #520 of 656 in OH (top 79%) — families likely to look elsewhere, expect single-tenant / working-renter base with shorter leases.
- Market conditions: Rents rising fast (+5.8%/yr); 180 active listings in the ZIP; 12 comparable units currently listed for rent nearby; rentals at typical pace (median 14d on market — plan ~3-4 weeks tenant-placement turnaround); 797 units permitted in Greene County in 2024 (148 in 5+ unit buildings).
Forward outlook
- Local home prices are declining (-3.0%/yr); year-one equity from $794 of loan paydown is wiped out by about $3k of value loss. Plan a longer hold.
- At projected returns (-3.0% appreciation + 5.8% rent growth), your $32k cash investment doubles in ~10 years — after that, you're playing with house money.
Negotiation context
- Only 6 days on market — expect competitive offers; lowballing is unlikely to land.
- 3 sale attempts since 6y ago with the ask held roughly flat each time — persistent listings suggest the price (not the market) is what's stuck; bring a comps-based counter.
- Current owner paid $55k; list at $115k implies a 109% gain — meaningful room to come down on a strong offer.
Risks & watch-outs
- Watch-outs: built in 1950 — expect roof / HVAC / electrical / plumbing capex.
Questions for the listing agent
- Built in 1950 — when were the roof, HVAC, electrical panel, plumbing, and water heater last replaced?
- Is there a deadline driving the sale (1031 exchange, divorce, estate, relocation)? That informs how much negotiation room exists.
- Schools are D-rated, which usually means shorter tenancies and higher turnover. Who's the typical renter profile here, and what's been the actual vacancy rate?
- What's the average days-on-market for RENTAL listings here right now (not sales)? A rising rental-DOM trend means longer vacancies and softer asking-rent achievability than the comps imply.
- What's the recent tenant-quality profile in this submarket — average credit score on applications, eviction rate, late-payment / NSF rate, and stable-employment percentage? A property-management company in the area should have these aggregated.
- How much new for-sale + rental construction is in the pipeline within 1–3 miles? Heavy new supply typically softens prices + rents 12–24 months out; constrained supply supports both.
Investment metrics
- 1% rule
- 1.04% ✓
- Cap rate
- 8.29%
- Cash-on-cash
- 7.14%
- DSCR
- 1.32
- GRM
- 8.0
CMA / ARV
- ARV (on-the-fly)
- $152,064
- Comps found
- 12
Show comp detail 12 sales within ~0.75 mi
| Address | Dist | Beds/Ba | Sqft | Sold | Price | $/sf | Match |
|---|---|---|---|---|---|---|---|
| 1704 Rice Blvd | 0.19mi | 3/1.0 | 864 (0%) | 6mo | $120,000 | $139 | 86 |
| 1654 North Blvd | 0.14mi | 3/2.0 | 812 (-6%) | 6mo | $120,000 | $148 | 75 |
| 1724 Montgomery Ave | 0.15mi | 3/2.0 | 800 (-7%) | 8mo | $89,100 | $111 | 70 |
| 225 Forest St | 0.43mi | 3/1.5 | 875 (+1%) | 8mo | $164,000 | $187 | 69 |
| 201 State St | 0.61mi | 3/1.0 | 925 (+7%) | 3mo | $104,000 | $112 | 57 |
| 1421 Ironwood Dr | 0.64mi | 3/1.0 | 925 (+7%) | 6mo | $202,000 | $218 | 53 |
| 1469 Ironwood Dr | 0.64mi | 3/1.0 | 925 (+7%) | 7mo | $182,500 | $197 | 52 |
| 1858 Rice Blvd | 0.36mi | 2/1.0 (-1) | 744 (-14%) | 6mo | $120,000 | $161 | 50 |
| 1344 Ironwood Dr | 0.70mi | 3/1.0 | 925 (+7%) | 6mo | $184,900 | $200 | 50 |
| 2908 Valleyview Dr | 0.65mi | 3/1.5 | 936 (+8%) | 5mo | $201,900 | $216 | 49 |
| 1984 Zimmerman Rd | 0.61mi | 2/1.0 (-1) | 953 (+10%) | 6mo | $120,000 | $126 | 45 |
| 1329 Ironwood Dr | 0.73mi | 4/2.0 (+1) | 925 (+7%) | 6mo | $163,000 | $176 | 40 |
Match score weights: distance 35% · size 25% · config 20% · recency 20%. Top-matched comps best support the ARV.
Projected returns pro-forma
-3.0% appreciation · 5.75% rent growth · sell at horizon
- IRR
- -2.4%
- Equity multiple
- 0.91×
- Total profit
- $-3,045
- Equity at exit
- $17,132
- IRR
- 9.9%
- Equity multiple
- 1.86×
- Total profit
- $27,716
- Equity at exit
- $9,934
Cash invested: $32,172 (down + closing). Projections, not guarantees.
Landlord ↔ Tenant lean methodology
- Overall (STATE)
- 73 Landlord-Friendly
- State Ohio
- 73 Landlord-Friendly · R+6
- County
- — inherits STATE
- City
- — inherits STATE
ZIP-level market 45324
- Rents YoY
- 5.8%
- Active inventory
- 180
- Price-to-rent
- 8.0×
Monthly cashflow live
- Estimated rent
- $1,191 high interval (Pro) →
- Mortgage (P&I)
- −$603
- Tax from tax record
- −$99 /mo · $1,187/yr
- Insurance
- −$48
- HOA
- −$0
- Vacancy / Maint / Mgmt
- −$250
- Net cashflow
- $192
Break-even live
UW: 25.0% down · 7.5% · 30yr · 1.5% tax · 5.0% vac · 8.0% maint · 8.0% mgmt
Financing live
Cash to close
- Down payment
- $28,725
- Closing costs
- $3,447
- Reserves months
- —
- Total cash needed
- —
Loan-product check · same deal, 3 products live
Conventional
25% down · 7.5% · 30yr
- Down + closing
- —
- Monthly P&I
- —
- Monthly cashflow
- —
- DSCR
- —
- Eligible?
- —
Personal DTI + credit; lowest rate.
DSCR
20% down · 8.5% · 30yr
- Down + closing
- —
- Monthly P&I
- —
- Monthly cashflow
- —
- DSCR
- —
- Eligible?
- —
No personal income docs; deal must DSCR.
Hard money
10% down · 12.0% · 12mo
- Down + closing
- —
- Monthly P&I
- —
- Monthly cashflow
- —
- DSCR
- —
- Eligible?
- —
Short-term bridge; refi at stabilization.
Rent comps 12 comps
| Address | Beds | Baths | Sqft | Rent | $/sqft | DOM | Units | Dist |
|---|---|---|---|---|---|---|---|---|
| 1647 Stewart Blvd Unit 1645 Fairborn, OH | 2.0 | 1.5 | 1024 | $900 | $0.88 | 23d | 1 | 0.07mi |
| 1529 Miami Ave Fairborn, OH | 2.0 | 1.0 | 900 | $1,000 | $1.11 | 3d | 1 | 0.12mi |
| 1527 Miami Ave Fairborn, OH | 2.0 | 1.0 | 900 | $1,100 | $1.22 | 3d | 1 | 0.13mi |
| 1802 Montgomery Ave #1804 Fairborn, OH | 2.0 | 1.0 | 806 | $975 | $1.21 | 23d | 1 | 0.22mi |
| 408 Patterson St Fairborn, OH | 3.0 | 1.0 | 988 | $1,400 | $1.42 | 11d | 1 | 0.24mi |
| 281 Orville St Fairborn, OH | 2.0 | 1.0 | 850 | $899 | $1.06 | 14d | 1 | 0.34mi |
| 165 W Funderburg Rd Fairborn, OH | 2.0 | 1.0 | 827 | $995 | $1.20 | 2d | 2 | 0.51mi |
| 212 High St Fairborn, OH | 2.0 | 1.0 | 908 | $1,200 | $1.32 | 14d | 1 | 0.69mi |
| 1033 Victoria Ave Fairborn, OH | 2.0 | 1.0 | 768 | $1,300 | $1.69 | 14d | 1 | 1.16mi |
| 1040 S Central Ave Fairborn, OH | 3.0 | 1.0 | 860 | $1,499 | $1.74 | 23d | 1 | 1.19mi |
| 18 Old Yellow Springs Rd Fairborn, OH | 1.0–3.0 | 1.0–2.0 | 805 | $1,200 | $1.49 | 14d | 9 | 1.21mi |
| 124 E Lindberg Dr Fairborn, OH | 4.0 | 1.0 | 1075 | $1,495 | $1.39 | 43d | 1 | 1.35mi |
Listing history 6 events
-
2026-06-18days on market $114,900 Active 6 DOM
-
2026-06-17days on market $114,900 Active 5 DOM
-
2026-06-16days on market $114,900 Active 4 DOM
-
2026-06-15days on market $114,900 Active 3 DOM
-
2026-06-13remarks 386-char remark
-
2026-06-13$114,900 Active 1 DOM
ⓘ Source: listings_history table (triggers on properties + properties_extension) + one-shot
backfill from property_details.listing_events for pre-trigger history.
Tax reassessment forecast OH · Partial reset (capped growth)
- Current annual tax
- $1,187 · $99/mo
- Projected year-2 tax
- $1,490 · $124/mo
- Expected delta
- +$303/yr (+$25/mo · 25.5%)
ⓘ Screening estimate from a state-policy table — verify with the county assessor before closing.
Climate risk First Street
- Flood 1/10 Low FEMA zone X (unshaded) · 0% chance over 30 yrs
- Wildfire 1/10 Low
- Heat 3/10 Moderate 7 d/yr ≥101°F today · 18 d/yr by 30 yrs out
- Wind 2/10 Low
- Air quality 4/10 Moderate 4 unhealthy d/yr today · 5 by 30 yrs out
Nearby sold comps map
Loading sold comps map…
Walkable amenities ~0.75 mi
Loading nearby amenities…
Taxation est. · year 1
- Rental income
- $14,291
- − Mortgage interest
- −$6,436
- − Property taxes
- −$1,187
- − Insurance
- −$574
- − Repairs & maintenance
- −$1,143
- − Management
- −$1,143
- − Depreciation
- −$3,343
- Taxable income
- $465
- Est. tax owed @ 24.0%
- −$111
- After-tax cash flow
- $2,187/yr
For passive investors: Depreciation is non-cash, so a rental often shows a tax loss while cash-flowing — sheltering income. Rental losses are passive: they offset passive income freely, and up to $25,000/yr can offset ordinary (W-2) income if you actively participate and your MAGI is under $100k (phasing out to $0 by $150k); unused losses carry forward. On sale, claimed depreciation is recaptured at up to 25%, and gains may owe capital-gains tax (a 1031 exchange can defer both). Figures are a year-1 estimate at your 24.0% rate — not tax advice; consult a CPA.
Schools (NCES district)
- District
- Fairborn City
- NCES district ID
- 3904396
- Math proficiency
- 36% ▼ -17.00%
- Reading proficiency
- 49% ▼ -10.00%
- Median HH income
- $45,091
- Composite
- 36.05/100
- National rank
- #4772
- State rank
- #520 of 656 in OH
Livability — Fairborn
- Score
- 72/100
- State rank
- #374
- US rank
- #6101
Category grades
Schools grade is shown separately in the Schools card above.
Census & demographics
- Census place
- Fairborn, OH
- County
- Greene County · 132,120 people
- City population
- 41,194
- Metro
- Dayton-Kettering, OH
- Population (ZIP)
- 41,194
- Household income
- $64,979
- Rent vs Own
- Severe rent burden
- 1472.0
Population outlook (Greene County) Hauer SSP2
- Today (2025)
- 170,301 people
- By 2030
- 171,840 · +0.9%
- By 2040
- 171,408 · +0.7%
- By 2050
- 167,806 · -1.5%
- By 2075
- 154,430 · -9.3%
- By 2100
- 138,669 · -18.6%
Race, ethnicity, and origin ACS 2023
- Neighborhood character
- Predominantly White (78%)
- Race & ethnicity
- White 78% Two or more races 9% Black 8% Hispanic / Latino 3% Asian 2%
- Common ancestry
- Lithuanian 2% Slovak 2% Italian 1%
- Foreign-born
- 6% · Canada, China
- Languages at home
- 94% English-only · Spanish 1% German/W. Germanic 1% Other Indo-European 1%
Political lean MEDSL · Greene
- 2024 margin
- R (+19.8) · D 39.5% · R 59.3% · Other 1.2%
- 2008→2024 swing
- -1.4pp toward R · 2008: -18.4pp · 2024: -19.8pp
- All cycles
- 2024: R+19.8 2020: R+19.5 2016: R+24.5 2012: R+21.8 2008: R+18.4
Not yet ingested
- Civics
- —
Market trends
- HPI YoY
- ▼ -157.48%
- Current HPI
- 228.0801
- Rent YoY
- ▲ 5.75%
- Metro
- Dayton-Kettering, OH
- State GDP YoY
- ▲ 1.98%
- F500 in state
- 48
Industry mix (Fortune 500 HQ in OH)
| Industry | F500 HQs | Revenue |
|---|---|---|
| Insurance | 3 | $145B |
|
||
| Industrial Machinery | 3 | $49B |
|
||
| Financial Services | 3 | $24B |
|
||
| Consumer Goods | 2 | $93B |
|
||
| Aerospace / Defense | 2 | $47B |
|
||
| Utilities | 2 | $33B |
|
||
Price history
+1084.5% since first listed10 events — show timeline
- 2026-06-12 Listed $114,900 Dayton MLS
- 2020-07-16 Sold (Public Records) $55,000 Public Records
- 2020-07-01 Sold (MLS) $55,000 WRIST
- 2020-07-01 Sold (MLS) $55,000 Dayton MLS
- 2020-07-01 Sold (MLS) $55,000 Dayton MLS
- 2020-06-24 Pending — Dayton MLS
- 2020-06-12 Listed $67,000 Dayton MLS
- 2020-06-09 Listed $67,000 WRIST
- 1987-01-29 Sold (Public Records) $11,000 Public Records
- 1987-01-01 Sold (Public Records) $9,700 Public Records
Property tax history
+5.2%/yrLatest (2025): $1,187 · +0.7% YoY. Source: county tax records.
Cash-flow waterfall
monthlySold comps — $/sqft
last 12 mo · ≤1 miLoading sold comps…