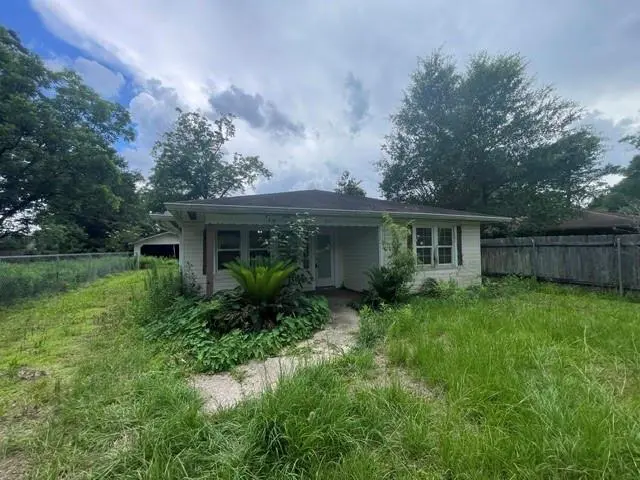
272 Hwy 40 Hwy E · Independence, LA
Flood risk 6/10 · Moderate
- FEMA flood zone
- X (unshaded)
- Chance of flooding over 30 yrs
- 0.73%
- Est. flood insurance / yr
- $507 – $1,088
Fire risk 5/10 · Moderate
- Est. fire insurance / yr
- $1,269 – $2,357
Heat risk 8/10 · Major
- Hot days now (above 109°F)
- 7 days/yr
- Hot days in 30 yrs
- 21 days/yr
Wind risk 9/10 · Severe
- Chance of severe wind over 30 yrs
- 99.0%
Air-quality risk 2/10 · Minimal
- Unhealthy air days now
- 0 days/yr
- Unhealthy air days in 30 yrs
- 1 days/yr
Risk factors via First Street. Map © Google.
Why this score? — see what drove the B grade
The composite is a weighted blend of 9 inputs, each scored 0–100. Each bar is that input's sub-score; the figure is the points it added to the 100-point composite (weight × sub-score).
- Cash flow +30.0/30.0
- ARV discount +15.0/15.0
- DSCR +10.0/10.0
- 1% rule +8.5/10.0
- Livability +2.8/5.0
- Rent growth +2.5/5.0
- Condition / age +2.5/5.0
- Schools +2.0/10.0
- Appreciation +0.0/10.0
$115,000
🖨 Deal sheet 📄 Offer letter ✓ Due diligence
Listing remarks MLS
There lots of Potential in this 3 Bdr/ 2 Bath home located in the City Limits of Independence. FEATURES: Detached Carport/Storage, covered 16' x 11' Patio, Central A/H, Fenced (Chain link) Backyard, and 7.5' x 17.5 Front Porch. Located a short distance to I-55.
Key facts
- Detached carport
- Front porch
- Covered patio
Tags
Property features AI
Exterior
- Parking: Detached carport (one space)
- Utilities: Public water; Public sewer
- Home design: Single-story home; Very good condition; Slab foundation
- Construction: Asphalt shingle roof
- Exterior features: Fenced yard; Concrete covered patio/porch; Shed(s)
Interior
- Kitchen: Dishwasher
- Bedrooms: Total of 7 rooms (bedroom count not specified separately)
- Bathrooms: 2 full bathrooms
- Heating & cooling: Central heating; Central air conditioning
- Interior features: Cable TV
- Laundry & utility: Washer hookup; Dryer hookup
Neighborhood map
What this means for you Summary
Snapshot
- This is a 3-bed/2.0-bath single-family listed at $115k.
Deal economics
- At list price, monthly cash flow is $509 ($6k/yr) — positive.
- The deal already cash-flows at list — no discount required.
- Meets the 1% rule at list price ($2k rent vs $115k).
- Recommended offer: $113k (1.5% below list) — sets the bar for market timing.
- Cap rate 11.6% vs local median 4.0% in Independence — top-decile yield for the area; either an underpriced asset or a hidden risk that comps aren't pricing in. Stress-test before assuming the spread holds.
Location & tenants
- Location reads 56/100 on livability (#351 in LA) — a working-class tenant base; expect higher turnover. Strengths: cost of living A+, health & safety A+; Watch: schools D, crime F, amenities F.
- Tangipahoa Parish (rural): math 18% / reading 29% proficiency, ranked #63 of 98 in LA (top 64%) — low school quality limits family demand, transient renter base, plan for 1-2y turnover; 73% free/reduced lunch — lower-income household profile, screen leases tightly.
- Market conditions: 108 active listings in the ZIP; 1 comparable units currently listed for rent nearby; 1,085 units permitted in Tangipahoa Parish in 2024 (378 in 5+ unit buildings).
Forward outlook
- Local home prices are declining (-3.0%/yr); year-one equity from $795 of loan paydown is wiped out by about $3k of value loss. Plan a longer hold.
- Tangipahoa County population projected at +22% by 2050 — long-run rental-demand tailwind backs the buy-and-hold thesis.
- At projected returns (-3.0% appreciation + 3.0% rent growth), your $32k cash investment doubles in ~7 years — after that, you're playing with house money.
Negotiation context
- It's been on market 17 days — a 2% lower offer ($113k) is reasonable based on typical stale-listing flexibility.
- 3 sale attempts since 6y ago with the ask held roughly flat each time — persistent listings suggest the price (not the market) is what's stuck; bring a comps-based counter.
Risks & watch-outs
- Watch-outs: built in 1959 — expect roof / HVAC / electrical / plumbing capex.
- Climate carrying-cost: major flood risk; severe wind risk, 99% chance of damaging wind over 30y; moderate wildfire risk; extreme-heat days projected 7→21/yr by 2055 (HVAC capex compounding) — expect insurance premiums to compound above CPI over the hold.
Questions for the listing agent
- Built in 1959 — when were the roof, HVAC, electrical panel, plumbing, and water heater last replaced?
- Is there a deadline driving the sale (1031 exchange, divorce, estate, relocation)? That informs how much negotiation room exists.
- Schools are D-rated, which usually means shorter tenancies and higher turnover. Who's the typical renter profile here, and what's been the actual vacancy rate?
- Crime grade is F in this area — have there been break-ins, vandalism, or insurance claims at this property in the last 3 years? What carrier currently insures it and at what premium?
- What's the average days-on-market for RENTAL listings here right now (not sales)? A rising rental-DOM trend means longer vacancies and softer asking-rent achievability than the comps imply.
- What's the recent tenant-quality profile in this submarket — average credit score on applications, eviction rate, late-payment / NSF rate, and stable-employment percentage? A property-management company in the area should have these aggregated.
- How much new for-sale + rental construction is in the pipeline within 1–3 miles? Heavy new supply typically softens prices + rents 12–24 months out; constrained supply supports both.
Investment metrics
- 1% rule
- 1.35% ✓
- Cap rate
- 11.61%
- Cash-on-cash
- 18.99%
- DSCR
- 1.84
- GRM
- 6.2
CMA / ARV
- ARV (on-the-fly)
- $167,027
- Comps found
- 7
Show comp detail 7 sales within ~0.75 mi
| Address | Dist | Beds/Ba | Sqft | Sold | Price | $/sf | Match |
|---|---|---|---|---|---|---|---|
| 51173 River Bend Dr | 0.34mi | 3/2.0 | 1,525 (-2%) | 1mo | $216,000 | $142 | 80 |
| 51201 River Bend Dr | 0.34mi | 4/2.0 (+1) | 1,535 (-2%) | 1mo | $216,000 | $141 | 76 |
| 178 Tulane Ave | 0.46mi | 3/2.0 | 1,551 (-1%) | 5mo | $33,250 | $21 | 74 |
| 250 Tiger Ave | 0.15mi | 3/2.0 | 1,617 (+4%) | 22mo | $175,000 | $108 | 69 |
| 424 Cypress St | 0.44mi | 3/2.0 | 1,627 (+4%) | 21mo | $174,900 | $107 | 55 |
| 351 Pine St | 0.52mi | 3/1.5 | 1,489 (-5%) | 16mo | $68,000 | $46 | 52 |
| 541 W Third St | 0.61mi | 4/2.5 (+1) | 1,656 (+6%) | 12mo | $158,000 | $95 | 44 |
Match score weights: distance 35% · size 25% · config 20% · recency 20%. Top-matched comps best support the ARV.
Projected returns pro-forma
-3.0% appreciation · 3.0% rent growth · sell at horizon
- IRR
- 10.8%
- Equity multiple
- 1.43×
- Total profit
- $13,789
- Equity at exit
- $17,147
- IRR
- 19.9%
- Equity multiple
- 2.67×
- Total profit
- $53,687
- Equity at exit
- $9,943
Cash invested: $32,200 (down + closing). Projections, not guarantees.
Landlord ↔ Tenant lean methodology
- Overall (STATE)
- 90 Strongly Landlord-Friendly
- State Louisiana
- 90 Strongly Landlord-Friendly · R+12
- County
- — inherits STATE
- City
- — inherits STATE
ZIP-level market 70443
- Active inventory
- 108
- Price-to-rent
- 6.2×
Monthly cashflow live
- Estimated rent
- $1,550 medium interval (Pro) →
- Mortgage (P&I)
- −$603
- Tax from tax record
- −$64 /mo · $768/yr
- Insurance
- −$48
- HOA
- −$0
- Vacancy / Maint / Mgmt
- −$326
- Net cashflow
- $509
Break-even live
UW: 25.0% down · 7.5% · 30yr · 1.5% tax · 5.0% vac · 8.0% maint · 8.0% mgmt
Financing live
Cash to close
- Down payment
- $28,750
- Closing costs
- $3,450
- Reserves months
- —
- Total cash needed
- —
Loan-product check · same deal, 3 products live
Conventional
25% down · 7.5% · 30yr
- Down + closing
- —
- Monthly P&I
- —
- Monthly cashflow
- —
- DSCR
- —
- Eligible?
- —
Personal DTI + credit; lowest rate.
DSCR
20% down · 8.5% · 30yr
- Down + closing
- —
- Monthly P&I
- —
- Monthly cashflow
- —
- DSCR
- —
- Eligible?
- —
No personal income docs; deal must DSCR.
Hard money
10% down · 12.0% · 12mo
- Down + closing
- —
- Monthly P&I
- —
- Monthly cashflow
- —
- DSCR
- —
- Eligible?
- —
Short-term bridge; refi at stabilization.
Rent comps 1 comps
| Address | Beds | Baths | Sqft | Rent | $/sqft | DOM | Units | Dist |
|---|---|---|---|---|---|---|---|---|
| 52520 Highway 1065 Independence, LA | 3.0 | 2.0 | 1423 | $1,550 | $1.09 | 43d | 1 | 1.29mi |
Listing history 14 events
-
2026-06-19days on market $115,000 Active 17 DOM
-
2026-06-18days on market $115,000 Active 16 DOM
-
2026-06-17days on market $115,000 Active 15 DOM
-
2026-06-16days on market $115,000 Active 14 DOM
-
2026-06-15days on market $115,000 Active 13 DOM
-
2026-06-14days on market $115,000 Active 11 DOM
-
2026-06-13days on market $115,000 Active 10 DOM
-
2026-06-10days on market $115,000 Active 8 DOM
-
2026-06-09days on market $115,000 Active 7 DOM
-
2026-06-08days on market $115,000 Active 6 DOM
-
2026-06-07days on market $115,000 Active 5 DOM
-
2026-06-05days on market $115,000 Active 2 DOM
-
2026-06-03remarks 261-char remark
-
2026-06-03$115,000 Active 1 DOM
ⓘ Source: listings_history table (triggers on properties + properties_extension) + one-shot
backfill from property_details.listing_events for pre-trigger history.
Tax reassessment forecast LA · Resets to sale price
- Current annual tax
- $768 · $64/mo
- Projected year-2 tax
- $768 · $64/mo
- Expected delta
- $0/yr ($0/mo · 0.0%)
ⓘ Screening estimate from a state-policy table — verify with the county assessor before closing.
Climate risk First Street
- Flood 6/10 Major FEMA zone X (unshaded) · 73% chance over 30 yrs
- Wildfire 5/10 Major
- Heat 8/10 Severe 7 d/yr ≥109°F today · 21 d/yr by 30 yrs out
- Wind 9/10 Extreme 99% chance of damaging wind over 30 yrs
- Air quality 2/10 Low 0 unhealthy d/yr today · 1 by 30 yrs out
Nearby sold comps map
Loading sold comps map…
Walkable amenities ~0.75 mi
Loading nearby amenities…
Taxation est. · year 1
- Rental income
- $18,600
- − Mortgage interest
- −$6,442
- − Property taxes
- −$768
- − Insurance
- −$575
- − Repairs & maintenance
- −$1,488
- − Management
- −$1,488
- − Depreciation
- −$3,345
- Taxable income
- $4,493
- Est. tax owed @ 24.0%
- −$1,078
- After-tax cash flow
- $5,035/yr
For passive investors: Depreciation is non-cash, so a rental often shows a tax loss while cash-flowing — sheltering income. Rental losses are passive: they offset passive income freely, and up to $25,000/yr can offset ordinary (W-2) income if you actively participate and your MAGI is under $100k (phasing out to $0 by $150k); unused losses carry forward. On sale, claimed depreciation is recaptured at up to 25%, and gains may owe capital-gains tax (a 1031 exchange can defer both). Figures are a year-1 estimate at your 24.0% rate — not tax advice; consult a CPA.
Schools (NCES district)
- District
- Tangipahoa Parish
- NCES district ID
- 2201680
- Math proficiency
- 18% ▼ -32.00%
- Reading proficiency
- 29% ▼ -31.00%
- Median HH income
- $41,283
- Composite
- 19.94/100
- National rank
- #8676
- State rank
- #63 of 98 in LA
Livability — Independence
- Score
- 56/100
- State rank
- #351
- US rank
- #23010
Category grades
Schools grade is shown separately in the Schools card above.
Census & demographics
- Census place
- Independence, LA
- Population (ZIP)
- 8,359
Population outlook (Tangipahoa County) Hauer SSP2
- Today (2025)
- 144,204 people
- By 2030
- 151,413 · +5.0%
- By 2040
- 164,374 · +14.0%
- By 2050
- 175,427 · +21.7%
- By 2075
- 195,165 · +35.3%
- By 2100
- 201,641 · +39.8%
Race, ethnicity, and origin ACS 2023
- Neighborhood character
- Diverse neighborhood (Simpson 0.61)
- Race & ethnicity
- White 53% Black 28% Hispanic / Latino 16% Two or more races 12%
- Hispanic origin (detail)
- Mexican 5%
- Common ancestry
- Lithuanian 7% Slovak 2% Portuguese 1%
- Foreign-born
- 8% · Canada
- Languages at home
- 89% English-only · Spanish 11%
Political lean MEDSL · Tangipahoa
- 2024 margin
- Solid R (+37.4) · D 30.6% · R 68.0% · Other 1.3%
- 2008→2024 swing
- -6.5pp toward R · 2008: -30.9pp · 2024: -37.4pp
- All cycles
- 2024: R+37.4 2020: R+32.8 2016: R+32.6 2012: R+27.7 2008: R+30.9
Not yet ingested
- Civics
- —
Market trends
- HPI YoY
- ▼ -59.69%
- Current HPI
- 101.0489
- Rent YoY
- —
- Metro
- —
- State GDP YoY
- ▲ 3.29%
- F500 in state
- 10
Industry mix (Fortune 500 HQ in LA)
| Industry | F500 HQs | Revenue |
|---|---|---|
| Telecommunications | 2 | $23B |
|
||
| Utilities | 1 | $12B |
|
||
| Wholesale / Distribution | 1 | $5B |
|
||
| Advertising | 1 | $2B |
|
||
Price history
+310.7% since first listed5 events — show timeline
- 2026-06-01 Listed $115,000 AcadianaMLS
- 2026-06-01 Listed $115,000 GSREIN
- 2021-05-03 Sold (Public Records) $135,900 Public Records
- 2020-12-12 Listed $135,900 AcadianaMLS
- 1993-01-28 Sold (Public Records) $28,000 Public Records
Property tax history
+4.9%/yrLatest (2025): $768 · +0.6% YoY. Source: county tax records.
Cash-flow waterfall
monthlySold comps — $/sqft
last 12 mo · ≤1 miLoading sold comps…