 🏷️ Likely Rental
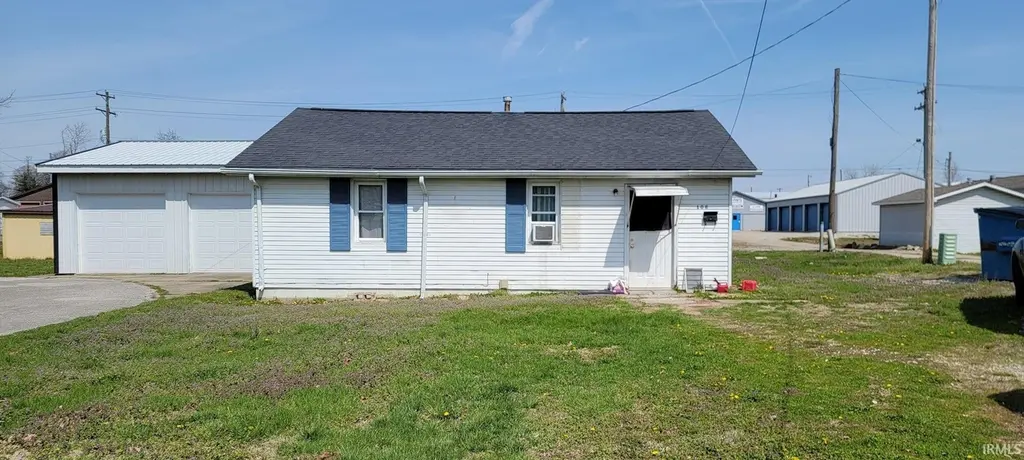
106 SW 2nd St · Loogootee, IN
Flood risk No data
- FEMA flood zone
- —
- Chance of flooding over 30 yrs
- —
- Est. flood insurance / yr
- —
Fire risk No data
- Est. fire insurance / yr
- —
Heat risk No data
- Hot days now (above threshold)
- —
- Hot days in 30 yrs
- —
Wind risk No data
- Chance of severe wind over 30 yrs
- —
Air-quality risk No data
- Unhealthy air days now
- —
- Unhealthy air days in 30 yrs
- —
Risk factors via First Street. Map © Google.
Why this score? — see what drove the B+ grade
The composite is a weighted blend of 9 inputs, each scored 0–100. Each bar is that input's sub-score; the figure is the points it added to the 100-point composite (weight × sub-score).
- Cash flow +27.0/30.0
- ARV discount +15.0/15.0
- DSCR +9.3/10.0
- 1% rule +7.0/10.0
- Appreciation +6.5/10.0
- Schools +3.8/10.0
- Livability +3.7/5.0
- Rent growth +2.5/5.0
- Condition / age +2.5/5.0
$69,900
🖨 Deal sheet 📄 Offer letter ✓ Due diligence
Listing remarks MLS
1 Bed/1 Bath Rental Home For sale in Loogootee Indiana right beside the Subway. . Great Location. Good Roof. Good Renter. Currently Producing an annual Rental Income of approx. $9000.00 – Buy today and start cashing those monthly checks tomorrow. Even when your on Vacation – Wow!!
Key facts
- 8,712 sq ft lot
- Built 1960
- Listed 83 days
Neighborhood map
What this means for you Summary
Snapshot
- This is a 2-bed/1.0-bath single-family listed at $70k.
Deal economics
- At list price, monthly cash flow is $195 ($2k/yr) — positive.
- The deal already cash-flows at list — no discount required.
- Meets the 1% rule at list price ($838 rent vs $70k).
- Recommended offer: $66k (6.0% below list) — sets the bar for market timing.
- Cap rate 9.6% vs local median 2.8% in Loogootee — top-decile yield for the area; either an underpriced asset or a hidden risk that comps aren't pricing in. Stress-test before assuming the spread holds.
Location & tenants
- Location reads 74/100 on livability (#74 in IN, #4,663 nationally) — a middle-class / working-renter tenant base. Strengths: crime A+, cost of living A+, housing A+; Watch: employment D, amenities F, commute F.
- Loogootee Community School Corporation (rural): math 42% / reading 48% proficiency, ranked #97 of 301 in IN (top 32%) — families likely to look elsewhere, expect single-tenant / working-renter base with shorter leases.
- Market conditions: 63 active listings in the ZIP; 2 units permitted in Martin County in 2024 (0 in 5+ unit buildings).
Forward outlook
- In year one you build about $3k of equity ($483 loan paydown + $2k appreciation (3.0% local appreciation)).
- Martin County population projected at -22% by 2050 — secular population decline; favor cash flow + early exit over multi-decade hold.
- At projected returns (3.0% appreciation + 3.0% rent growth), your $20k cash investment doubles in ~4 years — after that, you're playing with house money.
Negotiation context
- It's been on market 84 days — a 6% lower offer ($66k) is reasonable based on typical stale-listing flexibility.
Questions for the listing agent
- It's been on market 84 days. Have you received any prior offers? Is the seller open to a 6% concession, seller financing, or rate buy-down credit?
- Built in 1960 — when were the roof, HVAC, electrical panel, plumbing, and water heater last replaced?
- Why hasn't it sold? Are there any deal-killer items the seller is aware of (foundation, flood, title, zoning, code violations)?
- Is there a deadline driving the sale (1031 exchange, divorce, estate, relocation)? That informs how much negotiation room exists.
- What's the average days-on-market for RENTAL listings here right now (not sales)? A rising rental-DOM trend means longer vacancies and softer asking-rent achievability than the comps imply.
- What's the recent tenant-quality profile in this submarket — average credit score on applications, eviction rate, late-payment / NSF rate, and stable-employment percentage? A property-management company in the area should have these aggregated.
- How much new for-sale + rental construction is in the pipeline within 1–3 miles? Heavy new supply typically softens prices + rents 12–24 months out; constrained supply supports both.
Investment metrics
- 1% rule
- 1.20% ✓
- Cap rate
- 9.64%
- Cash-on-cash
- 11.96%
- DSCR
- 1.53
- GRM
- 6.9
CMA / ARV
- ARV (median comp)
- $108,934
- List price
- $69,900
- Delta
- -35.83%
- Verdict
- UNDERPRICED
- Comps
- 12 within 1.0 mi
Show comp detail 5 sales within ~0.75 mi
| Address | Dist | Beds/Ba | Sqft | Sold | Price | $/sf | Match |
|---|---|---|---|---|---|---|---|
| 106 SW 3rd St | 0.08mi | 2/1.0 | 840 (+5%) | 18mo | $76,000 | $90 | 73 |
| 302 1/2 Grant St | 0.08mi | 1/1.0 (-1) | 832 (+4%) | 16mo | $38,500 | $46 | 71 |
| 506 SW 1st St | 0.25mi | 2/1.0 | 768 (-4%) | 13mo | $102,500 | $133 | 70 |
| 305 NE 2nd St | 0.34mi | 2/1.0 | 720 (-10%) | 8mo | $123,000 | $171 | 60 |
| 409 SW 3rd St | 0.20mi | 2/1.0 | 903 (+13%) | 16mo | $55,000 | $61 | 56 |
Match score weights: distance 35% · size 25% · config 20% · recency 20%. Top-matched comps best support the ARV.
Projected returns pro-forma
3.02% appreciation · 3.0% rent growth · sell at horizon
- IRR
- 18.7%
- Equity multiple
- 2.07×
- Total profit
- $20,901
- Equity at exit
- $31,493
- IRR
- 20.0%
- Equity multiple
- 3.91×
- Total profit
- $56,944
- Equity at exit
- $48,583
Cash invested: $19,572 (down + closing). Projections, not guarantees.
Landlord ↔ Tenant lean methodology
- Overall (STATE)
- 90 Strongly Landlord-Friendly
- State Indiana
- 90 Strongly Landlord-Friendly · R+11
- County
- — inherits STATE
- City
- — inherits STATE
ZIP-level market 47553
- Home prices YoY
- 1.4%
- Active inventory
- 63
- Price-to-rent
- 6.9×
Monthly cashflow live
- Estimated rent
- $838 medium interval (Pro) →
- Mortgage (P&I)
- −$367
- Tax from tax record
- −$72 /mo · $860/yr
- Insurance
- −$29
- HOA
- −$0
- Vacancy / Maint / Mgmt
- −$176
- Net cashflow
- $195
Break-even live
UW: 25.0% down · 7.5% · 30yr · 1.5% tax · 5.0% vac · 8.0% maint · 8.0% mgmt
Financing live
Cash to close
- Down payment
- $17,475
- Closing costs
- $2,097
- Reserves months
- —
- Total cash needed
- —
Loan-product check · same deal, 3 products live
Conventional
25% down · 7.5% · 30yr
- Down + closing
- —
- Monthly P&I
- —
- Monthly cashflow
- —
- DSCR
- —
- Eligible?
- —
Personal DTI + credit; lowest rate.
DSCR
20% down · 8.5% · 30yr
- Down + closing
- —
- Monthly P&I
- —
- Monthly cashflow
- —
- DSCR
- —
- Eligible?
- —
No personal income docs; deal must DSCR.
Hard money
10% down · 12.0% · 12mo
- Down + closing
- —
- Monthly P&I
- —
- Monthly cashflow
- —
- DSCR
- —
- Eligible?
- —
Short-term bridge; refi at stabilization.
Listing history 18 events
-
2026-06-19days on market $69,900 Active 84 DOM
-
2026-06-18days on market $69,900 Active 83 DOM
-
2026-06-17days on market $69,900 Active 82 DOM
-
2026-06-16days on market $69,900 Active 81 DOM
-
2026-06-15days on market $69,900 Active 80 DOM
-
2026-06-14days on market $69,900 Active 78 DOM
-
2026-06-12days on market $69,900 Active 77 DOM
-
2026-06-09days on market $69,900 Active 74 DOM
-
2026-06-08days on market $69,900 Active 73 DOM
-
2026-06-07days on market $69,900 Active 72 DOM
-
2026-06-07days on market $69,900 Active 71 DOM
-
2026-06-04days on market $69,900 Active 68 DOM
-
2026-06-02days on market $69,900 Active 67 DOM
-
2026-06-01days on market $69,900 Active 66 DOM
-
2026-05-31days on market $69,900 Active 65 DOM
-
2026-05-31days on market $69,900 Active 64 DOM
-
2026-03-27$75,000 Active 298-char remark
Show marketing remark (298 chars)
1 Bed/1 Bath Rental Home For sale in Loogootee Indiana right beside the Subway. . Great Location. Good Roof. Good Renter. Currently Producing an annual Rental Income of approx. $9000.00 – Buy today and start cashing those monthly checks tomorrow. Even when your on Vacation – Wow!!
-
2023-02-15soldstatus $300,000
ⓘ Source: listings_history table (triggers on properties + properties_extension) + one-shot
backfill from property_details.listing_events for pre-trigger history.
Tax reassessment forecast IN · Partial reset (capped growth)
- Current annual tax
- $860 · $72/mo
- Projected year-2 tax
- $860 · $72/mo
- Expected delta
- $0/yr ($0/mo · 0.0%)
ⓘ Screening estimate from a state-policy table — verify with the county assessor before closing.
Nearby sold comps map
Loading sold comps map…
Walkable amenities ~0.75 mi
Loading nearby amenities…
Taxation est. · year 1
- Rental income
- $10,061
- − Mortgage interest
- −$3,915
- − Property taxes
- −$860
- − Insurance
- −$350
- − Repairs & maintenance
- −$805
- − Management
- −$805
- − Depreciation
- −$2,033
- Taxable income
- $1,293
- Est. tax owed @ 24.0%
- −$310
- After-tax cash flow
- $2,030/yr
For passive investors: Depreciation is non-cash, so a rental often shows a tax loss while cash-flowing — sheltering income. Rental losses are passive: they offset passive income freely, and up to $25,000/yr can offset ordinary (W-2) income if you actively participate and your MAGI is under $100k (phasing out to $0 by $150k); unused losses carry forward. On sale, claimed depreciation is recaptured at up to 25%, and gains may owe capital-gains tax (a 1031 exchange can defer both). Figures are a year-1 estimate at your 24.0% rate — not tax advice; consult a CPA.
Schools (NCES district)
- District
- Loogootee Community School Corporation
- NCES district ID
- 1806060
- Math proficiency
- 42% ▼ -10.00%
- Reading proficiency
- 48% ▼ -6.00%
- Median HH income
- $47,513
- Composite
- 38.38/100
- National rank
- #4209
- State rank
- #97 of 301 in IN
Livability — Loogootee
- Score
- 74/100
- State rank
- #74
- US rank
- #4663
Category grades
Schools grade is shown separately in the Schools card above.
Census & demographics
- Census place
- Loogootee, IN
- Population (ZIP)
- 8,613
Population outlook (Martin County) Hauer SSP2
- Today (2025)
- 9,585 people
- By 2030
- 9,198 · -4.0%
- By 2040
- 8,365 · -12.7%
- By 2050
- 7,518 · -21.6%
- By 2075
- 5,674 · -40.8%
- By 2100
- 3,916 · -59.1%
Race, ethnicity, and origin ACS 2023
- Neighborhood character
- Predominantly White (95%)
- Race & ethnicity
- White 95% Two or more races 2% Hispanic / Latino 1%
- Common ancestry
- Italian 5% Slovak 3% Lithuanian 2%
- Foreign-born
- 1%
- Languages at home
- 89% English-only · German/W. Germanic 10% Spanish 1%
Political lean MEDSL · Martin
- 2024 margin
- Solid R (+60.7) · D 18.7% · R 79.4% · Other 1.9%
- 2008→2024 swing
- -31.8pp toward R · 2008: -28.9pp · 2024: -60.7pp
- All cycles
- 2024: R+60.7 2020: R+58.7 2016: R+58.5 2012: R+40.3 2008: R+28.9
Not yet ingested
- Civics
- —
Market trends
- HPI YoY
- ▲ 3.02%
- Current HPI
- 217.7385
- Rent YoY
- —
- Metro
- —
- State GDP YoY
- ▲ 2.90%
- F500 in state
- 18
Industry mix (Fortune 500 HQ in IN)
| Industry | F500 HQs | Revenue |
|---|---|---|
| Industrial Machinery | 2 | $37B |
|
||
| Healthcare | 1 | $177B |
|
||
| Pharmaceuticals | 1 | $45B |
|
||
| Metals / Steel | 1 | $18B |
|
||
| Agriculture | 1 | $17B |
|
||
| Packaging | 1 | $12B |
|
||
Price history
-75.0% since first listed2 events — show timeline
- 2026-03-27 Listed $75,000 IRMLS
- 2023-02-15 Sold (Public Records) $300,000 Public Records
Property tax history
+2.8%/yrLatest (2024): $860 · +7.5% YoY. Source: county tax records.
Cash-flow waterfall
monthlySold comps — $/sqft
last 12 mo · ≤1 miLoading sold comps…