9414 Pecan Tree Dr · Gardere, LA
Flood risk 6/10 · Moderate
- FEMA flood zone
- X
- Chance of flooding over 30 yrs
- 0.72%
- Est. flood insurance / yr
- $507 – $1,088
Fire risk 1/10 · Minimal
- Est. fire insurance / yr
- $1,269 – $2,357
Heat risk 8/10 · Major
- Hot days now (above 108°F)
- 7 days/yr
- Hot days in 30 yrs
- 21 days/yr
Wind risk 9/10 · Severe
- Chance of severe wind over 30 yrs
- 99.0%
Air-quality risk 3/10 · Minor
- Unhealthy air days now
- 3 days/yr
- Unhealthy air days in 30 yrs
- 3 days/yr
Risk factors via First Street. Map © Google.
Why this score? — see what drove the D grade
The composite is a weighted blend of 9 inputs, each scored 0–100. Each bar is that input's sub-score; the figure is the points it added to the 100-point composite (weight × sub-score).
- ARV discount +15.0/15.0
- Cash flow +9.5/30.0
- Livability +3.2/5.0
- DSCR +2.7/10.0
- Rent growth +2.7/5.0
- 1% rule +2.5/10.0
- Condition / age +2.5/5.0
- Schools +2.4/10.0
- Appreciation +0.0/10.0
$164,900
🖨 Deal sheet 📄 Offer letter ✓ Due diligence
Listing remarks MLS
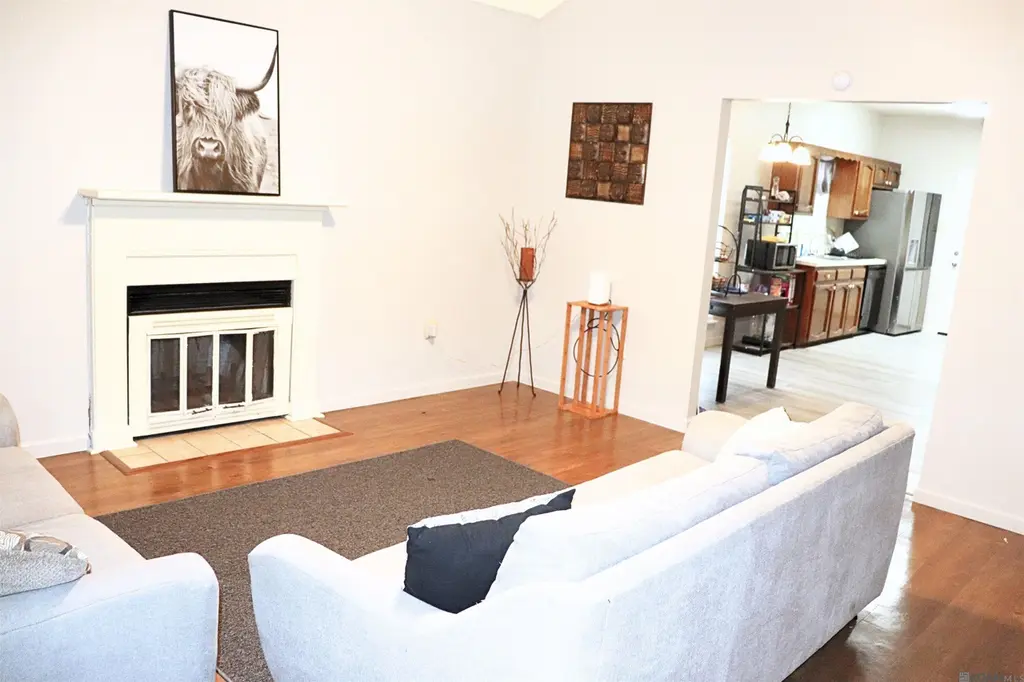
Charming Corner Lot Home in a Quiet Neighborhood! Don't miss this adorable, well-maintained home situated on a desirable corner lot in a peaceful neighborhood! Featuring updated flooring in both bedrooms and hallway, plus a new A/C system installed in 2021. The living room boasts a beautiful cathedral ceiling, creating an open and airy feel. The primary bedroom includes a private ensuite, and the fully fenced backyard offers great space for pets, play, or entertaining. You'll also enjoy a 2-car covered carport and extra storage. Prime location just minutes from LSU, shopping, and dining! Located in Flood Zone X -- no flood insurance required!
Key facts
- New a/c system
- Updated flooring
- Cathedral ceiling
Tags
Neighborhood map
What this means for you Summary
Snapshot
- This is a 2-bed/2.0-bath single-family listed at $165k.
Deal economics
- At list price, monthly cash flow is $-114 ($-1k/yr) — negative.
- To cash-flow at today's rent, offer at most $145k (12.2% below list).
- To meet the 1% rule (rent ≥ 1% of price), the offer needs to be $123k (25.2% below list).
- Recommended offer: $123k (25.2% below list) — sets the bar for 1% rule.
- Cap rate 5.5% vs local median 4.1% in Gardere — top-decile yield for the area; either an underpriced asset or a hidden risk that comps aren't pricing in. Stress-test before assuming the spread holds.
Location & tenants
- Location reads 64/100 on livability (#167 in LA) — a middle-class / working-renter tenant base. Strengths: cost of living A, housing A; Watch: crime D, employment D, amenities F.
- East Baton Rouge Parish (urban): math 22% / reading 34% proficiency, ranked #47 of 98 in LA (top 48%) — low school quality limits family demand, transient renter base, plan for 1-2y turnover; 77% free/reduced lunch — lower-income household profile, screen leases tightly.
- Market conditions: Rents flat; 625 active listings in the ZIP; 40 comparable units currently listed for rent nearby; rentals at typical pace (median 24d on market — plan ~3-4 weeks tenant-placement turnaround); 40% of comp listings sitting > 30 days — soft ceiling on asking rent; solid renter incomes; 2,252 units permitted in East Baton Rouge Parish in 2024 (440 in 5+ unit buildings).
- This rent is only 16% of the median local income ($92k/yr) — well below the 30% rent-burden line; pricing power to push rent on renewal without tenant pushback.
Forward outlook
- Local home prices are declining (-3.0%/yr); year-one equity from $1k of loan paydown is wiped out by about $5k of value loss. Plan a longer hold.
- East Baton Rouge County population projected at +4% by 2050 — modest demand growth; plan on rents tracking national, not racing it.
Negotiation context
- It's been on market 246 days — a 12% lower offer ($145k) is reasonable based on typical stale-listing flexibility.
- 15 sale attempts since 24y ago with the ask held roughly flat each time — persistent listings suggest the price (not the market) is what's stuck; bring a comps-based counter.
Risks & watch-outs
- Climate carrying-cost: major flood risk; severe wind risk, 99% chance of damaging wind over 30y; extreme-heat days projected 7→21/yr by 2055 (HVAC capex compounding) — expect insurance premiums to compound above CPI over the hold.
Questions for the listing agent
- What do current leases actually rent for vs. the listed asking? Can we see a recent rent roll and the last 12 months of T-12 income?
- It's been on market 246 days. Have you received any prior offers? Is the seller open to a 25% concession, seller financing, or rate buy-down credit?
- Why hasn't it sold? Are there any deal-killer items the seller is aware of (foundation, flood, title, zoning, code violations)?
- Is there a deadline driving the sale (1031 exchange, divorce, estate, relocation)? That informs how much negotiation room exists.
- Crime grade is D in this area — have there been break-ins, vandalism, or insurance claims at this property in the last 3 years? What carrier currently insures it and at what premium?
- The area grade is low — what's the realistic commute time and amenity access for the typical tenant pool here? Any planned neighborhood developments (good or bad) we should know about?
- What's the average days-on-market for RENTAL listings here right now (not sales)? A rising rental-DOM trend means longer vacancies and softer asking-rent achievability than the comps imply.
- What's the recent tenant-quality profile in this submarket — average credit score on applications, eviction rate, late-payment / NSF rate, and stable-employment percentage? A property-management company in the area should have these aggregated.
- How much new for-sale + rental construction is in the pipeline within 1–3 miles? Heavy new supply typically softens prices + rents 12–24 months out; constrained supply supports both.
Investment metrics
- 1% rule
- 0.75% ✗
- Cap rate
- 5.47%
- Cash-on-cash
- -2.95%
- DSCR
- 0.87
- GRM
- 11.1
CMA / ARV
- ARV (median comp)
- $202,523
- List price
- $164,900
- Delta
- -18.58%
- Verdict
- UNDERPRICED
- Comps
- 20 within 1.0 mi
Show comp detail 8 sales within ~0.75 mi
| Address | Dist | Beds/Ba | Sqft | Sold | Price | $/sf | Match |
|---|---|---|---|---|---|---|---|
| 1835 Fountain Ave | 0.48mi | 2/2.0 | 1,150 (+2%) | 1mo | $155,000 | $135 | 74 |
| 9919 Glerma Dr | 0.14mi | 3/2.0 (+1) | 1,222 (+8%) | 2mo | $225,000 | $184 | 73 |
| 1025 Elvin Dr | 0.12mi | 3/2.0 (+1) | 1,243 (+10%) | 14mo | $195,000 | $157 | 60 |
| 9555 Old Hermitage Pkwy | 0.50mi | 3/2.0 (+1) | 1,200 (+6%) | 1mo | $235,000 | $196 | 60 |
| 2131 Fountain Ave | 0.43mi | 2/2.0 | 1,155 (+2%) | 19mo | $124,700 | $108 | 60 |
| 520 Westhaven Blvd | 0.21mi | 2/2.0 | 1,236 (+10%) | 17mo | $195,000 | $158 | 60 |
| 1835 General Cleburne Ave | 0.67mi | 2/1.0 | 1,105 (-2%) | 8mo | $92,000 | $83 | 54 |
| 1733 General Cleburne Ave | 0.60mi | 3/2.0 (+1) | 1,294 (+15%) | 22mo | $1,600 | $1 | 24 |
Match score weights: distance 35% · size 25% · config 20% · recency 20%. Top-matched comps best support the ARV.
Projected returns pro-forma
-3.0% appreciation · 0.68% rent growth · sell at horizon
- IRR
- -23.7%
- Equity multiple
- 0.20×
- Total profit
- $-36,786
- Equity at exit
- $24,587
- IRR
- -26.2%
- Equity multiple
- -0.14×
- Total profit
- $-52,427
- Equity at exit
- $14,258
Cash invested: $46,172 (down + closing). Projections, not guarantees.
Landlord ↔ Tenant lean methodology
- Overall (STATE)
- 90 Strongly Landlord-Friendly
- State Louisiana
- 90 Strongly Landlord-Friendly · R+12
- County
- — inherits STATE
- City
- — inherits STATE
ZIP-level market 70810
- Rents YoY
- 0.7%
- Active inventory
- 625
- Price-to-rent
- 11.1×
Monthly cashflow live
- Estimated rent
- $1,233 high interval (Pro) →
- Mortgage (P&I)
- −$865
- Tax from tax record
- −$154 /mo · $1,852/yr
- Insurance
- −$69
- HOA
- −$0
- Vacancy / Maint / Mgmt
- −$259
- Net cashflow
- $-114
Break-even live
UW: 25.0% down · 7.5% · 30yr · 1.5% tax · 5.0% vac · 8.0% maint · 8.0% mgmt
Financing live
Cash to close
- Down payment
- $41,225
- Closing costs
- $4,947
- Reserves months
- —
- Total cash needed
- —
Loan-product check · same deal, 3 products live
Conventional
25% down · 7.5% · 30yr
- Down + closing
- —
- Monthly P&I
- —
- Monthly cashflow
- —
- DSCR
- —
- Eligible?
- —
Personal DTI + credit; lowest rate.
DSCR
20% down · 8.5% · 30yr
- Down + closing
- —
- Monthly P&I
- —
- Monthly cashflow
- —
- DSCR
- —
- Eligible?
- —
No personal income docs; deal must DSCR.
Hard money
10% down · 12.0% · 12mo
- Down + closing
- —
- Monthly P&I
- —
- Monthly cashflow
- —
- DSCR
- —
- Eligible?
- —
Short-term bridge; refi at stabilization.
Rent comps 40 comps
| Address | Beds | Baths | Sqft | Rent | $/sqft | DOM | Units | Dist |
|---|---|---|---|---|---|---|---|---|
| 9250 Pecan Tree Dr Baton Rouge, LA | 3.0 | 2.0 | 1291 | $1,650 | $1.28 | 23d | 1 | 0.09mi |
| 9149 Ridge Pecan Dr Unit 9149B Gardere, LA | 1.0 | 1.0 | 1000 | $875 | $0.88 | 23d | 1 | 0.12mi |
| 9048 GSRI Ave Unit A Baton Rouge, LA | 2.0 | 2.0 | 875 | $900 | $1.03 | 43d | 1 | 0.27mi |
| 9058 GSRI Ave Unit D Baton Rouge, LA | 3.0 | 2.0 | 875 | $1,100 | $1.26 | 43d | 1 | 0.27mi |
| 8736 Elvin Dr Unit C Baton Rouge, LA | 2.0 | 1.5 | 1140 | $1,100 | $0.96 | 23d | 1 | 0.34mi |
| 8736 Elvin Dr Unit A Baton Rouge, LA | 2.0 | 1.5 | 1140 | $1,100 | $0.96 | 43d | 1 | 0.34mi |
| 1717 Jade Ave Unit 1 Baton Rouge, LA | 2.0 | 1.5 | 1000 | $900 | $0.90 | 23d | 1 | 0.35mi |
| 1717 Jade Ave Unit 2 Gardere, LA | 2.0 | 1.5 | 1000 | $900 | $0.90 | 43d | 1 | 0.35mi |
| 8726 Elvin Dr Unit B Baton Rouge, LA | 2.0 | 1.5 | 1300 | $1,800 | $1.38 | 43d | 1 | 0.35mi |
| 8726 Elvin Dr Unit B Baton Rouge, LA | 2.0 | 1.5 | 1300 | $1,800 | $1.38 | 23d | 1 | 0.35mi |
| 8911 GSRI Ave Baton Rouge, LA | 2.0 | 2.0 | 1100 | $1,150 | $1.05 | 43d | 1 | 0.37mi |
| 2029 Jasper Ave Unit 2029-D Baton Rouge, LA | 3.0 | 2.0 | 1350 | $1,200 | $0.89 | 44d | 1 | 0.37mi |
| 2029 Jasper Ave Unit 2029-B Baton Rouge, LA | 3.0 | 2.0 | 1350 | $1,250 | $0.93 | 23d | 1 | 0.37mi |
| 809 Summer Breeze Dr #1108 Baton Rouge, LA | 3.0 | 2.0 | 1200 | $1,450 | $1.21 | 23d | 1 | 0.39mi |
| 1646 Jade Ave Unit GM 1646-C Baton Rouge, LA | 2.0 | 1.5 | 1100 | $850 | $0.77 | 43d | 1 | 0.40mi |
| 1646 Jade Ave Unit GM 1646-D Baton Rouge, LA | 2.0 | 1.5 | 1100 | $900 | $0.82 | 14d | 1 | 0.41mi |
| 2038 Jasper Ave Unit GM 2038-C Baton Rouge, LA | 2.0 | 1.5 | 1100 | $900 | $0.82 | 43d | 1 | 0.41mi |
| 1616 Jade Ave Baton Rouge, LA | 2.0 | 1.5 | 1000 | $900 | $0.90 | 23d | 1 | 0.43mi |
| 10231 Bluebonnet Blvd Baton Rouge, LA | 1.0–3.0 | 1.0–2.0 | 988 | $1,801 | $1.82 | 14d | 21 | 0.43mi |
| 8727 Granite Dr Unit 8727-C Baton Rouge, LA | 2.0 | 1.5 | 1100 | $940 | $0.85 | 19d | 1 | 0.43mi |
| 8724 GSRI Ave Unit 8724-B Baton Rouge, LA | 2.0 | 1.0 | 853 | $950 | $1.11 | 14d | 1 | 0.46mi |
| 8723 GSRI Ave Unit 8723-B Baton Rouge, LA | 2.0 | 1.0 | 853 | $950 | $1.11 | 21d | 1 | 0.46mi |
| 1434 Jasper Ave Baton Rouge, LA | 2.0 | 1.5 | 1000 | $800 | $0.80 | 43d | 1 | 0.50mi |
| 10600 Lakes Blvd Baton Rouge, LA | 3.0 | 3.0 | 1464 | $1,850 | $1.26 | 43d | 2 | 0.55mi |
| 10600 Lakes Blvd Baton Rouge, LA | 2.0–3.0 | 2.5–3.0 | 1420 | $1,600 | $1.13 | 14d | 4 | 0.55mi |
| 10600 Lakes Blvd Baton Rouge, LA | 1.0–3.0 | 1.0–3.0 | 1425 | $1,425 | $1.00 | 23d | 4 | 0.55mi |
| 8457 Governor Dr Unit 8457-A Baton Rouge, LA | 2.0 | 1.5 | 1100 | $1,000 | $0.91 | 43d | 1 | 0.68mi |
| 8220 Governor Dr Baton Rouge, LA | 3.0 | 2.0 | 1350 | $1,350 | $1.00 | 19d | 1 | 0.69mi |
| 8216 Governor Dr Baton Rouge, LA | 3.0 | 2.0 | 1212 | $1,350 | $1.11 | 23d | 1 | 0.70mi |
| 8336 Bayou Fountain Ave Unit 8336-D Baton Rouge, LA | 2.0 | 1.5 | 1110 | $1,045 | $0.94 | 14d | 1 | 0.71mi |
| 8445 Governor Dr Unit 8445-D Baton Rouge, LA | 2.0 | 2.0 | 974 | $945 | $0.97 | 43d | 1 | 0.71mi |
| 8262 Governor Dr Unit 8262-A Baton Rouge, LA | 3.0 | 3.0 | 1400 | $1,400 | $1.00 | 14d | 1 | 0.71mi |
| 8231 Bayou Fountain Ave Unit 8231-1 Baton Rouge, LA | 2.0 | 2.0 | 1250 | $1,200 | $0.96 | 14d | 1 | 0.78mi |
| 1934 Elvin Dr Baton Rouge, LA | 3.0 | 2.0 | 1112 | $1,600 | $1.44 | 43d | 1 | 0.78mi |
| 8150 Bayou Fountain Ave Unit 8150-C Baton Rouge, LA | 2.0 | 1.5 | 992 | $1,050 | $1.06 | 14d | 1 | 0.79mi |
| 8185 Bayou Fountain Ave Unit 8185-2 Baton Rouge, LA | 2.0 | 1.5 | 1200 | $1,045 | $0.87 | 23d | 1 | 0.80mi |
| 8425 Ned Ave Unit D Baton Rouge, LA | 2.0 | 2.0 | 970 | $875 | $0.90 | 43d | 1 | 0.88mi |
| 8091 Bayou Fountain Ave Baton Rouge, LA | 2.0 | 2.5 | 1100 | $1,195 | $1.09 | 43d | 1 | 0.92mi |
| 2182 Gardere Ln Unit B Baton Rouge, LA | 2.0 | 2.0 | 1000 | $800 | $0.80 | 23d | 1 | 0.94mi |
| 1773 Starboard Dr Unit 1773-1 Baton Rouge, LA | 2.0 | 1.5 | 1100 | $995 | $0.90 | 19d | 1 | 0.97mi |
Listing history 39 events
-
2026-06-18days on market $164,900 Active 246 DOM
-
2026-06-17days on market $164,900 Active 245 DOM
-
2026-06-16days on market $164,900 Active 244 DOM
-
2026-06-15days on market $164,900 Active 243 DOM
-
2026-06-14days on market $164,900 Active 241 DOM
-
2026-06-10days on market $164,900 Active 238 DOM
-
2026-06-09days on market $164,900 Active 237 DOM
-
2026-06-08days on market $164,900 Active 236 DOM
-
2026-06-07days on market $164,900 Active 235 DOM
-
2026-06-05days on market $164,900 Active 232 DOM
-
2026-06-03days on market $164,900 Active 231 DOM
-
2026-06-02days on market $164,900 Active 230 DOM
-
2026-06-01days on market $164,900 Active 229 DOM
-
2026-05-31days on market $164,900 Active 228 DOM
-
2026-05-31days on market $164,900 Active 227 DOM
-
2025-10-15$164,900 Active 650-char remark
Show marketing remark (663 chars)
Charming Corner Lot Home in a Quiet Neighborhood! Don’t miss this adorable, well-maintained home situated on a desirable corner lot in a peaceful neighborhood! Featuring updated flooring in both bedrooms and hallway, plus a new A/C system installed in 2021. The living room boasts a beautiful cathedral ceiling, creating an open and airy feel. The primary bedroom includes a private ensuite, and the fully fenced backyard offers great space for pets, play, or entertaining. You'll also enjoy a 2-car covered carport and extra storage. Prime location just minutes from LSU, shopping, and dining! Located in Flood Zone X — no flood insurance required!
-
2025-10-15$164,900 Active 663-char remark
Show marketing remark (663 chars)
Charming Corner Lot Home in a Quiet Neighborhood! Don’t miss this adorable, well-maintained home situated on a desirable corner lot in a peaceful neighborhood! Featuring updated flooring in both bedrooms and hallway, plus a new A/C system installed in 2021. The living room boasts a beautiful cathedral ceiling, creating an open and airy feel. The primary bedroom includes a private ensuite, and the fully fenced backyard offers great space for pets, play, or entertaining. You'll also enjoy a 2-car covered carport and extra storage. Prime location just minutes from LSU, shopping, and dining! Located in Flood Zone X — no flood insurance required!
-
2025-03-20historical $1,000
-
2025-03-17$1,000
-
2023-01-03soldstatus $154,000
-
2022-12-30soldstatus Sold
-
2022-12-05status Pending
-
2022-11-14$155,000 Active
-
2022-11-14$155,000
-
2018-05-23soldstatus $127,000
-
2018-05-21soldstatus Sold
-
2018-05-11status Pending
-
2018-03-24$139,900 Active
-
2018-03-24$139,900
-
2012-06-13$99,900
-
2012-06-13$99,900
-
2003-04-29soldstatus
-
2003-03-07$74,900
-
2003-03-07$74,900
-
2002-11-12$74,900
-
2002-11-12$74,900
-
2002-08-02$78,700
-
2002-08-02$78,700
-
2000-06-05soldstatus
ⓘ Source: listings_history table (triggers on properties + properties_extension) + one-shot
backfill from property_details.listing_events for pre-trigger history.
Tax reassessment forecast LA · Resets to sale price
- Current annual tax
- $1,852 · $154/mo
- Projected year-2 tax
- $1,852 · $154/mo
- Expected delta
- $0/yr ($0/mo · 0.0%)
ⓘ Screening estimate from a state-policy table — verify with the county assessor before closing.
Climate risk First Street
- Flood 6/10 Major FEMA zone X · 72% chance over 30 yrs
- Wildfire 1/10 Low
- Heat 8/10 Severe 7 d/yr ≥108°F today · 21 d/yr by 30 yrs out
- Wind 9/10 Extreme 99% chance of damaging wind over 30 yrs
- Air quality 3/10 Moderate 3 unhealthy d/yr today · 3 by 30 yrs out
Nearby sold comps map
Loading sold comps map…
Walkable amenities ~0.75 mi
Loading nearby amenities…
Taxation est. · year 1
- Rental income
- $14,798
- − Mortgage interest
- −$9,237
- − Property taxes
- −$1,852
- − Insurance
- −$824
- − Repairs & maintenance
- −$1,184
- − Management
- −$1,184
- − Depreciation
- −$4,797
- Taxable loss
- −$4,281
- Est. tax savings @ 24.0%
- +$1,027
- After-tax cash flow
- $-336/yr
For passive investors: Depreciation is non-cash, so a rental often shows a tax loss while cash-flowing — sheltering income. Rental losses are passive: they offset passive income freely, and up to $25,000/yr can offset ordinary (W-2) income if you actively participate and your MAGI is under $100k (phasing out to $0 by $150k); unused losses carry forward. On sale, claimed depreciation is recaptured at up to 25%, and gains may owe capital-gains tax (a 1031 exchange can defer both). Figures are a year-1 estimate at your 24.0% rate — not tax advice; consult a CPA.
Schools (NCES district)
- District
- East Baton Rouge Parish
- NCES district ID
- 2200540
- Math proficiency
- 22% ▼ -36.00%
- Reading proficiency
- 34% ▼ -31.00%
- Median HH income
- $46,263
- Composite
- 24.14/100
- National rank
- #7745
- State rank
- #47 of 98 in LA
Livability — Gardere
- Score
- 64/100
- State rank
- #167
- US rank
- #14008
Category grades
Schools grade is shown separately in the Schools card above.
Census & demographics
- Census place
- Gardere, LA
- County
- East Baton Rouge Parish · 399,686 people
- Metro
- Baton Rouge, LA
- Population (ZIP)
- 42,659
- Household income
- $92,098
- Rent vs Own
- Severe rent burden
- 1106.0
Population outlook (East Baton Rouge County) Hauer SSP2
- Today (2025)
- 464,810 people
- By 2030
- 472,137 · +1.6%
- By 2040
- 480,243 · +3.3%
- By 2050
- 484,422 · +4.2%
- By 2075
- 492,069 · +5.9%
- By 2100
- 476,347 · +2.5%
Race, ethnicity, and origin ACS 2023
- Neighborhood character
- Diverse neighborhood (Simpson 0.60)
- Race & ethnicity
- White 55% Black 29% Hispanic / Latino 7% Two or more races 6% Asian 6%
- Hispanic origin (detail)
- Mexican 1%
- Common ancestry
- Lithuanian 11% Slovak 2% Scottish 1%
- Foreign-born
- 9% · Canada, China, South Korea
- Languages at home
- 89% English-only · Spanish 4% Other Indo-European 2% Chinese 1%
Political lean MEDSL · East Baton Rouge
- 2024 margin
- D (+11.1) · D 54.5% · R 43.4% · Other 2.1%
- 2008→2024 swing
- +8.9pp toward D · 2008: 2.2pp · 2024: 11.1pp
- All cycles
- 2024: D+11.1 2020: D+13.1 2016: D+9.2 2012: D+5.2 2008: D+2.2
Not yet ingested
- Civics
- —
Market trends
- HPI YoY
- ▼ -117.55%
- Current HPI
- 172.7593
- Rent YoY
- ▲ 0.68%
- Metro
- Baton Rouge, LA
- State GDP YoY
- ▲ 3.29%
- F500 in state
- 10
Industry mix (Fortune 500 HQ in LA)
| Industry | F500 HQs | Revenue |
|---|---|---|
| Telecommunications | 2 | $23B |
|
||
| Utilities | 1 | $12B |
|
||
| Wholesale / Distribution | 1 | $5B |
|
||
| Advertising | 1 | $2B |
|
||
Price history
+109.5% since first listed24 events — show timeline
- 2025-10-15 Listed $164,900 GBRMLS
- 2025-10-15 Listed $164,900 AcadianaMLS
- 2025-03-20 Rental Removed $1,000 APPFOLIO
- 2025-03-17 Listed for Rent $1,000 APPFOLIO
- 2023-01-03 Sold (Public Records) $154,000 Public Records
- 2022-12-30 Sold (MLS) — GBRMLS
- 2022-12-05 Pending — GBRMLS
- 2022-11-14 Listed $155,000 AcadianaMLS
- 2022-11-14 Listed $155,000 GBRMLS
- 2018-05-23 Sold (Public Records) $127,000 Public Records
- 2018-05-21 Sold (MLS) — GBRMLS
- 2018-05-11 Pending — GBRMLS
- 2018-03-24 Listed $139,900 AcadianaMLS
- 2018-03-24 Listed $139,900 GBRMLS
- 2012-06-13 Listed $99,900 AcadianaMLS
- 2012-06-13 Listed $99,900 GBRMLS
- 2003-04-29 Sold (MLS) — GBRMLS
- 2003-03-07 Listed $74,900 GBRMLS
- 2003-03-07 Listed $74,900 AcadianaMLS
- 2002-11-12 Listed $74,900 AcadianaMLS
- 2002-11-12 Listed $74,900 GBRMLS
- 2002-08-02 Listed $78,700 AcadianaMLS
- 2002-08-02 Listed $78,700 GBRMLS
- 2000-06-05 Sold (Public Records) — Public Records
Property tax history
+14.5%/yrLatest (2025): $1,852 · -0.4% YoY. Source: county tax records.
Cash-flow waterfall
monthlySold comps — $/sqft
last 12 mo · ≤1 miLoading sold comps…