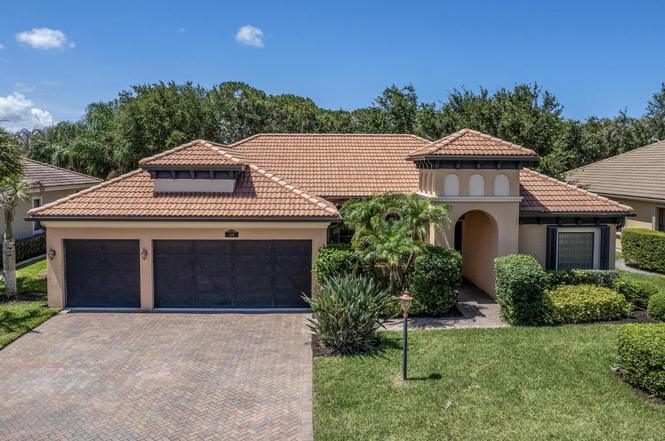
2295 NW Diamond Creek Way · Port St. Lucie, FL
Flood risk 4/10 · Minor
- FEMA flood zone
- X (unshaded)
- Chance of flooding over 30 yrs
- 0.13%
- Est. flood insurance / yr
- $507 – $1,088
Fire risk 2/10 · Minimal
- Est. fire insurance / yr
- $947 – $1,759
Heat risk 10/10 · Severe
- Hot days now (above 106°F)
- 7 days/yr
- Hot days in 30 yrs
- 25 days/yr
Wind risk 10/10 · Severe
- Chance of severe wind over 30 yrs
- 99.0%
Air-quality risk 2/10 · Minimal
- Unhealthy air days now
- 1 days/yr
- Unhealthy air days in 30 yrs
- 1 days/yr
Risk factors via First Street. Map © Google.
Why this score? — see what drove the D- grade
The composite is a weighted blend of 9 inputs, each scored 0–100. Each bar is that input's sub-score; the figure is the points it added to the 100-point composite (weight × sub-score).
- Cash flow +12.8/30.0
- ARV discount +7.0/15.0
- Schools +4.5/10.0
- DSCR +3.8/10.0
- 1% rule +3.2/10.0
- Rent growth +2.8/5.0
- Livability +2.5/5.0
- Condition / age +2.5/5.0
- Appreciation +0.0/10.0
$699,000
🖨 Deal sheet 📄 Offer letter ✓ Due diligence
Listing remarks
This meticulously maintained 4-bed 3-bath residence features a 3-car garage in the exclusive gated community of The Falls, featuring 10' ceilings throughout, 8' doors, and an expansive outdoor covered patio. and beautifully upgraded finishes. Some of the recent updates include a freshly painted interior, new cabinets throughout, and new carpeting. The open kitchen concept is perfect for entertaining with expansive granite counter space. All desired amenities are minutes away from The Falls. Major shopping options and restaurants, professional services, and major hospitals.
Key facts
- Gated community
- Recent updates
- Open kitchen concept
Tags
Property features AI
Finance
- Other: Pets allowed (pet restrictions possible)
- HOA & community: Monthly HOA: $335; HOA covers common areas; Association provides gated community amenities
Exterior
- Parking: Attached 3-car garage; Paver block drive/parking; 3 covered parking spaces
- Security: Gated community (no guard)
- Utilities: Public water; Public sewer; Cable available; Sewer connected; Water connected
- Home design: Single family residence; One story; Facing south; Resale condition
- Construction: CBS construction; Barrel/concrete roof; Built as a single-story home
- Exterior features: Open patio; Patio
Interior
- Kitchen: Disposal; Dishwasher; Electric range; Microwave; Refrigerator; Electric water heater
- Bedrooms: 3 bedrooms on the main level
- Flooring: Carpet; Tile
- Bathrooms: 3 full bathrooms
- Heating & cooling: Central heating; Central air conditioning
- Interior features: High ceilings; Split bedroom layout; Roman tub
- Laundry & utility: Laundry room
Neighborhood map
What this means for you Summary
Snapshot
- This is a 4-bed/3.0-bath single-family listed at $699k.
Deal economics
- At list price, monthly cash flow is $-63 ($-755/yr) — negative.
- To cash-flow at today's rent, offer at most $688k (1.6% below list).
- To meet the 1% rule (rent ≥ 1% of price), the offer needs to be $576k (17.7% below list).
- Recommended offer: $576k (17.7% below list) — sets the bar for 1% rule.
- Cap rate 6.2% vs local median 3.9% in Port St. Lucie — top-decile yield for the area; either an underpriced asset or a hidden risk that comps aren't pricing in. Stress-test before assuming the spread holds.
Location & tenants
- Location reads: area grade D — affects rentability + tenant quality, not the cash-flow math above.
- Martin (suburban): math 52% / reading 53% proficiency, ranked #24 of 73 in FL (top 33%) — acceptable for families but not a draw, mixed tenant base, ~2y average lease.
- Zoned schools: Jensen Beach Elementary School (math 67% / reading 67%, grade B+, #450 of 2,144 statewide, top 22%, 558 students, 45% FRL); Stuart Middle School (math 55% / reading 55%, grade B-, #180 of 571 statewide, top 32%, 867 students, 49% FRL); Jensen Beach High School (math 53% / reading 71%, grade B-, #98 of 667 statewide, top 15%, 1,584 students, 36% FRL) — zoned schools at 43% FRL track the district average.
- Market conditions: Rents rising (+1.0%/yr); 536 active listings in the ZIP; 7 comparable units currently listed for rent nearby; rentals at typical pace (median 23d on market — plan ~3-4 weeks tenant-placement turnaround); 737 units permitted in Martin County in 2024 (167 in 5+ unit buildings).
- At $5,755/mo this rent would consume 98% of the median local household income ($70k/yr) (locally 946% of renters already pay >50% of income on rent) — very limited rent-growth headroom before tenants either downsize or default.
Forward outlook
- Local home prices are declining (-3.0%/yr); year-one equity from $5k of loan paydown is wiped out by about $21k of value loss. Plan a longer hold.
- Martin County population projected at +19% by 2050 — long-run rental-demand tailwind backs the buy-and-hold thesis.
Negotiation context
- Only 3 days on market — expect competitive offers; lowballing is unlikely to land.
- 4 sale attempts since 19y ago with the ask held roughly flat each time — persistent listings suggest the price (not the market) is what's stuck; bring a comps-based counter.
Risks & watch-outs
- Climate carrying-cost: severe wind risk, 99% chance of damaging wind over 30y; extreme-heat days projected 7→25/yr by 2055 (HVAC capex compounding) — expect insurance premiums to compound above CPI over the hold.
Questions for the listing agent
- What do current leases actually rent for vs. the listed asking? Can we see a recent rent roll and the last 12 months of T-12 income?
- What does the HOA fee cover, when was the last increase, and are there any pending special assessments or reserve-fund shortfalls?
- Is there a deadline driving the sale (1031 exchange, divorce, estate, relocation)? That informs how much negotiation room exists.
- The area grade is low — what's the realistic commute time and amenity access for the typical tenant pool here? Any planned neighborhood developments (good or bad) we should know about?
- What's the average days-on-market for RENTAL listings here right now (not sales)? A rising rental-DOM trend means longer vacancies and softer asking-rent achievability than the comps imply.
- What's the recent tenant-quality profile in this submarket — average credit score on applications, eviction rate, late-payment / NSF rate, and stable-employment percentage? A property-management company in the area should have these aggregated.
- How much new for-sale + rental construction is in the pipeline within 1–3 miles? Heavy new supply typically softens prices + rents 12–24 months out; constrained supply supports both.
Investment metrics
- 1% rule
- 0.82% ✗
- Cap rate
- 6.18%
- Cash-on-cash
- -0.39%
- DSCR
- 0.98
- GRM
- 10.1
CMA / ARV
- ARV (on-the-fly)
- $691,410
- Comps found
- 12
Show comp detail 12 sales within ~0.75 mi
| Address | Dist | Beds/Ba | Sqft | Sold | Price | $/sf | Match |
|---|---|---|---|---|---|---|---|
| 2214 SE Montrose Ln | 0.26mi | 4/3.0 | 2,413 (-0%) | 13mo | $650,000 | $269 | 77 |
| 2727 NW Florida Ave | 0.28mi | 4/3.0 | 2,198 (-9%) | 3mo | $619,000 | $282 | 69 |
| 2028 SE Oxton Dr | 0.54mi | 4/3.0 | 2,477 (+2%) | 4mo | $799,000 | $323 | 68 |
| 1810 SE Killean Ct | 0.55mi | 4/3.0 | 2,406 (-1%) | 12mo | $679,000 | $282 | 63 |
| 1826 SE Killean Ct | 0.46mi | 3/3.0 (-1) | 2,200 (-9%) | 4mo | $650,000 | $295 | 55 |
| 2925 NW Florida Ct | 0.34mi | 3/3.0 (-1) | 2,188 (-10%) | 11mo | $575,000 | $263 | 54 |
| 2645 NW South Shore Rd | 0.64mi | 3/2.0 (-1) | 2,441 (+1%) | 9mo | $1,300,000 | $533 | 53 |
| 2218 SE Stonehaven Rd | 0.42mi | 3/3.0 (-1) | 2,196 (-10%) | 19mo | $760,000 | $346 | 44 |
| 2102 SE Bryson Ave | 0.51mi | 3/3.0 (-1) | 2,118 (-13%) | 12mo | $595,000 | $281 | 40 |
| 2489 NW Everglades Blvd | 0.47mi | 3/2.0 (-1) | 2,063 (-15%) | 14mo | $662,000 | $321 | 32 |
| 2872 SE Bakersfield St | 0.65mi | 3/2.5 (-1) | 2,631 (+8%) | 20mo | $545,000 | $207 | 32 |
| 2556 NW Captiva Cv | 0.72mi | 4/2.5 | 2,067 (-15%) | 12mo | $590,000 | $285 | 30 |
Match score weights: distance 35% · size 25% · config 20% · recency 20%. Top-matched comps best support the ARV.
Projected returns pro-forma
-3.0% appreciation · 1.0% rent growth · sell at horizon
- IRR
- -19.1%
- Equity multiple
- 0.34×
- Total profit
- $-128,682
- Equity at exit
- $104,223
- IRR
- -16.2%
- Equity multiple
- 0.17×
- Total profit
- $-162,179
- Equity at exit
- $60,437
Cash invested: $195,720 (down + closing). Projections, not guarantees.
Landlord ↔ Tenant lean methodology
- Overall (STATE)
- 87 Strongly Landlord-Friendly
- State Florida
- 87 Strongly Landlord-Friendly · R+3
- County
- — inherits STATE
- City
- — inherits STATE
ZIP-level market 34957
- Rents YoY
- 1.0%
- Active inventory
- 536
- Price-to-rent
- 10.1×
Monthly cashflow live
- Estimated rent
- $5,755 high interval (Pro) →
- Mortgage (P&I)
- −$3,666
- Tax from tax record
- −$318 /mo · $3,813/yr
- Insurance
- −$291
- HOA
- −$335
- Vacancy / Maint / Mgmt
- −$1,209
- Net cashflow
- $-63
Break-even live
UW: 25.0% down · 7.5% · 30yr · 1.5% tax · 5.0% vac · 8.0% maint · 8.0% mgmt
Financing live
Cash to close
- Down payment
- $174,750
- Closing costs
- $20,970
- Reserves months
- —
- Total cash needed
- —
Loan-product check · same deal, 3 products live
Conventional
25% down · 7.5% · 30yr
- Down + closing
- —
- Monthly P&I
- —
- Monthly cashflow
- —
- DSCR
- —
- Eligible?
- —
Personal DTI + credit; lowest rate.
DSCR
20% down · 8.5% · 30yr
- Down + closing
- —
- Monthly P&I
- —
- Monthly cashflow
- —
- DSCR
- —
- Eligible?
- —
No personal income docs; deal must DSCR.
Hard money
10% down · 12.0% · 12mo
- Down + closing
- —
- Monthly P&I
- —
- Monthly cashflow
- —
- DSCR
- —
- Eligible?
- —
Short-term bridge; refi at stabilization.
Rent comps 7 comps
| Address | Beds | Baths | Sqft | Rent | $/sqft | DOM | Units | Dist |
|---|---|---|---|---|---|---|---|---|
| 2744 NW Howard Creek Ln Stuart, FL | 3.0 | 2.5 | 2744 | $9,000 | $3.28 | 23d | 1 | 0.66mi |
| 3542 NW Solange Ct Jensen Beach, FL | 3.0 | 2.5 | 2042 | $3,400 | $1.67 | 21d | 1 | 0.77mi |
| 2937 SE Cates Cir Port Saint Lucie, FL | 3.0 | 2.0 | 2014 | $6,000 | $2.98 | 23d | 1 | 0.79mi |
| 4530 NW Exchange Ave Jensen Beach, FL | 3.0 | 2.0 | 1636 | $3,500 | $2.14 | 13d | 1 | 1.02mi |
| 1967 NW Palmetto Ter Stuart, FL | 3.0 | 2.0 | 2179 | $8,500 | $3.90 | 23d | 1 | 1.25mi |
| 2625 SE Emmett Rd Port Saint Lucie, FL | 4.0 | 2.5 | 2250 | $1,400 | $0.62 | 23d | 1 | 1.26mi |
| 1947 NW Palmetto Ter Stuart, FL | 4.0 | 3.0 | 2768 | $8,500 | $3.07 | 23d | 1 | 1.27mi |
HOA detail
- Monthly dues
- $335 · $4,020/yr
- Likely covers
- security
Listing history 4 events
-
2026-06-18days on market $699,000 Active 3 DOM
-
2026-06-17days on market $699,000 Active 2 DOM
-
2026-06-15remarks 579-char remark
-
2026-06-15$699,000 Active 1 DOM
ⓘ Source: listings_history table (triggers on properties + properties_extension) + one-shot
backfill from property_details.listing_events for pre-trigger history.
Tax reassessment forecast FL · Resets to sale price
- Current annual tax
- $3,813 · $318/mo
- Projected year-2 tax
- $5,802 · $483/mo
- Expected delta
- +$1,989/yr (+$166/mo · 52.2%)
ⓘ Screening estimate from a state-policy table — verify with the county assessor before closing.
Climate risk First Street
- Flood 4/10 Moderate FEMA zone X (unshaded) · 13% chance over 30 yrs
- Wildfire 2/10 Low
- Heat 10/10 Extreme 7 d/yr ≥106°F today · 25 d/yr by 30 yrs out
- Wind 10/10 Extreme 99% chance of damaging wind over 30 yrs
- Air quality 2/10 Low 1 unhealthy d/yr today · 1 by 30 yrs out
Nearby sold comps map
Loading sold comps map…
Walkable amenities ~0.75 mi
Loading nearby amenities…
Taxation est. · year 1
- Rental income
- $69,063
- − Mortgage interest
- −$39,155
- − Property taxes
- −$3,813
- − Insurance
- −$3,495
- − Repairs & maintenance
- −$5,525
- − Management
- −$5,525
- − HOA
- −$4,020
- − Depreciation
- −$20,335
- Taxable loss
- −$12,804
- Est. tax savings @ 24.0%
- +$3,073
- After-tax cash flow
- $2,318/yr
For passive investors: Depreciation is non-cash, so a rental often shows a tax loss while cash-flowing — sheltering income. Rental losses are passive: they offset passive income freely, and up to $25,000/yr can offset ordinary (W-2) income if you actively participate and your MAGI is under $100k (phasing out to $0 by $150k); unused losses carry forward. On sale, claimed depreciation is recaptured at up to 25%, and gains may owe capital-gains tax (a 1031 exchange can defer both). Figures are a year-1 estimate at your 24.0% rate — not tax advice; consult a CPA.
Schools (NCES district)
- District
- Martin
- NCES district ID
- 1201290
- Math proficiency
- 52% ▼ -14.00%
- Reading proficiency
- 53% ▼ -4.00%
- Median HH income
- $52,482
- Composite
- 45.1/100
- National rank
- #2690
- State rank
- #24 of 73 in FL
Livability — Port St. Lucie
No livability data for this city. (Only ~50 U.S. cities are tracked.)
Census & demographics
- County
- Martin County · 165,223 people
- City population
- 221,051
- Metro
- Port St. Lucie, FL
- Population (ZIP)
- 23,462
- Household income
- $70,403
- Rent vs Own
- Severe rent burden
- 946.0
Population outlook (Martin County) Hauer SSP2
- Today (2025)
- 172,383 people
- By 2030
- 180,192 · +4.5%
- By 2040
- 194,114 · +12.6%
- By 2050
- 204,992 · +18.9%
- By 2075
- 229,641 · +33.2%
- By 2100
- 232,146 · +34.7%
Race, ethnicity, and origin ACS 2023
- Neighborhood character
- Predominantly White (85%)
- Race & ethnicity
- White 85% Hispanic / Latino 7% Two or more races 6% Asian 2% Black 2%
- Hispanic origin (detail)
- Mexican 1% Puerto Rican 2% Cuban 1%
- Common ancestry
- Romanian 4% Slovak 3% Lithuanian 3%
- Foreign-born
- 10% · Canada, Jamaica
- Languages at home
- 90% English-only · Spanish 5% Other Indo-European 2% Tagalog/Filipino 1%
Political lean MEDSL · Martin
- 2024 margin
- Solid R (+31.1) · D 34.1% · R 65.2%
- 2008→2024 swing
- -17.5pp toward R · 2008: -13.6pp · 2024: -31.1pp
- All cycles
- 2024: R+31.1 2020: R+24.6 2016: R+26.9 2012: R+22.9 2008: R+13.6
Not yet ingested
- Civics
- —
Market trends
- HPI YoY
- ▼ -319.66%
- Current HPI
- 340.0172
- Rent YoY
- ▲ 1.00%
- Metro
- Port St. Lucie, FL
- State GDP YoY
- ▲ 3.28%
- F500 in state
- 36
Industry mix (Fortune 500 HQ in FL)
| Industry | F500 HQs | Revenue |
|---|---|---|
| Industrial Technology | 2 | $29B |
|
||
| Insurance | 2 | $17B |
|
||
| Retail | 1 | $60B |
|
||
| Technology Distribution | 1 | $58B |
|
||
| Homebuilding | 1 | $35B |
|
||
| Technology Manufacturing | 1 | $35B |
|
||
Price history
-96.5% since first listed9 events — show timeline
- 2026-06-12 Listed $699,000 Beaches MLS
- 2013-12-02 Listing Removed — Beaches MLS
- 2013-12-02 Listing Removed — Beaches MLS
- 2013-09-21 Listing Removed — Beaches MLS
- 2007-07-21 Listed $419,990 Beaches MLS
- 2007-06-05 Listed $539,900 Beaches MLS
- 2007-03-28 Listed $539,900 Beaches MLS
- 2006-05-02 Sold (Public Records) $1,069,300 Public Records
- 2006-04-11 Sold (Public Records) $19,857,300 Public Records
Property tax history
+2.0%/yrLatest (2025): $3,813 · -0.5% YoY. Source: county tax records.
Cash-flow waterfall
monthlySold comps — $/sqft
last 12 mo · ≤1 miLoading sold comps…