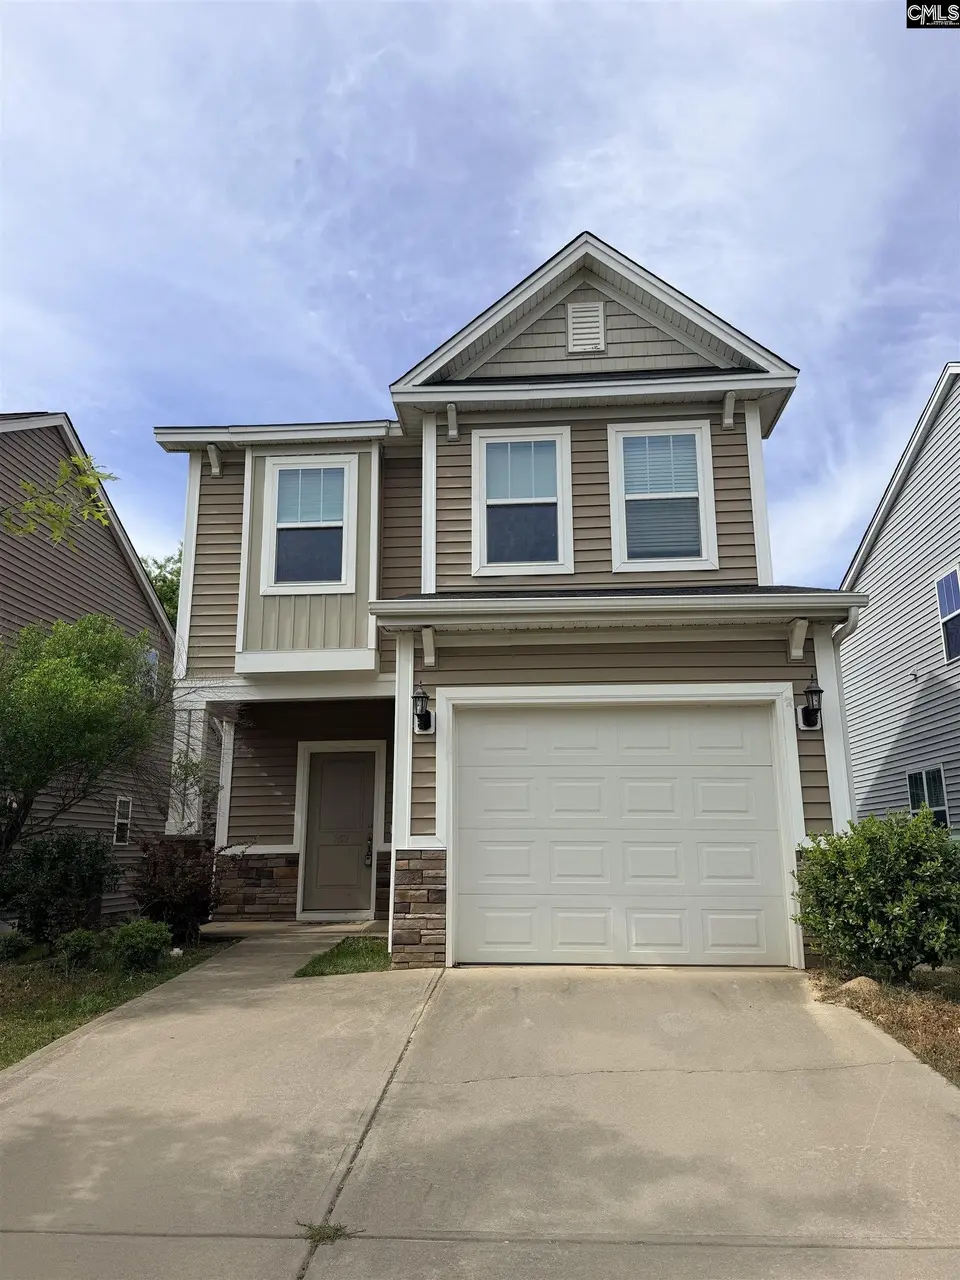
769 Helmsman Ln · Lake Murray of Richland, SC
Flood risk 1/10 · Minimal
- FEMA flood zone
- X (unshaded)
- Chance of flooding over 30 yrs
- 0.0%
- Est. flood insurance / yr
- $507 – $1,088
Fire risk 4/10 · Minor
- Est. fire insurance / yr
- $783 – $1,453
Heat risk 7/10 · Major
- Hot days now (above 108°F)
- 7 days/yr
- Hot days in 30 yrs
- 17 days/yr
Wind risk 6/10 · Moderate
- Chance of severe wind over 30 yrs
- 54.0%
Air-quality risk 3/10 · Minor
- Unhealthy air days now
- 2 days/yr
- Unhealthy air days in 30 yrs
- 3 days/yr
Risk factors via First Street. Map © Google.
Why this score? — see what drove the D+ grade
The composite is a weighted blend of 9 inputs, each scored 0–100. Each bar is that input's sub-score; the figure is the points it added to the 100-point composite (weight × sub-score).
- Cash flow +16.6/30.0
- ARV discount +7.5/15.0
- 1% rule +5.4/10.0
- DSCR +5.2/10.0
- Schools +4.5/10.0
- Livability +3.4/5.0
- Rent growth +2.5/5.0
- Condition / age +2.5/5.0
- Appreciation +0.0/10.0
$245,000
🖨 Deal sheet 📄 Offer letter ✓ Due diligence
Listing remarks
Welcome home to this beautifully maintained, move-in ready property featuring a bright and open-concept layout perfect for modern living. The spacious living area flows seamlessly into the kitchen, offering a functional layout with ample cabinetry, stainless steel appliances, and a convenient bar-top for additional seating—ideal for entertaining or everyday use. The primary suite provides a relaxing retreat with generous space and natural light, while additional bedrooms are well-sized and versatile—perfect for guests, a home office, or growing needs. Each room has been thoughtfully refreshed and is filled with light, creating a warm and inviting feel throughout. The bathrooms a
Key facts
- 3,484 sq ft lot
- Garage
- Built 2016
Property features AI
Finance
- HOA & community: Homeowners association present
Exterior
- Parking: Attached garage with 1 garage space
- Utilities: Public water; Public sewer
- Home design: Two-story home; Slab foundation
- Construction: Vinyl exterior; Slab foundation
- Exterior features: Vinyl exterior; Paved road access; Approximately 0.08 acre lot
Interior
- Kitchen: Free-standing range; Luxury vinyl plank flooring
- Bedrooms: Master suite with double vanity, garden tub, private bath, and walk-in closet (master on second level); Second bedroom on second level with shared bath; Third bedroom on second level with shared bath
- Flooring: Luxury vinyl plank
- Bathrooms: Two full bathrooms; One half bathroom; Two secondary full bathrooms
- Heating & cooling: Central heating; Central air conditioning
- Interior features: Free-standing range; Luxury vinyl plank flooring in living room and kitchen
- Laundry & utility: Laundry located on second level
Neighborhood map
What this means for you Summary
Snapshot
- This is a 3-bed/3.0-bath single-family listed at $245k.
Deal economics
- At list price, monthly cash flow is $149 ($2k/yr) — positive.
- The deal already cash-flows at list — no discount required.
- Meets the 1% rule at list price ($3k rent vs $245k).
- Recommended offer: $230k (6.0% below list) — sets the bar for market timing.
Location & tenants
- Location reads 67/100 on livability (#102 in SC) — a middle-class / working-renter tenant base. Strengths: crime A+, employment A+, housing A+; Watch: amenities F, commute F, cost of living F.
- Lexington 05 (suburban): math 47% / reading 55% proficiency, ranked #5 of 80 in SC (top 6%) — acceptable for families but not a draw, mixed tenant base, ~2y average lease.
- Zoned schools: Lake Murray Elementary (math 78% / reading 82%, grade A+, #4 of 597 statewide, top 1%, 809 students, 18% FRL); Chapin High (math 82% / reading 91%, grade A, #7 of 196 statewide, top 4%, 1,615 students, 100% FRL) — zoned schools average 59% FRL vs 27% district-wide (32 pts higher); higher-poverty schools than district average — tighter screening recommended.
- Zoned-school proficiency averages 83% at this address vs 51% district-wide (+32 pts) — the actual schools serving this property are materially stronger than the Lexington 05 average implies; a family-tenant draw the district grade alone would hide.
- Market conditions: 434 active listings in the ZIP; 3 comparable units currently listed for rent nearby; rentals leasing fast (median 3d on market — plan ~1-2 weeks tenant-placement turnaround); high-income renter base; 3,472 units permitted in Richland County in 2024 (1,096 in 5+ unit buildings).
Forward outlook
- Local home prices are declining (-3.0%/yr); year-one equity from $2k of loan paydown is wiped out by about $7k of value loss. Plan a longer hold.
- Richland County population projected at +30% by 2050 — long-run rental-demand tailwind backs the buy-and-hold thesis.
Negotiation context
- It's been on market 66 days — a 6% lower offer ($230k) is reasonable based on typical stale-listing flexibility.
- 2 sale attempts with the ask held roughly flat each time — persistent listings suggest the price (not the market) is what's stuck; bring a comps-based counter.
Risks & watch-outs
- Climate carrying-cost: major wind risk, 54% chance of damaging wind over 30y; extreme-heat days projected 7→17/yr by 2055 (HVAC capex compounding) — expect insurance premiums to compound above CPI over the hold.
Questions for the listing agent
- It's been on market 66 days. Have you received any prior offers? Is the seller open to a 6% concession, seller financing, or rate buy-down credit?
- What does the HOA fee cover, when was the last increase, and are there any pending special assessments or reserve-fund shortfalls?
- Why hasn't it sold? Are there any deal-killer items the seller is aware of (foundation, flood, title, zoning, code violations)?
- Is there a deadline driving the sale (1031 exchange, divorce, estate, relocation)? That informs how much negotiation room exists.
- Schools are D-rated, which usually means shorter tenancies and higher turnover. Who's the typical renter profile here, and what's been the actual vacancy rate?
- The area grade is low — what's the realistic commute time and amenity access for the typical tenant pool here? Any planned neighborhood developments (good or bad) we should know about?
- What's the average days-on-market for RENTAL listings here right now (not sales)? A rising rental-DOM trend means longer vacancies and softer asking-rent achievability than the comps imply.
- What's the recent tenant-quality profile in this submarket — average credit score on applications, eviction rate, late-payment / NSF rate, and stable-employment percentage? A property-management company in the area should have these aggregated.
- How much new for-sale + rental construction is in the pipeline within 1–3 miles? Heavy new supply typically softens prices + rents 12–24 months out; constrained supply supports both.
Investment metrics
- 1% rule
- 1.04% ✓
- Cap rate
- 7.02%
- Cash-on-cash
- 2.60%
- DSCR
- 1.12
- GRM
- 8.0
CMA / ARV
No comps found within radius.
Projected returns pro-forma
-3.0% appreciation · 3.0% rent growth · sell at horizon
- IRR
- -12.1%
- Equity multiple
- 0.56×
- Total profit
- $-30,081
- Equity at exit
- $36,530
- IRR
- -2.9%
- Equity multiple
- 0.80×
- Total profit
- $-13,415
- Equity at exit
- $21,183
Cash invested: $68,600 (down + closing). Projections, not guarantees.
Landlord ↔ Tenant lean methodology
- Overall (STATE)
- 90 Strongly Landlord-Friendly
- State South Carolina
- 90 Strongly Landlord-Friendly · R+6
- County
- — inherits STATE
- City
- — inherits STATE
ZIP-level market 29036
- Active inventory
- 434
- Price-to-rent
- 8.0×
Monthly cashflow live
- Estimated rent
- $2,544 medium interval (Pro) →
- Mortgage (P&I)
- −$1,285
- Tax from tax record
- −$422 /mo · $5,062/yr
- Insurance
- −$102
- HOA
- −$52
- Vacancy / Maint / Mgmt
- −$534
- Net cashflow
- $149
Break-even live
UW: 25.0% down · 7.5% · 30yr · 1.5% tax · 5.0% vac · 8.0% maint · 8.0% mgmt
Financing live
Cash to close
- Down payment
- $61,250
- Closing costs
- $7,350
- Reserves months
- —
- Total cash needed
- —
Loan-product check · same deal, 3 products live
Conventional
25% down · 7.5% · 30yr
- Down + closing
- —
- Monthly P&I
- —
- Monthly cashflow
- —
- DSCR
- —
- Eligible?
- —
Personal DTI + credit; lowest rate.
DSCR
20% down · 8.5% · 30yr
- Down + closing
- —
- Monthly P&I
- —
- Monthly cashflow
- —
- DSCR
- —
- Eligible?
- —
No personal income docs; deal must DSCR.
Hard money
10% down · 12.0% · 12mo
- Down + closing
- —
- Monthly P&I
- —
- Monthly cashflow
- —
- DSCR
- —
- Eligible?
- —
Short-term bridge; refi at stabilization.
Rent comps 3 comps
| Address | Beds | Baths | Sqft | Rent | $/sqft | DOM | Units | Dist |
|---|---|---|---|---|---|---|---|---|
| 756 Helmsman Ln Chapin, SC | 4.0 | 2.5 | 1948 | $2,450 | $1.26 | 14d | 1 | 0.03mi |
| 339 Explorer Dr Chapin, SC | 4.0 | 2.0 | 1740 | $2,200 | $1.26 | 3d | 1 | 0.38mi |
| 628 Willowood Pkwy Chapin, SC | 4.0 | 2.0 | 2000 | $2,760 | $1.38 | 3d | 1 | 0.70mi |
HOA detail
- Monthly dues
- $52 · $624/yr
Listing history 17 events
-
2026-06-18days on market $245,000 Active 66 DOM
-
2026-06-17days on market $245,000 Active 65 DOM
-
2026-06-16days on market $245,000 Active 64 DOM
-
2026-06-15days on market $245,000 Active 63 DOM
-
2026-06-14days on market $245,000 Active 61 DOM
-
2026-06-13days on market $245,000 Active 60 DOM
-
2026-06-10days on market $245,000 Active 58 DOM
-
2026-06-09days on market $245,000 Active 57 DOM
-
2026-06-08days on market $245,000 Active 56 DOM
-
2026-06-07days on market $245,000 Active 55 DOM
-
2026-06-03days on market $245,000 Active 51 DOM
-
2026-06-03days on market $245,000 Active 50 DOM
-
2026-06-01days on market $245,000 Active 49 DOM
-
2026-05-31days on market $245,000 Active 48 DOM
-
2026-05-06price $245,000
-
2026-04-13$249,900 Active
-
2025-01-09$259,000 Active
ⓘ Source: listings_history table (triggers on properties + properties_extension) + one-shot
backfill from property_details.listing_events for pre-trigger history.
Tax reassessment forecast SC · Resets to sale price
- Current annual tax
- $5,062 · $422/mo
- Projected year-2 tax
- $5,062 · $422/mo
- Expected delta
- $0/yr ($0/mo · 0.0%)
ⓘ Screening estimate from a state-policy table — verify with the county assessor before closing.
Climate risk First Street
- Flood 1/10 Low FEMA zone X (unshaded) · 0% chance over 30 yrs
- Wildfire 4/10 Moderate
- Heat 7/10 Severe 7 d/yr ≥108°F today · 17 d/yr by 30 yrs out
- Wind 6/10 Major 54% chance of damaging wind over 30 yrs
- Air quality 3/10 Moderate 2 unhealthy d/yr today · 3 by 30 yrs out
Nearby sold comps map
Loading sold comps map…
Walkable amenities ~0.75 mi
Loading nearby amenities…
Taxation est. · year 1
- Rental income
- $30,525
- − Mortgage interest
- −$13,724
- − Property taxes
- −$5,062
- − Insurance
- −$1,225
- − Repairs & maintenance
- −$2,442
- − Management
- −$2,442
- − HOA
- −$624
- − Depreciation
- −$7,127
- Taxable loss
- −$2,121
- Est. tax savings @ 24.0%
- +$509
- After-tax cash flow
- $2,295/yr
For passive investors: Depreciation is non-cash, so a rental often shows a tax loss while cash-flowing — sheltering income. Rental losses are passive: they offset passive income freely, and up to $25,000/yr can offset ordinary (W-2) income if you actively participate and your MAGI is under $100k (phasing out to $0 by $150k); unused losses carry forward. On sale, claimed depreciation is recaptured at up to 25%, and gains may owe capital-gains tax (a 1031 exchange can defer both). Figures are a year-1 estimate at your 24.0% rate — not tax advice; consult a CPA.
Schools (NCES district)
- District
- Lexington 05
- NCES district ID
- 4502820
- Math proficiency
- 47% ▼ -7.00%
- Reading proficiency
- 55% ▼ -4.00%
- Median HH income
- $67,732
- Composite
- 45.28/100
- National rank
- #2656
- State rank
- #5 of 80 in SC
Livability — Lake Murray of Richland
- Score
- 67/100
- State rank
- #102
- US rank
- #10903
Category grades
Schools grade is shown separately in the Schools card above.
Census & demographics
- Census place
- Lake Murray of Richland, SC
- County
- Lexington County · 232,571 people
- City population
- 179
- Metro
- Columbia, SC
- Population (ZIP)
- 26,620
- Household income
- $113,986
- Rent vs Own
- Severe rent burden
- 212.0
Population outlook (Richland County) Hauer SSP2
- Today (2025)
- 459,667 people
- By 2030
- 487,524 · +6.1%
- By 2040
- 542,035 · +17.9%
- By 2050
- 595,371 · +29.5%
- By 2075
- 732,998 · +59.5%
- By 2100
- 820,415 · +78.5%
Race, ethnicity, and origin ACS 2023
- Neighborhood character
- Predominantly White (86%)
- Race & ethnicity
- White 86% Asian 5% Two or more races 4% Black 3% Hispanic / Latino 3%
- Common ancestry
- Lithuanian 4% Slovak 4% Italian 2%
- Foreign-born
- 6% · Canada, South Korea, China
- Languages at home
- 95% English-only · Other Indo-European 2% Spanish 1% Korean 1%
Political lean MEDSL · Richland
- 2024 margin
- Solid D (+34.6) · D 66.4% · R 31.8% · Other 1.8%
- 2008→2024 swing
- +5.7pp toward D · 2008: 28.9pp · 2024: 34.6pp
- All cycles
- 2024: D+34.6 2020: D+38.3 2016: D+32.9 2012: D+33.3 2008: D+28.9
Not yet ingested
- Civics
- —
Market trends
- HPI YoY
- ▼ -134.76%
- Current HPI
- 248.3807
- Rent YoY
- —
- Metro
- Columbia, SC
- State GDP YoY
- ▲ 4.51%
- F500 in state
- 2
Industry mix (Fortune 500 HQ in SC)
| Industry | F500 HQs | Revenue |
|---|---|---|
| Packaging | 1 | $7B |
|
||
Price history
-5.4% since first listed3 events — show timeline
- 2026-05-06 Price Changed $245,000 Consolidated MLS
- 2026-04-13 Listed $249,900 Consolidated MLS
- 2025-01-09 Listed $259,000 Consolidated MLS
Property tax history
+3.5%/yrLatest (2025): $5,062 · +0.7% YoY. Source: county tax records.
Cash-flow waterfall
monthlySold comps — $/sqft
last 12 mo · ≤1 miLoading sold comps…