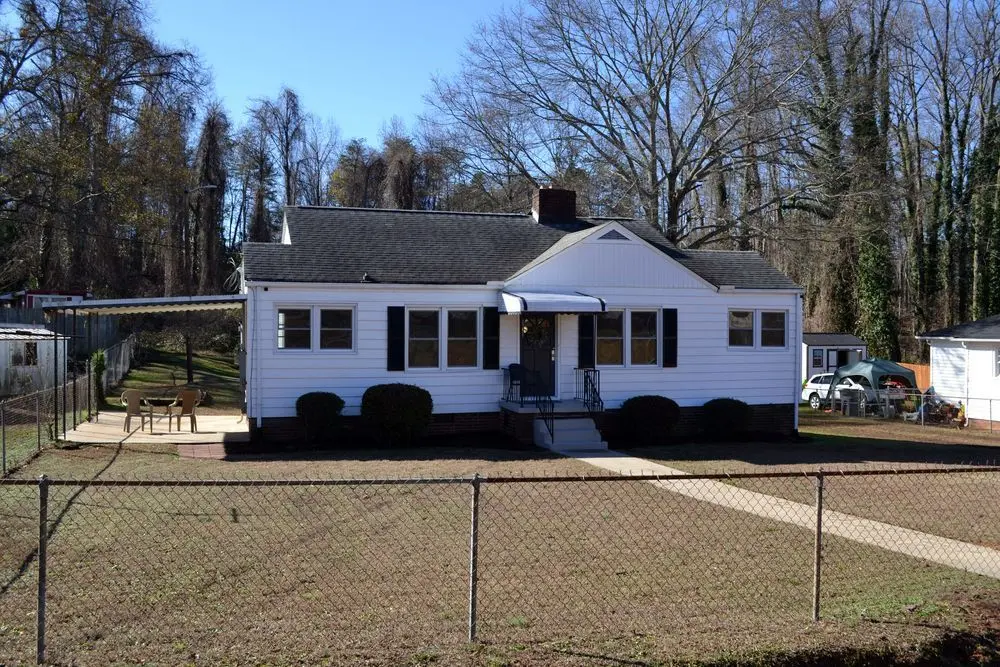
1 Cornell Ct · Parker, SC
Flood risk 6/10 · Moderate
- FEMA flood zone
- X (unshaded)
- Chance of flooding over 30 yrs
- 0.75%
- Est. flood insurance / yr
- $507 – $1,088
Fire risk 3/10 · Minor
- Est. fire insurance / yr
- $783 – $1,453
Heat risk 6/10 · Moderate
- Hot days now (above 102°F)
- 7 days/yr
- Hot days in 30 yrs
- 16 days/yr
Wind risk 2/10 · Minimal
- Chance of severe wind over 30 yrs
- 1.0%
Air-quality risk 4/10 · Minor
- Unhealthy air days now
- 4 days/yr
- Unhealthy air days in 30 yrs
- 4 days/yr
Risk factors via First Street. Map © Google.
Why this score? — see what drove the D grade
The composite is a weighted blend of 9 inputs, each scored 0–100. Each bar is that input's sub-score; the figure is the points it added to the 100-point composite (weight × sub-score).
- Cash flow +14.5/30.0
- ARV discount +6.6/15.0
- DSCR +4.4/10.0
- Schools +4.2/10.0
- 1% rule +3.8/10.0
- Livability +3.7/5.0
- Rent growth +2.9/5.0
- Condition / age +2.5/5.0
- Appreciation +0.0/10.0
$199,000
🖨 Deal sheet (PDF) 📄 Offer letter ✓ Due diligence
Listing remarks
Discover this beautifully refreshed home in one of Greenville's most convenient locations just 1.7 miles from the newly renovated Judson Mill and 3 miles from all that downtown Greenville has to offer. Or go the opposite direction and be in Easley/Powdersville in 5 minutes. This two bedroom/one bath home is ready for its new owners to live, laugh, and love. Paint has been updated throughout the home to a solid neutral color, bathroom totally remodeled, and a laundry room that's big enough for laundry and a freezer or pantry storage. Pre list inspection done and seller has made all home repairs and is currently in process of repairs to the workshop. Property does include a detached 30x30 wor
Key facts
- Detached workshop
- Two-bay carport
- Convenient location
Tags
Property features AI
Exterior
- Home design: House
- Construction: Living area approximately 1,100
- Exterior features: Lot of approximately 10,752 sq ft
Neighborhood map
What this means for you Summary
Snapshot
- This is a 2-bed/1.0-bath single-family listed at $199k.
Deal economics
- At list price, monthly cash flow is $45 ($536/yr) — positive.
- The deal already cash-flows at list — no discount required.
- To meet the 1% rule (rent ≥ 1% of price), the offer needs to be $175k (12.3% below list).
- Recommended offer: $175k (12.3% below list) — sets the bar for 1% rule.
- Cap rate 6.6% vs local median 4.2% in Parker — top-decile yield for the area; either an underpriced asset or a hidden risk that comps aren't pricing in. Stress-test before assuming the spread holds.
Location & tenants
- Location reads 74/100 on livability (#31 in SC, #4,642 nationally) — a middle-class / working-renter tenant base. Strengths: commute A+, cost of living A+, housing A+; Watch: schools F, crime F, employment D-.
- Greenville 01 (suburban): math 44% / reading 54% proficiency, ranked #10 of 80 in SC (top 12%) — families likely to look elsewhere, expect single-tenant / working-renter base with shorter leases.
- Market conditions: Rents rising (+1.7%/yr); 278 active listings in the ZIP; 19 comparable units currently listed for rent nearby; rentals at typical pace (median 21d on market — plan ~3-4 weeks tenant-placement turnaround); 5,595 units permitted in Greenville County in 2024 (566 in 5+ unit buildings).
- This rent runs 41% of the median local income ($52k/yr) — at the standard rent-burdened threshold; future hikes will face affordability resistance.
Forward outlook
- Local home prices are declining (-3.0%/yr); year-one equity from $1k of loan paydown is wiped out by about $6k of value loss. Plan a longer hold.
- Greenville County population projected at +34% by 2050 — long-run rental-demand tailwind backs the buy-and-hold thesis.
Negotiation context
- It's been on market 17 days — a 2% lower offer ($196k) is reasonable based on typical stale-listing flexibility.
- 4 sale attempts with the ask held roughly flat each time — persistent listings suggest the price (not the market) is what's stuck; bring a comps-based counter.
Risks & watch-outs
- Climate carrying-cost: major flood risk; extreme-heat days projected 7→16/yr by 2055 (HVAC capex compounding) — expect insurance premiums to compound above CPI over the hold.
Questions for the listing agent
- Built in 1960 — when were the roof, HVAC, electrical panel, plumbing, and water heater last replaced?
- Is there a deadline driving the sale (1031 exchange, divorce, estate, relocation)? That informs how much negotiation room exists.
- Schools are F-rated, which usually means shorter tenancies and higher turnover. Who's the typical renter profile here, and what's been the actual vacancy rate?
- Crime grade is F in this area — have there been break-ins, vandalism, or insurance claims at this property in the last 3 years? What carrier currently insures it and at what premium?
- The area grade is low — what's the realistic commute time and amenity access for the typical tenant pool here? Any planned neighborhood developments (good or bad) we should know about?
- What's the average days-on-market for RENTAL listings here right now (not sales)? A rising rental-DOM trend means longer vacancies and softer asking-rent achievability than the comps imply.
- What's the recent tenant-quality profile in this submarket — average credit score on applications, eviction rate, late-payment / NSF rate, and stable-employment percentage? A property-management company in the area should have these aggregated.
- How much new for-sale + rental construction is in the pipeline within 1–3 miles? Heavy new supply typically softens prices + rents 12–24 months out; constrained supply supports both.
Investment metrics
- 1% rule
- 0.88% ✗
- Cap rate
- 6.56%
- Cash-on-cash
- 0.96%
- DSCR
- 1.04
- GRM
- 9.5
CMA / ARV
- ARV (on-the-fly)
- $195,228
- Comps found
- 8
Show comp detail 8 sales within ~0.75 mi
| Address | Dist | Beds/Ba | Sqft | Sold | Price | $/sf | Match |
|---|---|---|---|---|---|---|---|
| 13 Harris Ave | 0.42mi | 3/1.0 (+1) | 1,100 (+5%) | 8mo | $100,000 | $91 | 60 |
| 221 Beatrice St | 0.67mi | 2/1.0 | 1,008 (-3%) | 11mo | $190,000 | $188 | 54 |
| 105 Francis Ave | 0.72mi | 2/2.0 | 991 (-5%) | 4mo | $182,500 | $184 | 50 |
| 18 Link St | 0.44mi | 3/1.5 (+1) | 1,000 (-4%) | 21mo | $187,000 | $187 | 48 |
| 6 Caren St | 0.48mi | 2/1.0 | 953 (-9%) | 20mo | $175,000 | $184 | 46 |
| 107 Flora Ave | 0.54mi | 3/2.0 (+1) | 1,100 (+5%) | 15mo | $150,000 | $136 | 44 |
| 212 S Texas Ave | 0.74mi | 2/1.0 | 953 (-9%) | 9mo | $185,000 | $194 | 44 |
| 107 Jasmine Dr | 0.67mi | 2/1.0 | 916 (-12%) | 9mo | $188,000 | $205 | 41 |
Match score weights: distance 35% · size 25% · config 20% · recency 20%. Top-matched comps best support the ARV.
Projected returns pro-forma
-3.0% appreciation · 1.72% rent growth · sell at horizon
- IRR
- -16.2%
- Equity multiple
- 0.43×
- Total profit
- $-31,621
- Equity at exit
- $29,672
- IRR
- -10.2%
- Equity multiple
- 0.41×
- Total profit
- $-32,745
- Equity at exit
- $17,206
Cash invested: $55,720 (down + closing). Projections, not guarantees.
Landlord ↔ Tenant lean methodology
- Overall (STATE)
- 90 Strongly Landlord-Friendly
- State South Carolina
- 90 Strongly Landlord-Friendly · R+6
- County
- — inherits STATE
- City
- — inherits STATE
ZIP-level market 29611
- Home prices YoY
- -34.6%
- Rents YoY
- 1.7%
- Active inventory
- 278
- Price-to-rent
- 9.5×
Monthly cashflow live
- Estimated rent
- $1,745 high interval (Pro) →
- Mortgage (P&I)
- −$1,044
- Tax from tax record
- −$207 /mo · $2,489/yr
- Insurance
- −$83
- HOA
- −$0
- Vacancy / Maint / Mgmt
- −$366
- Net cashflow
- $45
Break-even live
Sensitivity live
| Price | -10% $157 | -5% $101 | +0% $45 | +5% $-12 | +10% $-68 |
|---|---|---|---|---|---|
| Rent | -10% $-93 | -5% $-24 | +0% $45 | +5% $114 | +10% $183 |
| Rate | -1.0pp $145 | -0.5pp $95 | base $45 | +0.5pp $-7 | +1.0pp $-59 |
UW: 25.0% down · 7.5% · 30yr · 1.5% tax · 5.0% vac · 8.0% maint · 8.0% mgmt
Financing live
Cash to close
- Down payment
- $49,750
- Closing costs
- $5,970
- Reserves months
- —
- Total cash needed
- —
Loan-product check · same deal, 3 products live
Conventional
25% down · 7.5% · 30yr
- Down + closing
- —
- Monthly P&I
- —
- Monthly cashflow
- —
- DSCR
- —
- Eligible?
- —
Personal DTI + credit; lowest rate.
DSCR
20% down · 8.5% · 30yr
- Down + closing
- —
- Monthly P&I
- —
- Monthly cashflow
- —
- DSCR
- —
- Eligible?
- —
No personal income docs; deal must DSCR.
Hard money
10% down · 12.0% · 12mo
- Down + closing
- —
- Monthly P&I
- —
- Monthly cashflow
- —
- DSCR
- —
- Eligible?
- —
Short-term bridge; refi at stabilization.
Rent comps 19 comps
| Address | Beds | Baths | Sqft | Rent | $/sqft | DOM | Units | Dist |
|---|---|---|---|---|---|---|---|---|
| 3 Lynhurst Dr Greenville, SC | 3.0 | 1.5 | 1177 | $2,500 | $2.12 | 16d | 1 | 0.84mi |
| 15 Best Dr Greenville, SC | 3.0 | 1.5 | 1020 | $1,125 | $1.10 | 21d | 1 | 0.85mi |
| 107 Virginia Ave Greenville, SC | 2.0 | 2.5 | 1134 | $1,699 | $1.50 | 25d | 1 | 0.87mi |
| 109 Virginia Ave Greenville, SC | 2.0 | 2.5 | 1134 | $1,699 | $1.50 | 25d | 1 | 0.89mi |
| 12 Templewood Dr Greenville, SC | 3.0 | 1.0 | 1200 | $1,795 | $1.50 | 25d | 1 | 0.89mi |
| 1014 S Welcome Rd Greenville, SC | 3.0 | 2.0 | 1400 | $2,800 | $2.00 | 4d | 1 | 0.96mi |
| 44 4th Ave Greenville, SC | 3.0 | 2.0 | 1350 | $1,975 | $1.46 | 25d | 1 | 1.03mi |
| 125 Ledbetter St Unit B Greenville, SC | 3.0 | 2.0 | 1270 | $1,850 | $1.46 | 5d | 1 | 1.05mi |
| 5001 Assembly View Cir Greenville, SC | 1.0–3.0 | 1.0–2.0 | 975 | $1,328 | $1.36 | 5d | 27 | 1.05mi |
| 19 Dargan St Greenville, SC | 2.0 | 1.0 | 962 | $1,400 | $1.46 | 16d | 1 | 1.13mi |
| 701 Easley Bridge Rd Greenville, SC | 3.0 | 1.0–2.5 | 1324 | $2,758 | $2.08 | 4d | 110 | 1.19mi |
| 119 Heatherly Dr Greenville, SC | 2.0 | 1.0 | 896 | $950 | $1.06 | 25d | 1 | 1.28mi |
| 19 Saco St Greenville, SC | 2.0 | 2.0 | 1050 | $2,400 | $2.29 | 25d | 1 | 1.30mi |
| 10 10th St Greenville, SC | 2.0 | 1.0 | 1152 | $1,100 | $0.95 | 5d | 1 | 1.35mi |
| 8 Judson Rd Greenville, SC | 2.0 | 1.0 | 944 | $1,200 | $1.27 | 25d | 1 | 1.36mi |
| 7 Iola St Greenville, SC | 3.0 | 2.0 | 1165 | $2,500 | $2.15 | 16d | 1 | 1.37mi |
| 4 Kilgore St Greenville, SC | 2.0 | 1.0 | 1050 | $1,500 | $1.43 | 25d | 1 | 1.37mi |
| 3001 Lizzie Dr Greenville, SC | 1.0–3.0 | 1.0–2.0 | 976 | $1,118 | $1.15 | 25d | 1 | 1.38mi |
| 29 4th St Greenville, SC | 3.0 | 2.0 | 1120 | $1,695 | $1.51 | 5d | 1 | 1.42mi |
Listing history 12 events
-
2026-06-22days on market $199,000 Active 17 DOM
-
2026-06-18days on market $199,000 Active 14 DOM
-
2026-06-17days on market $199,000 Active 13 DOM
-
2026-06-16days on market $199,000 Active 12 DOM
-
2026-06-15days on market $199,000 Active 11 DOM
-
2026-06-13days on market $199,000 Active 9 DOM
-
2026-06-13days on market $199,000 Active 8 DOM
-
2026-06-10days on market $199,000 Active 6 DOM
-
2026-06-09days on market $199,000 Active 5 DOM
-
2026-06-08days on market $199,000 Active 4 DOM
-
2026-06-07remarks 699-char remark
-
2026-06-07$199,000 Active 3 DOM
ⓘ Source: listings_history table (triggers on properties + properties_extension) + one-shot
backfill from property_details.listing_events for pre-trigger history.
Tax reassessment forecast SC · Resets to sale price
- Current annual tax
- $2,489 · $207/mo
- Projected year-2 tax
- $2,489 · $207/mo
- Expected delta
- $0/yr ($0/mo · 0.0%)
ⓘ Screening estimate from a state-policy table — verify with the county assessor before closing.
Climate risk First Street
- Flood 6/10 Major FEMA zone X (unshaded) · 75% chance over 30 yrs
- Wildfire 3/10 Moderate
- Heat 6/10 Major 7 d/yr ≥102°F today · 16 d/yr by 30 yrs out
- Wind 2/10 Low 100% chance of damaging wind over 30 yrs
- Air quality 4/10 Moderate 4 unhealthy d/yr today · 4 by 30 yrs out
Nearby sold comps map
Loading sold comps map…
Walkable amenities ~0.75 mi
Loading nearby amenities…
Taxation est. · year 1
- Rental income
- $20,941
- − Mortgage interest
- −$11,147
- − Property taxes
- −$2,489
- − Insurance
- −$995
- − Repairs & maintenance
- −$1,675
- − Management
- −$1,675
- − Depreciation
- −$5,789
- Taxable loss
- −$2,830
- Est. tax savings @ 24.0%
- +$679
- After-tax cash flow
- $1,215/yr
For passive investors: Depreciation is non-cash, so a rental often shows a tax loss while cash-flowing — sheltering income. Rental losses are passive: they offset passive income freely, and up to $25,000/yr can offset ordinary (W-2) income if you actively participate and your MAGI is under $100k (phasing out to $0 by $150k); unused losses carry forward. On sale, claimed depreciation is recaptured at up to 25%, and gains may owe capital-gains tax (a 1031 exchange can defer both). Figures are a year-1 estimate at your 24.0% rate — not tax advice; consult a CPA.
Schools (NCES district)
- District
- Greenville 01
- NCES district ID
- 4502310
- Math proficiency
- 44% ▼ -10.00%
- Reading proficiency
- 54% ▼ -2.00%
- Median HH income
- $49,596
- Composite
- 41.88/100
- National rank
- #3370
- State rank
- #10 of 80 in SC
Livability — Parker
- Score
- 74/100
- State rank
- #31
- US rank
- #4642
Category grades
Schools grade is shown separately in the Schools card above.
Census & demographics
- Census place
- Parker, SC
- County
- Greenville County · 573,815 people
- Metro
- Greenville-Anderson, SC
- Population (ZIP)
- 32,365
- Household income
- $51,565
- Rent vs Own
- Severe rent burden
- 1754.0
Population outlook (Greenville County) Hauer SSP2
- Today (2025)
- 574,580 people
- By 2030
- 615,615 · +7.1%
- By 2040
- 695,373 · +21.0%
- By 2050
- 769,367 · +33.9%
- By 2075
- 933,296 · +62.4%
- By 2100
- 1,029,196 · +79.1%
Race, ethnicity, and origin ACS 2023
- Neighborhood character
- Highly diverse neighborhood (Simpson 0.70)
- Race & ethnicity
- White 41% Black 29% Hispanic / Latino 22% Two or more races 12%
- Hispanic origin (detail)
- Mexican 12% Puerto Rican 2%
- Common ancestry
- Slovak 1% Italian 1% Serbian 1%
- Foreign-born
- 12% · Canada, Jamaica, China
- Languages at home
- 79% English-only · Spanish 19% Russian/Polish/Slavic 1%
Political lean MEDSL · Greenville
- 2024 margin
- Strong R (+22.2) · D 38.0% · R 60.2% · Other 1.8%
- 2008→2024 swing
- +1.7pp toward D · 2008: -23.9pp · 2024: -22.2pp
- All cycles
- 2024: R+22.2 2020: R+18.2 2016: R+24.7 2012: R+27.8 2008: R+23.9
Not yet ingested
- Civics
- —
Market trends
- HPI YoY
- ▼ -139.58%
- Current HPI
- 264.2891
- Rent YoY
- ▲ 1.72%
- Metro
- Greenville-Anderson, SC
- State GDP YoY
- ▲ 4.51%
- F500 in state
- 2
Industry mix (Fortune 500 HQ in SC)
| Industry | F500 HQs | Revenue |
|---|---|---|
| Packaging | 1 | $7B |
|
||
Price history
-6.1% since first listed13 events — show timeline
- 2026-06-04 Listed $199,000 ForSaleByOwner.com
- 2026-05-28 Sold (Public Records) $195,000 Public Records
- 2026-03-02 Listing Removed — Greater Greenville MLS
- 2026-02-20 Price Changed $195,000 Greater Greenville MLS
- 2026-02-12 Price Changed $199,000 Greater Greenville MLS
- 2026-02-03 Relisted — Greater Greenville MLS
- 2026-01-30 Pending — Greater Greenville MLS
- 2026-01-29 Price Changed $200,000 Greater Greenville MLS
- 2026-01-16 Price Changed $207,000 Greater Greenville MLS
- 2025-12-24 Relisted — Greater Greenville MLS
- 2025-12-22 Pending — Greater Greenville MLS
- 2025-12-20 Price Changed $210,000 Greater Greenville MLS
- 2025-12-05 Listed $212,000 Greater Greenville MLS
Property tax history
+14.9%/yrLatest (2025): $2,489 · +3.4% YoY. Source: county tax records.
Cash-flow waterfall
monthlySold comps — $/sqft
last 12 mo · ≤1 miLoading sold comps…