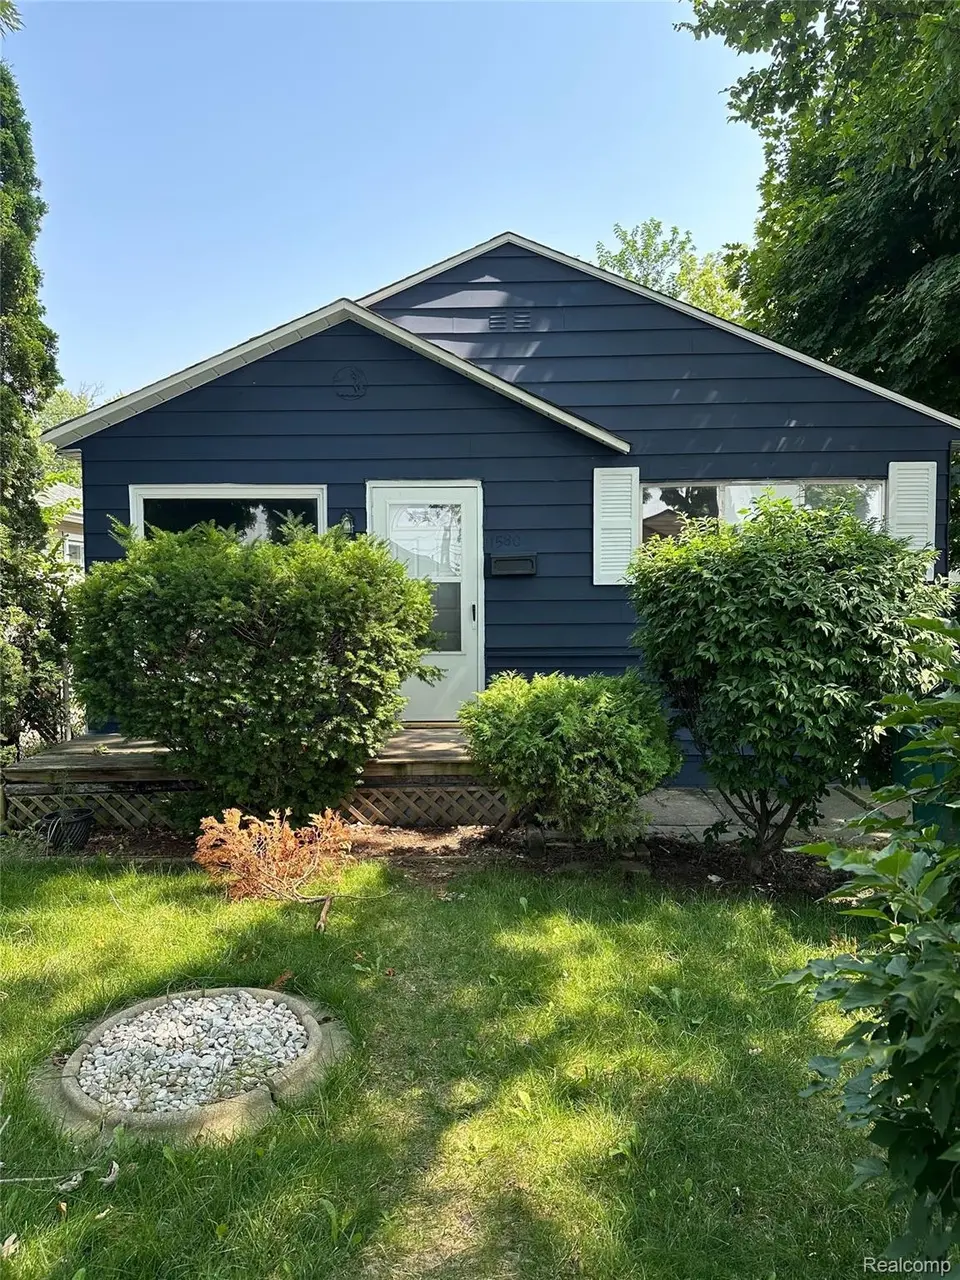
1580 University Ave · Lincoln Park, MI
Flood risk 1/10 · Minimal
- FEMA flood zone
- X (unshaded)
- Chance of flooding over 30 yrs
- 0.0%
- Est. flood insurance / yr
- $507 – $1,088
Fire risk 1/10 · Minimal
- Est. fire insurance / yr
- $784 – $1,456
Heat risk 3/10 · Minor
- Hot days now (above 97°F)
- 7 days/yr
- Hot days in 30 yrs
- 15 days/yr
Wind risk 2/10 · Minimal
- Chance of severe wind over 30 yrs
- —
Air-quality risk 3/10 · Minor
- Unhealthy air days now
- 2 days/yr
- Unhealthy air days in 30 yrs
- 4 days/yr
Risk factors via First Street. Map © Google.
Why this score? — see what drove the D- grade
The composite is a weighted blend of 9 inputs, each scored 0–100. Each bar is that input's sub-score; the figure is the points it added to the 100-point composite (weight × sub-score).
- Cash flow +14.7/30.0
- 1% rule +4.8/10.0
- DSCR +4.5/10.0
- Livability +4.0/5.0
- Rent growth +3.7/5.0
- Condition / age +2.5/5.0
- Schools +2.0/10.0
- ARV discount +1.0/15.0
- Appreciation +0.0/10.0
$140,000
🖨 Deal sheet (PDF) 📄 Offer letter ✓ Due diligence
Listing remarks MLS
Investor special offering flexibility for both investors and owner occupants alike. This well maintained 3 bedroom, 1 bathroom ranch in Lincoln Park presents an excellent opportunity to expand your portfolio or secure an affordable primary residence. Featuring an attached garage, functional layout, central air, and a fenced backyard, this home offers strong long term potential with immediate usability. The property is currently tenant occupied, however the tenant may remain for investors seeking immediate rental income or vacate for buyers planning to occupy the home personally. Conveniently located near shopping, dining, parks, schools, and major freeways. Unique opportunity to purchase one property individually or package together with additional available homes from the same portfolio. Buy one, two, or all three. A versatile opportunity for investors, first time buyers, or those looking to expand their real estate holdings. Welcome Home.
Key facts
- Attached garage
- Functional layout
- Fenced backyard
Tags
Property features AI
Exterior
- Parking: Attached garage (1 car)
- Utilities: Public water; Public sewer
- Home design: Single-family residence; One story; Ground-level entry
- Construction: Asphalt construction materials; Asphalt roof; Slab foundation; Built on a 0.08-acre lot (approx. 35 x 105)
- Exterior features: Paved road access; No pool
Interior
- Bathrooms: One full bathroom
- Heating & cooling: Forced air heating (natural gas); Central air conditioning; Ceiling fans
- Interior features: Gas water heater; Three total rooms
Neighborhood map
What this means for you Summary
Snapshot
- This is a 3-bed/1.0-bath single-family listed at $140k.
Deal economics
- At list price, monthly cash flow is $36 ($430/yr) — positive.
- The deal already cash-flows at list — no discount required.
- To meet the 1% rule (rent ≥ 1% of price), the offer needs to be $137k (1.8% below list).
- Recommended offer: $137k (1.8% below list) — sets the bar for 1% rule.
Location & tenants
- Location reads 80/100 on livability (#82 in MI, #1,720 nationally) — a professional / high-income tenant draw. Strengths: amenities A+, commute A+, cost of living A+; Watch: crime F, employment D-.
- Lincoln Park School District (suburban): math 15% / reading 32% proficiency, ranked #440 of 540 in MI (top 82%) — low school quality limits family demand, transient renter base, plan for 1-2y turnover; 72% free/reduced lunch — lower-income household profile, screen leases tightly.
- Zoned schools: Lafayette School (math 12% / reading 22%, grade F, #1,149 of 1,397 statewide, top 84%, 500 students, 98% FRL); Lincoln Park Middle School (math 12% / reading 35%, grade F, #399 of 493 statewide, top 81%, 1,105 students, 86% FRL); Lincoln Park High School (math 5% / reading 33%, grade F, #630 of 713 statewide, top 88%, 1,367 students, 79% FRL) — zoned schools average 88% FRL vs 72% district-wide (15 pts higher); higher-poverty schools than district average — tighter screening recommended.
- Market conditions: Rents rising fast (+4.7%/yr); 154 active listings in the ZIP; 11 comparable units currently listed for rent nearby; rentals at typical pace (median 19d on market — plan ~3-4 weeks tenant-placement turnaround); 2,639 units permitted in Wayne County in 2024 (1,216 in 5+ unit buildings).
Forward outlook
- Local home prices are declining (-3.0%/yr); year-one equity from $968 of loan paydown is wiped out by about $4k of value loss. Plan a longer hold.
- Wayne County population projected at -17% by 2050 — secular population decline; favor cash flow + early exit over multi-decade hold.
Negotiation context
- Only 7 days on market — expect competitive offers; lowballing is unlikely to land.
- 2 sale attempts with the ask held roughly flat each time — persistent listings suggest the price (not the market) is what's stuck; bring a comps-based counter.
- Current owner paid $29k; list at $140k implies a 383% gain — meaningful room to come down on a strong offer.
Risks & watch-outs
- Watch-outs: built in 1954 — expect roof / HVAC / electrical / plumbing capex.
Questions for the listing agent
- Built in 1954 — when were the roof, HVAC, electrical panel, plumbing, and water heater last replaced?
- Is there a deadline driving the sale (1031 exchange, divorce, estate, relocation)? That informs how much negotiation room exists.
- Schools are D-rated, which usually means shorter tenancies and higher turnover. Who's the typical renter profile here, and what's been the actual vacancy rate?
- Crime grade is F in this area — have there been break-ins, vandalism, or insurance claims at this property in the last 3 years? What carrier currently insures it and at what premium?
- The area grade is low — what's the realistic commute time and amenity access for the typical tenant pool here? Any planned neighborhood developments (good or bad) we should know about?
- What's the average days-on-market for RENTAL listings here right now (not sales)? A rising rental-DOM trend means longer vacancies and softer asking-rent achievability than the comps imply.
- What's the recent tenant-quality profile in this submarket — average credit score on applications, eviction rate, late-payment / NSF rate, and stable-employment percentage? A property-management company in the area should have these aggregated.
- How much new for-sale + rental construction is in the pipeline within 1–3 miles? Heavy new supply typically softens prices + rents 12–24 months out; constrained supply supports both.
Investment metrics
- 1% rule
- 0.98% ✗
- Cap rate
- 6.60%
- Cash-on-cash
- 1.10%
- DSCR
- 1.05
- GRM
- 8.5
CMA / ARV
- ARV (on-the-fly)
- $122,400
- Comps found
- 12
Show comp detail 12 sales within ~0.75 mi
| Address | Dist | Beds/Ba | Sqft | Sold | Price | $/sf | Match |
|---|---|---|---|---|---|---|---|
| 1587 Reo Ave | 0.18mi | 3/1.0 | 816 (0%) | 5mo | $122,000 | $150 | 87 |
| 1383 Cicotte Ave | 0.24mi | 3/1.0 | 850 (+4%) | 6mo | $135,000 | $159 | 77 |
| 1807 Hanford Ave | 0.35mi | 2/1.0 (-1) | 792 (-3%) | 2mo | $130,000 | $164 | 72 |
| 1770 Council Ave | 0.42mi | 3/1.0 | 864 (+6%) | 0mo | $125,000 | $145 | 70 |
| 1807 Morris Ave | 0.36mi | 2/1.0 (-1) | 768 (-6%) | 5mo | $133,000 | $173 | 64 |
| 1539 Oconnor Ave | 0.35mi | 2/1.0 (-1) | 725 (-11%) | 4mo | $70,000 | $97 | 57 |
| 1473 Austin Ave | 0.65mi | 3/1.0 | 864 (+6%) | 6mo | $126,150 | $146 | 55 |
| 1260 Marion Ave | 0.70mi | 3/1.0 | 874 (+7%) | 1mo | $155,000 | $177 | 55 |
| 2040 Paris Ave | 0.55mi | 3/1.0 | 894 (+10%) | 4mo | $147,500 | $165 | 55 |
| 1921 Hanford Ave | 0.48mi | 3/1.0 | 912 (+12%) | 4mo | $80,000 | $88 | 55 |
| 1428 Chandler Ave | 0.56mi | 2/1.0 (-1) | 720 (-12%) | 2mo | $75,000 | $104 | 48 |
| 1312 Ferris Ave | 0.65mi | 3/1.5 | 930 (+14%) | 4mo | $117,000 | $126 | 41 |
Match score weights: distance 35% · size 25% · config 20% · recency 20%. Top-matched comps best support the ARV.
Projected returns pro-forma
-3.0% appreciation · 4.65% rent growth · sell at horizon
- IRR
- -12.5%
- Equity multiple
- 0.54×
- Total profit
- $-18,015
- Equity at exit
- $20,874
- IRR
- -0.9%
- Equity multiple
- 0.93×
- Total profit
- $-2,618
- Equity at exit
- $12,105
Cash invested: $39,200 (down + closing). Projections, not guarantees.
Landlord ↔ Tenant lean methodology
- Overall (STATE)
- 62 Landlord-Friendly
- State Michigan
- 62 Landlord-Friendly · EVEN
- County
- — inherits STATE
- City
- — inherits STATE
ZIP-level market 48146
- Home prices YoY
- -32.7%
- Rents YoY
- 4.7%
- Active inventory
- 154
- Price-to-rent
- 8.5×
Monthly cashflow live
- Estimated rent
- $1,374 high interval (Pro) →
- Mortgage (P&I)
- −$734
- Tax from tax record
- −$257 /mo · $3,088/yr
- Insurance
- −$58
- HOA
- −$0
- Vacancy / Maint / Mgmt
- −$289
- Net cashflow
- $36
Break-even live
Sensitivity live
| Price | -10% $115 | -5% $75 | +0% $36 | +5% $-4 | +10% $-43 |
|---|---|---|---|---|---|
| Rent | -10% $-73 | -5% $-18 | +0% $36 | +5% $90 | +10% $144 |
| Rate | -1.0pp $106 | -0.5pp $71 | base $36 | +0.5pp $0 | +1.0pp $-37 |
UW: 25.0% down · 7.5% · 30yr · 1.5% tax · 5.0% vac · 8.0% maint · 8.0% mgmt
Financing live
Cash to close
- Down payment
- $35,000
- Closing costs
- $4,200
- Reserves months
- —
- Total cash needed
- —
Loan-product check · same deal, 3 products live
Conventional
25% down · 7.5% · 30yr
- Down + closing
- —
- Monthly P&I
- —
- Monthly cashflow
- —
- DSCR
- —
- Eligible?
- —
Personal DTI + credit; lowest rate.
DSCR
20% down · 8.5% · 30yr
- Down + closing
- —
- Monthly P&I
- —
- Monthly cashflow
- —
- DSCR
- —
- Eligible?
- —
No personal income docs; deal must DSCR.
Hard money
10% down · 12.0% · 12mo
- Down + closing
- —
- Monthly P&I
- —
- Monthly cashflow
- —
- DSCR
- —
- Eligible?
- —
Short-term bridge; refi at stabilization.
Rent comps 11 comps
| Address | Beds | Baths | Sqft | Rent | $/sqft | DOM | Units | Dist |
|---|---|---|---|---|---|---|---|---|
| 1524 Cicotte Ave Lincoln Park, MI | 2.0 | 1.0 | 900 | $1,250 | $1.39 | 16d | 1 | 0.12mi |
| 1774 College Ave Lincoln Park, MI | 3.0 | 1.0 | 944 | $1,525 | $1.62 | 0d | 1 | 0.28mi |
| 1532 Euclid St #1 Lincoln Park, MI | 2.0 | 1.0 | 850 | $1,450 | $1.71 | 26d | 1 | 0.29mi |
| 1774 Council Ave Lincoln Park, MI | 3.0 | 1.0 | 864 | $1,500 | $1.74 | 0d | 1 | 0.40mi |
| 1552 Hanover St Lincoln Park, MI | 2.0 | 1.0 | 800 | $1,250 | $1.56 | 26d | 1 | 0.54mi |
| 875 Raupp Pl Unit 2 Lincoln Park, MI | 2.0 | 1.0 | 800 | $970 | $1.21 | 18d | 1 | 0.59mi |
| 1537 Chandler Ave Lincoln Park, MI | 2.0 | 1.0 | 725 | $1,100 | $1.52 | 19d | 1 | 0.65mi |
| 3575 S Ethel St Detroit, MI | 3.0 | 1.0 | 894 | $1,350 | $1.51 | 19d | 1 | 0.95mi |
| 1581 Empire Ave Lincoln Park, MI | 2.0 | 1.0 | 900 | $1,350 | $1.50 | 26d | 1 | 1.07mi |
| 1331 Pingree Ave Lincoln Park, MI | 2.0 | 1.0 | 725 | $1,300 | $1.79 | 1d | 1 | 1.08mi |
| 3748 15th St Ecorse, MI | 2.0 | 1.0 | 528 | $1,099 | $2.08 | 18d | 1 | 1.44mi |
Listing history 3 events
-
2026-05-19$140,000 Active
Show marketing remark (954 chars)
Investor special offering flexibility for both investors and owner occupants alike. This well maintained 3 bedroom, 1 bathroom ranch in Lincoln Park presents an excellent opportunity to expand your portfolio or secure an affordable primary residence. Featuring an attached garage, functional layout, central air, and a fenced backyard, this home offers strong long term potential with immediate usability. The property is currently tenant occupied, however the tenant may remain for investors seeking immediate rental income or vacate for buyers planning to occupy the home personally. Conveniently located near shopping, dining, parks, schools, and major freeways. Unique opportunity to purchase one property individually or package together with additional available homes from the same portfolio. Buy one, two, or all three. A versatile opportunity for investors, first time buyers, or those looking to expand their real estate holdings. Welcome Home.
-
2026-05-19$140,000 Active 954-char remark
Show marketing remark (954 chars)
Investor special offering flexibility for both investors and owner occupants alike. This well maintained 3 bedroom, 1 bathroom ranch in Lincoln Park presents an excellent opportunity to expand your portfolio or secure an affordable primary residence. Featuring an attached garage, functional layout, central air, and a fenced backyard, this home offers strong long term potential with immediate usability. The property is currently tenant occupied, however the tenant may remain for investors seeking immediate rental income or vacate for buyers planning to occupy the home personally. Conveniently located near shopping, dining, parks, schools, and major freeways. Unique opportunity to purchase one property individually or package together with additional available homes from the same portfolio. Buy one, two, or all three. A versatile opportunity for investors, first time buyers, or those looking to expand their real estate holdings. Welcome Home.
-
1991-08-23soldstatus $29,000
ⓘ Source: listings_history table (triggers on properties + properties_extension) + one-shot
backfill from property_details.listing_events for pre-trigger history.
Tax reassessment forecast MI · Partial reset (capped growth)
- Current annual tax
- $3,088 · $257/mo
- Projected year-2 tax
- $3,088 · $257/mo
- Expected delta
- $0/yr ($0/mo · 0.0%)
ⓘ Screening estimate from a state-policy table — verify with the county assessor before closing.
Climate risk First Street
- Flood 1/10 Low FEMA zone X (unshaded) · 0% chance over 30 yrs
- Wildfire 1/10 Low
- Heat 3/10 Moderate 7 d/yr ≥97°F today · 15 d/yr by 30 yrs out
- Wind 2/10 Low
- Air quality 3/10 Moderate 2 unhealthy d/yr today · 4 by 30 yrs out
Nearby sold comps map
Loading sold comps map…
Walkable amenities ~0.75 mi
Loading nearby amenities…
Taxation est. · year 1
- Rental income
- $16,491
- − Mortgage interest
- −$7,842
- − Property taxes
- −$3,088
- − Insurance
- −$700
- − Repairs & maintenance
- −$1,319
- − Management
- −$1,319
- − Depreciation
- −$4,073
- Taxable loss
- −$1,850
- Est. tax savings @ 24.0%
- +$444
- After-tax cash flow
- $874/yr
For passive investors: Depreciation is non-cash, so a rental often shows a tax loss while cash-flowing — sheltering income. Rental losses are passive: they offset passive income freely, and up to $25,000/yr can offset ordinary (W-2) income if you actively participate and your MAGI is under $100k (phasing out to $0 by $150k); unused losses carry forward. On sale, claimed depreciation is recaptured at up to 25%, and gains may owe capital-gains tax (a 1031 exchange can defer both). Figures are a year-1 estimate at your 24.0% rate — not tax advice; consult a CPA.
Schools (NCES district)
- District
- Lincoln Park School District
- NCES district ID
- 2621600
- Math proficiency
- 15% ▼ -5.00%
- Reading proficiency
- 32% ▬ 0.00%
- Median HH income
- $41,486
- Composite
- 19.93/100
- National rank
- #8678
- State rank
- #440 of 540 in MI
Livability — Lincoln Park
- Score
- 80/100
- State rank
- #82
- US rank
- #1720
Category grades
Schools grade is shown separately in the Schools card above.
Census & demographics
- Census place
- Lincoln Park, MI
- County
- Wayne County · 1,562,939 people
- City population
- 39,257
- Metro
- Detroit-Warren-Dearborn, MI
- Population (ZIP)
- 39,257
- Household income
- $58,616
- Rent vs Own
- Severe rent burden
- 1142.0
Population outlook (Wayne County) Hauer SSP2
- Today (2025)
- 1,675,273 people
- By 2030
- 1,620,300 · -3.3%
- By 2040
- 1,502,341 · -10.3%
- By 2050
- 1,384,039 · -17.4%
- By 2075
- 1,124,592 · -32.9%
- By 2100
- 881,193 · -47.4%
Race, ethnicity, and origin ACS 2023
- Neighborhood character
- Diverse neighborhood (Simpson 0.57)
- Race & ethnicity
- White 60% Hispanic / Latino 25% Two or more races 12% Black 9% Native American 1%
- Hispanic origin (detail)
- Mexican 19% Puerto Rican 3%
- Common ancestry
- Romanian 6% Lithuanian 4% Slovak 1%
- Foreign-born
- 9% · Canada
- Languages at home
- 80% English-only · Spanish 17% Arabic 2%
Political lean MEDSL · Wayne
- 2024 margin
- Strong D (+29.0) · D 62.7% · R 33.7% · Other 3.6%
- 2008→2024 swing
- -20.5pp toward R · 2008: 49.5pp · 2024: 29.0pp
- All cycles
- 2024: D+29.0 2020: D+38.1 2016: D+37.3 2012: D+46.9 2008: D+49.5
Not yet ingested
- Civics
- —
Market trends
- HPI YoY
- ▼ -108.25%
- Current HPI
- 222.8545
- Rent YoY
- ▲ 4.65%
- Metro
- Detroit-Warren-Dearborn, MI
- State GDP YoY
- ▲ 1.37%
- F500 in state
- 28
Industry mix (Fortune 500 HQ in MI)
| Industry | F500 HQs | Revenue |
|---|---|---|
| Automotive Parts | 3 | $48B |
|
||
| Automotive | 2 | $372B |
|
||
| Chemicals | 1 | $45B |
|
||
| Automotive Retail | 1 | $29B |
|
||
| Healthcare / Medical Devices | 1 | $23B |
|
||
| Automotive Technology | 1 | $20B |
|
||
Price history
+382.8% since first listed3 events — show timeline
- 2026-05-19 Listed $140,000 MiRealSource-MiMLS
- 2026-05-19 Listed $140,000 REALCOMP
- 1991-08-23 Sold (Public Records) $29,000 Public Records
Property tax history
+12.7%/yrLatest (2025): $3,088 · +143.9% YoY. Source: county tax records.
Cash-flow waterfall
monthlySold comps — $/sqft
last 12 mo · ≤1 miLoading sold comps…